The median household income in Grill, PA in 2022 was $129,320, which was 44.5% greater than the median annual income of $71,798 across the entire state of Pennsylvania. Compared to the median income of $44,714 in 2000 this represents an increase of 65.4%. The per capita income in 2022 was $44,607, which means an increase of 52.4% compared to 2000 when it was $21,232.
Whole page based on the data from 2000 / 2022 when the population of Grill, Pennsylvania was 1,468 / 2,024
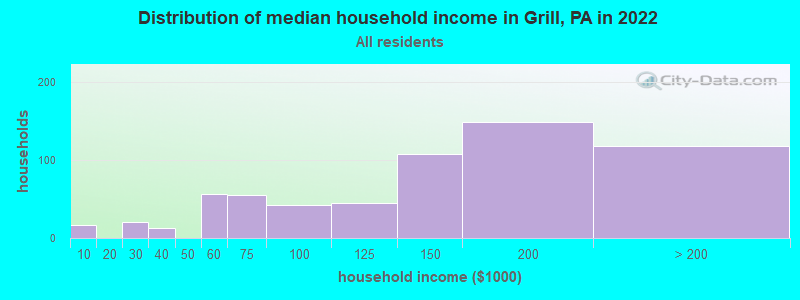
Income statistics for all residents
Median household income in Grill, PA in 2022:
Grill:
$129,321
State:
$71,798
Number of households with income < $10k:
Grill:
2.7% (17)
State:
5.5% (291,562)
Number of households with income $10k - 20k:
Grill:
0.0% (0)
State:
7.3% (384,726)
Number of households with income $20k - 30k:
Grill:
3.4% (21)
State:
7.4% (389,464)
Number of households with income $30k - 40k:
Grill:
2.1% (13)
State:
7.6% (402,138)
Number of households with income $40k - 50k:
Grill:
0.0% (0)
Pennsylvania:
7.3% (387,945)
Number of households with income $50k - 60k:
Grill:
9.0% (56)
State:
7.0% (372,468)
Number of households with income $60k - 75k:
Grill:
8.8% (55)
State:
9.9% (524,786)
Number of households with income $75k - 100k:
Grill:
6.9% (43)
Pennsylvania:
12.6% (666,253)
Number of households with income $100k - 125k:
Grill:
7.2% (45)
Pennsylvania:
9.9% (526,402)
Number of households with income $125k - 150k:
Grill:
17.3% (108)
State:
6.9% (362,702)
Number of households with income $150k - 200k:
Grill:
23.8% (149)
State:
8.3% (440,827)
Number of households with income > $200k:
Grill:
18.9% (118)
State:
10.3% (544,792)
Aggregate household income in Grill in 2022: $84,249,815
Median family income in Grill in 2022:
Grill:
$127,959
State:
$93,029
Number of families with income < $10k:
Grill:
2.3% (13)
State:
3.1% (101,868)
Number of families with income $20k - 30k:
Grill:
4.3% (24)
Pennsylvania:
4.8% (156,521)
Number of families with income $50k - 60k:
Grill:
10.5% (59)
State:
6.4% (209,910)
Number of families with income $60k - 75k:
Grill:
5.8% (33)
Pennsylvania:
9.7% (318,991)
Number of families with income $75k - 100k:
Grill:
6.0% (34)
State:
14.0% (461,021)
Number of families with income $100k - 125k:
Grill:
8.1% (46)
Pennsylvania:
12.2% (400,961)
Number of families with income $125k - 150k:
Grill:
19.1% (108)
State:
8.8% (288,471)
Number of families with income $150k - 200k:
Grill:
26.3% (149)
State:
11.2% (367,642)
Number of families with income > $200k:
Grill:
17.7% (100)
State:
14.3% (470,863)
Median per capita income in Grill in 2022:
Grill:
$44,607
State:
$41,489
Change in median per capita income between 2000 and 2022:
Grill, Pennsylvania:
+110.1%
State:
+98.7%
Income statistics for White residents
Median household income in Grill, PA in 2022:
Grill:
$133,072
Pennsylvania:
$76,765
Number of households with income < $10k:
Grill:
3.4% (17)
State:
4.3% (179,792)
Number of households with income $10k - 20k:
Grill:
0.0% (0)
Pennsylvania:
6.5% (268,738)
Number of households with income $20k - 30k:
Grill:
0.0% (0)
State:
7.0% (288,138)
Number of households with income $30k - 40k:
Grill:
2.4% (12)
Pennsylvania:
7.2% (300,208)
Number of households with income $40k - 50k:
Grill:
0.0% (0)
State:
7.2% (298,756)
Number of households with income $50k - 60k:
Grill:
5.4% (27)
State:
6.8% (283,251)
Number of households with income $60k - 75k:
Grill:
10.1% (51)
State:
9.9% (408,159)
Number of households with income $75k - 100k:
Grill:
8.7% (44)
Pennsylvania:
13.2% (547,809)
Number of households with income $100k - 125k:
Grill:
8.5% (43)
State:
10.5% (436,652)
Number of households with income $125k - 150k:
Grill:
20.1% (101)
State:
7.3% (304,132)
Number of households with income $150k - 200k:
Grill:
27.4% (138)
State:
9.0% (374,658)
Number of households with income > $200k:
Grill:
13.9% (70)
Pennsylvania:
10.9% (452,618)
Aggregate household income in Grill in 2022: $66,719,457
Median family income in Grill in 2022:
Grill:
$132,766
Pennsylvania:
$99,396
Number of families with income < $10k:
Grill:
2.4% (11)
State:
2.2% (56,136)
Number of families with income $50k - 60k:
Grill:
6.9% (30)
State:
6.1% (157,983)
Number of families with income $60k - 75k:
Grill:
7.1% (31)
State:
9.6% (249,292)
Number of families with income $75k - 100k:
Grill:
7.7% (34)
State:
14.7% (379,316)
Number of families with income $100k - 125k:
Grill:
9.7% (43)
State:
12.9% (333,626)
Number of families with income $125k - 150k:
Grill:
22.5% (99)
State:
9.4% (243,915)
Number of families with income $150k - 200k:
Grill:
31.8% (140)
State:
12.2% (314,926)
Number of families with income > $200k:
Grill:
11.9% (52)
Pennsylvania:
15.1% (390,885)
Median per capita income in Grill in 2022:
Grill:
$43,955
State:
$45,306
Change in median per capita income between 2000 and 2022:
Grill, Pennsylvania:
+95.5%
Pennsylvania:
+105.4%
Income statistics for Asian residents
Number of households with income < $10k:
Grill:
0.0% (0)
State:
5.8% (9,650)
Number of households with income $10k - 20k:
Grill:
0.0% (0)
State:
4.3% (7,158)
Number of households with income $20k - 30k:
Grill:
100.0% (17)
State:
5.7% (9,531)
Number of households with income $30k - 40k:
Grill:
0.0% (0)
State:
5.7% (9,580)
Number of households with income $40k - 50k:
Grill:
0.0% (0)
Pennsylvania:
5.4% (9,050)
Number of households with income $50k - 60k:
Grill:
0.0% (0)
State:
6.1% (10,189)
Number of households with income $60k - 75k:
Grill:
0.0% (0)
State:
7.8% (13,008)
Number of households with income $75k - 100k:
Grill:
0.0% (0)
Pennsylvania:
10.1% (16,923)
Number of households with income $100k - 125k:
Grill:
0.0% (0)
State:
8.8% (14,765)
Number of households with income $125k - 150k:
Grill:
0.0% (0)
Pennsylvania:
7.5% (12,634)
Number of households with income $150k - 200k:
Grill:
0.0% (0)
Pennsylvania:
10.0% (16,823)
Number of households with income > $200k:
Grill:
0.0% (0)
State:
22.9% (38,426)
Aggregate household income in Grill in 2022: $302,063,500
Median per capita income in Grill in 2022:
Grill:
$42,721
State:
$48,341
Change in median per capita income between 2000 and 2022:
Grill, Pennsylvania:
+90.5%
State:
+140.6%
Income statistics for Hispanic or Latino residents
Number of households with income < $10k:
Grill:
0.0% (0)
State:
8.7% (29,517)
Number of households with income $10k - 20k:
Grill:
0.0% (0)
State:
10.0% (33,785)
Number of households with income $20k - 30k:
Grill:
0.0% (0)
Pennsylvania:
9.9% (33,399)
Number of households with income $30k - 40k:
Grill:
0.0% (0)
State:
8.8% (29,878)
Number of households with income $40k - 50k:
Grill:
0.0% (0)
State:
8.5% (28,549)
Number of households with income $50k - 60k:
Grill:
61.7% (29)
Pennsylvania:
7.6% (25,792)
Number of households with income $60k - 75k:
Grill:
0.0% (0)
State:
10.6% (35,808)
Number of households with income $75k - 100k:
Grill:
0.0% (0)
Pennsylvania:
11.9% (40,287)
Number of households with income $100k - 125k:
Grill:
14.9% (7)
Pennsylvania:
8.0% (27,028)
Number of households with income $125k - 150k:
Grill:
23.4% (11)
Pennsylvania:
5.2% (17,622)
Number of households with income $150k - 200k:
Grill:
0.0% (0)
State:
5.2% (17,563)
Number of households with income > $200k:
Grill:
0.0% (0)
State:
5.5% (18,469)
Aggregate household income in Grill in 2022: $3,963,986
Median per capita income in Grill in 2022:
Grill:
$23,107
Pennsylvania:
$23,829
Income statistics for Multirace residents
Number of households with income < $10k:
Grill:
0.0% (0)
State:
7.8% (21,911)
Number of households with income $10k - 20k:
Grill:
0.0% (0)
State:
8.2% (22,847)
Number of households with income $20k - 30k:
Grill:
0.0% (0)
Pennsylvania:
8.7% (24,252)
Number of households with income $30k - 40k:
Grill:
0.0% (0)
State:
7.3% (20,502)
Number of households with income $40k - 50k:
Grill:
0.0% (0)
State:
7.7% (21,525)
Number of households with income $50k - 60k:
Grill:
0.0% (0)
State:
8.6% (24,174)
Number of households with income $60k - 75k:
Grill:
0.0% (0)
State:
11.9% (33,350)
Number of households with income $75k - 100k:
Grill:
0.0% (0)
State:
11.5% (32,274)
Number of households with income $100k - 125k:
Grill:
0.0% (0)
State:
8.3% (23,361)
Number of households with income $125k - 150k:
Grill:
16.7% (14)
State:
5.3% (14,784)
Number of households with income $150k - 200k:
Grill:
0.0% (0)
State:
6.9% (19,314)
Number of households with income > $200k:
Grill:
83.3% (70)
Pennsylvania:
7.8% (21,759)
Aggregate household income in Grill in 2022: $1,219,351,600
Median per capita income in Grill in 2022:
Grill:
$49,197
Pennsylvania:
$27,581
Income statistics for other residents
Number of households with income < $10k:
Grill:
0.0% (0)
State:
9.2% (14,206)
Number of households with income $10k - 20k:
Grill:
0.0% (0)
State:
11.0% (17,038)
Number of households with income $20k - 30k:
Grill:
0.0% (0)
State:
11.0% (17,000)
Number of households with income $30k - 40k:
Grill:
0.0% (0)
State:
11.0% (17,022)
Number of households with income $40k - 50k:
Grill:
0.0% (0)
State:
7.7% (11,829)
Number of households with income $50k - 60k:
Grill:
100.0% (16)
State:
8.0% (12,320)
Number of households with income $60k - 75k:
Grill:
0.0% (0)
State:
8.8% (13,590)
Number of households with income $75k - 100k:
Grill:
0.0% (0)
State:
10.5% (16,166)
Number of households with income $100k - 125k:
Grill:
0.0% (0)
State:
8.0% (12,371)
Number of households with income $125k - 150k:
Grill:
0.0% (0)
State:
4.0% (6,190)
Number of households with income $150k - 200k:
Grill:
0.0% (0)
State:
5.1% (7,862)
Number of households with income > $200k:
Grill:
0.0% (0)
State:
5.6% (8,691)
Aggregate household income in Grill in 2022: $748,269,100
Median per capita income in Grill in 2022:
Grill:
$20,454
State:
$24,779
Change in median per capita income between 2000 and 2022:
Grill, Pennsylvania:
+128.4%
State:
+157.6%
Discuss Grill, Pennsylvania (PA) on our hugely popular Pennsylvania forum.