Hadley, Massachusetts (MA) income map, earnings map, and wages data
The median household income in Hadley, MA in 2022 was $92,321, which was 2.3% less than the median annual income of $94,488 across the entire state of Massachusetts. Compared to the median income of $51,851 in 2000 this represents an increase of 43.8%. The per capita income in 2022 was $47,848, which means an increase of 47.9% compared to 2000 when it was $24,945.
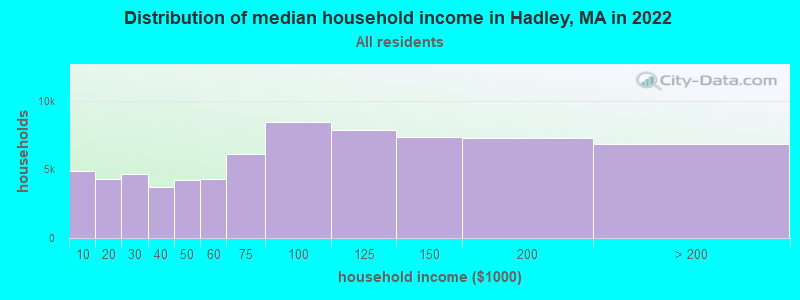
Income statistics for all residents
Median household income in Hadley, MA in 2022:| Hadley: | $92,321 |
| Massachusetts: | $94,488 |
Change in median household income between 2000 and 2022:| Hadley, Massachusetts: | +78.1% |
| State: | +87.1% |
Number of households with income < $10k:| Hadley: | 7.0% (4,886) |
| State: | 5.2% (146,170) |
Number of households with income $10k - 20k:| Hadley: | 6.1% (4,290) |
| State: | 6.4% (180,001) |
Number of households with income $20k - 30k:| Hadley: | 6.6% (4,633) |
| State: | 5.6% (156,667) |
Number of households with income $30k - 40k:| Hadley: | 5.3% (3,721) |
| Massachusetts: | 5.6% (157,168) |
Number of households with income $40k - 50k:| Hadley: | 6.0% (4,187) |
| Massachusetts: | 5.4% (151,455) |
Number of households with income $50k - 60k:| Hadley: | 6.2% (4,318) |
| State: | 5.1% (142,726) |
Number of households with income $60k - 75k:| Hadley: | 8.7% (6,086) |
| State: | 7.6% (212,203) |
Number of households with income $75k - 100k:| Hadley: | 12.1% (8,438) |
| Massachusetts: | 11.3% (317,064) |
Number of households with income $100k - 125k:| Hadley: | 11.2% (7,866) |
| Massachusetts: | 9.7% (270,603) |
Number of households with income $125k - 150k:| Hadley: | 10.5% (7,346) |
| State: | 8.0% (223,140) |
Number of households with income $150k - 200k:| Hadley: | 10.4% (7,304) |
| State: | 11.0% (308,695) |
Number of households with income > $200k:| Hadley: | 9.8% (6,861) |
| State: | 19.0% (531,884) |
Aggregate household income in Hadley in 2022: $367,377,417
Median family income in Hadley in 2022:| Hadley: | $121,437 |
| State: | $120,263 |
Median non-family income in Hadley in 2022:| Hadley: | $52,883 |
| Massachusetts: | $55,979 |
Change in median non-family income between 2000 and 2022:| Hadley, Massachusetts: | +62.3% |
| State: | +88.0% |
Median per capita income in Hadley in 2022:| Hadley: | $47,848 |
| State: | $54,025 |
Change in median per capita income between 2000 and 2022:| Hadley, Massachusetts: | +91.8% |
| Massachusetts: | +108.2% |
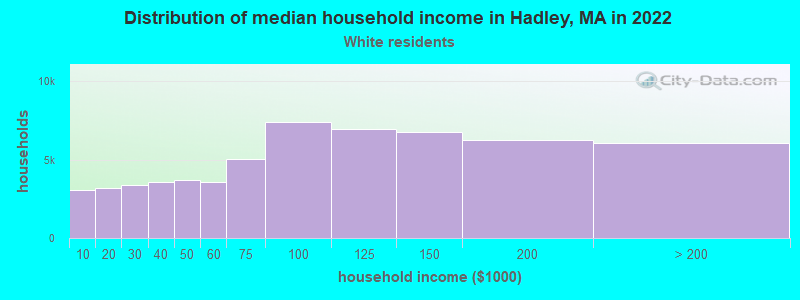
Income statistics for White residents
Median household income in Hadley, MA in 2022:| Hadley: | $95,657 |
| State: | $101,391 |
Change in median household income between 2000 and 2022:| Hadley, Massachusetts: | +84.3% |
| State: | +93.3% |
Number of households with income < $10k:| Hadley: | 5.2% (3,056) |
| Massachusetts: | 4.4% (91,120) |
Number of households with income $10k - 20k:| Hadley: | 5.4% (3,194) |
| State: | 5.9% (122,055) |
Number of households with income $20k - 30k:| Hadley: | 5.7% (3,375) |
| State: | 5.1% (105,311) |
Number of households with income $30k - 40k:| Hadley: | 6.0% (3,559) |
| State: | 5.3% (110,239) |
Number of households with income $40k - 50k:| Hadley: | 6.3% (3,724) |
| State: | 5.0% (104,636) |
Number of households with income $50k - 60k:| Hadley: | 6.0% (3,545) |
| State: | 4.8% (99,486) |
Number of households with income $60k - 75k:| Hadley: | 8.6% (5,057) |
| Massachusetts: | 7.5% (155,124) |
Number of households with income $75k - 100k:| Hadley: | 12.6% (7,389) |
| State: | 11.4% (236,252) |
Number of households with income $100k - 125k:| Hadley: | 11.8% (6,922) |
| State: | 9.9% (204,731) |
Number of households with income $125k - 150k:| Hadley: | 11.5% (6,783) |
| State: | 8.5% (175,324) |
Number of households with income $150k - 200k:| Hadley: | 10.6% (6,240) |
| State: | 11.7% (242,980) |
Number of households with income > $200k:| Hadley: | 10.2% (6,021) |
| Massachusetts: | 20.5% (425,966) |
Aggregate household income in Hadley in 2022: $318,924,402
Median family income in Hadley in 2022:| Hadley: | $123,298 |
| State: | $133,153 |
Number of families with income < $10k:| Hadley: | 0.8% (11) |
| State: | 2.0% (25,038) |
Number of families with income $10k - 20k:| Hadley: | 2.3% (31) |
| Massachusetts: | 2.1% (26,403) |
Number of families with income $20k - 30k:| Hadley: | 1.1% (16) |
| State: | 2.6% (32,525) |
Number of families with income $30k - 40k:| Hadley: | 3.7% (51) |
| Massachusetts: | 3.9% (48,079) |
Number of families with income $40k - 50k:| Hadley: | 2.9% (39) |
| State: | 3.8% (46,908) |
Number of families with income $50k - 60k:| Hadley: | 3.6% (49) |
| State: | 3.8% (46,476) |
Number of families with income $60k - 75k:| Hadley: | 4.8% (66) |
| Massachusetts: | 6.4% (79,040) |
Number of families with income $75k - 100k:| Hadley: | 12.0% (164) |
| Massachusetts: | 11.1% (137,395) |
Number of families with income $100k - 125k:| Hadley: | 11.9% (163) |
| State: | 11.1% (136,771) |
Number of families with income $125k - 150k:| Hadley: | 26.1% (358) |
| State: | 10.0% (123,709) |
Number of families with income $150k - 200k:| Hadley: | 19.9% (273) |
| State: | 14.7% (181,602) |
Number of families with income > $200k:| Hadley: | 10.7% (147) |
| Massachusetts: | 28.5% (351,887) |
Median non-family income in Hadley in 2022:| Hadley: | $58,833 |
| State: | $59,323 |
Change in median non-family income between 2000 and 2022:| Hadley, Massachusetts: | +79.8% |
| State: | +94.3% |
Median per capita income in Hadley in 2022:| Hadley: | $50,266 |
| State: | $60,804 |
Change in median per capita income between 2000 and 2022:| Hadley, Massachusetts: | +99.4% |
| Massachusetts: | +118.7% |
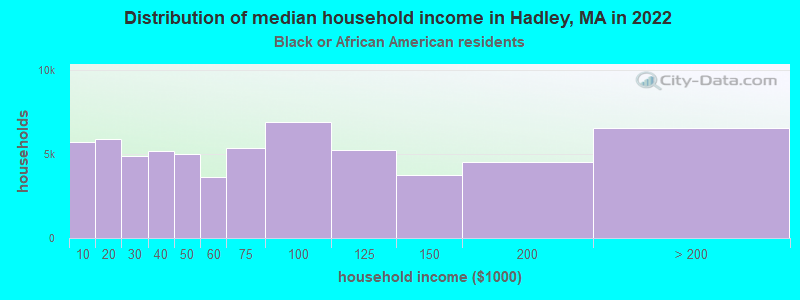
Income statistics for Black or African American residents
Median household income in Hadley, MA in 2022:| Hadley: | $19,708 |
| State: | $63,189 |
Change in median household income between 2000 and 2022:| Hadley, Massachusetts: | +62.3% |
| State: | +87.4% |
Number of households with income < $10k:| Hadley: | 9.1% (5,688) |
| Massachusetts: | 9.1% (15,797) |
Number of households with income $10k - 20k:| Hadley: | 9.4% (5,857) |
| State: | 9.4% (16,267) |
Number of households with income $20k - 30k:| Hadley: | 7.8% (4,868) |
| State: | 7.8% (13,520) |
Number of households with income $30k - 40k:| Hadley: | 8.3% (5,189) |
| State: | 8.3% (14,412) |
Number of households with income $40k - 50k:| Hadley: | 7.9% (4,965) |
| State: | 7.9% (13,790) |
Number of households with income $50k - 60k:| Hadley: | 5.8% (3,615) |
| Massachusetts: | 5.8% (10,041) |
Number of households with income $60k - 75k:| Hadley: | 8.5% (5,336) |
| State: | 8.5% (14,822) |
Number of households with income $75k - 100k:| Hadley: | 11.0% (6,885) |
| Massachusetts: | 11.0% (19,122) |
Number of households with income $100k - 125k:| Hadley: | 8.4% (5,248) |
| State: | 8.4% (14,575) |
Number of households with income $125k - 150k:| Hadley: | 6.0% (3,755) |
| State: | 6.0% (10,429) |
Number of households with income $150k - 200k:| Hadley: | 7.2% (4,515) |
| Massachusetts: | 7.2% (12,539) |
Number of households with income > $200k:| Hadley: | 10.5% (6,547) |
| State: | 10.5% (18,185) |
Aggregate household income in Hadley in 2022: $1,963,082
Median family income in Hadley in 2022:| Hadley: | $325,620 |
| Massachusetts: | $79,815 |
Number of families with income $100k - 125k:| Hadley: | 100.0% (17) |
| State: | 10.4% (11,452) |
Median non-family income in Hadley in 2022:| Hadley: | $19,469 |
| Massachusetts: | $38,934 |
Change in median non-family income between 2000 and 2022:| Hadley, Massachusetts: | +73.1% |
| State: | +69.2% |
Median per capita income in Hadley in 2022:| Hadley: | $51,268 |
| Massachusetts: | $33,524 |
Change in median per capita income between 2000 and 2022:| Hadley, Massachusetts: | +124.2% |
| State: | +109.4% |
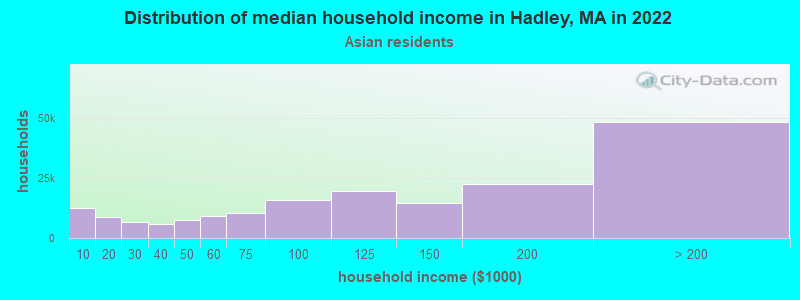
Income statistics for Asian residents
Median household income in Hadley, MA in 2022:| Hadley: | $121,295 |
| State: | $117,855 |
Change in median household income between 2000 and 2022:| Hadley, Massachusetts: | +128.3% |
| State: | +129.9% |
Number of households with income < $10k:| Hadley: | 6.8% (12,415) |
| State: | 6.8% (11,982) |
Number of households with income $10k - 20k:| Hadley: | 4.8% (8,679) |
| Massachusetts: | 4.8% (8,376) |
Number of households with income $20k - 30k:| Hadley: | 3.7% (6,794) |
| State: | 3.7% (6,558) |
Number of households with income $30k - 40k:| Hadley: | 3.3% (5,955) |
| Massachusetts: | 3.3% (5,748) |
Number of households with income $40k - 50k:| Hadley: | 4.1% (7,452) |
| State: | 4.1% (7,192) |
Number of households with income $50k - 60k:| Hadley: | 5.0% (9,049) |
| Massachusetts: | 5.0% (8,734) |
Number of households with income $60k - 75k:| Hadley: | 5.8% (10,572) |
| State: | 5.8% (10,203) |
Number of households with income $75k - 100k:| Hadley: | 8.6% (15,701) |
| State: | 8.6% (15,154) |
Number of households with income $100k - 125k:| Hadley: | 10.8% (19,626) |
| State: | 10.8% (18,942) |
Number of households with income $125k - 150k:| Hadley: | 8.0% (14,544) |
| State: | 8.0% (14,037) |
Number of households with income $150k - 200k:| Hadley: | 12.5% (22,645) |
| State: | 12.5% (21,856) |
Number of households with income > $200k:| Hadley: | 26.6% (48,381) |
| State: | 26.6% (46,694) |
Aggregate household income in Hadley in 2022: $2,733,876
Median family income in Hadley in 2022:| Hadley: | $151,847 |
| State: | $140,113 |
Number of families with income $10k - 20k:| Hadley: | 27.0% (5) |
| Massachusetts: | 3.5% (4,118) |
Number of families with income $50k - 60k:| Hadley: | 73.0% (12) |
| State: | 3.9% (4,606) |
Median per capita income in Hadley in 2022:| Hadley: | $50,709 |
| State: | $58,900 |
Change in median per capita income between 2000 and 2022:| Hadley, Massachusetts: | +69.4% |
| State: | +174.6% |
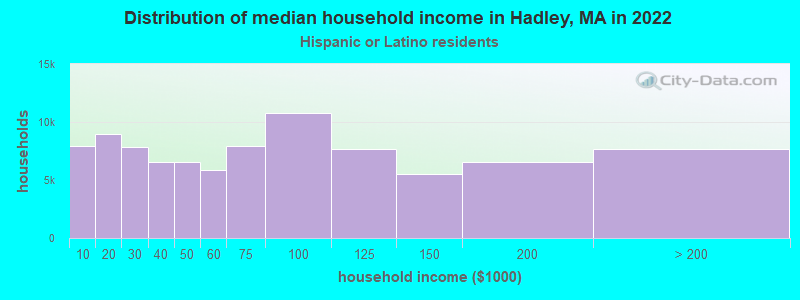
Income statistics for Hispanic or Latino residents
Median household income in Hadley, MA in 2022:| Hadley: | $15,176 |
| State: | $61,523 |
Change in median household income between 2000 and 2022:| Hadley, Massachusetts: | +77.7% |
| State: | +125.4% |
Number of households with income < $10k:| Hadley: | 8.8% (7,918) |
| Massachusetts: | 8.8% (25,307) |
Number of households with income $10k - 20k:| Hadley: | 10.0% (8,966) |
| State: | 10.0% (28,653) |
Number of households with income $20k - 30k:| Hadley: | 8.8% (7,881) |
| State: | 8.8% (25,189) |
Number of households with income $30k - 40k:| Hadley: | 7.2% (6,515) |
| State: | 7.2% (20,822) |
Number of households with income $40k - 50k:| Hadley: | 7.2% (6,513) |
| Massachusetts: | 7.2% (20,817) |
Number of households with income $50k - 60k:| Hadley: | 6.5% (5,866) |
| Massachusetts: | 6.5% (18,748) |
Number of households with income $60k - 75k:| Hadley: | 8.8% (7,944) |
| State: | 8.8% (25,390) |
Number of households with income $75k - 100k:| Hadley: | 12.0% (10,791) |
| State: | 12.0% (34,488) |
Number of households with income $100k - 125k:| Hadley: | 8.6% (7,697) |
| Massachusetts: | 8.6% (24,599) |
Number of households with income $125k - 150k:| Hadley: | 6.2% (5,552) |
| Massachusetts: | 6.2% (17,743) |
Number of households with income $150k - 200k:| Hadley: | 7.3% (6,576) |
| Massachusetts: | 7.3% (21,017) |
Number of households with income > $200k:| Hadley: | 8.6% (7,699) |
| State: | 8.6% (24,606) |
Aggregate household income in Hadley in 2022: $2,809,712
Median family income in Hadley in 2022:| Hadley: | $7,465 |
| Massachusetts: | $66,072 |
Number of families with income < $10k:| Hadley: | 6.5% (11) |
| State: | 6.2% (12,456) |
Number of families with income $10k - 20k:| Hadley: | 7.9% (14) |
| State: | 6.0% (12,071) |
Number of families with income $20k - 30k:| Hadley: | 9.0% (15) |
| State: | 10.1% (20,376) |
Number of families with income $30k - 40k:| Hadley: | 8.5% (14) |
| State: | 8.2% (16,470) |
Number of families with income $40k - 50k:| Hadley: | 6.3% (11) |
| Massachusetts: | 7.4% (14,829) |
Number of families with income $50k - 60k:| Hadley: | 10.0% (17) |
| State: | 7.3% (14,643) |
Number of families with income $60k - 75k:| Hadley: | 11.6% (20) |
| State: | 10.6% (21,252) |
Number of families with income $75k - 100k:| Hadley: | 12.3% (21) |
| Massachusetts: | 12.0% (24,088) |
Number of families with income $100k - 125k:| Hadley: | 7.2% (12) |
| State: | 8.9% (17,954) |
Number of families with income $125k - 150k:| Hadley: | 11.1% (19) |
| Massachusetts: | 6.9% (13,837) |
Number of families with income $150k - 200k:| Hadley: | 6.6% (11) |
| State: | 7.3% (14,683) |
Number of families with income > $200k:| Hadley: | 3.1% (5) |
| Massachusetts: | 9.3% (18,741) |
Median non-family income in Hadley in 2022:| Hadley: | $11,719 |
| Massachusetts: | $37,563 |
Change in median non-family income between 2000 and 2022:| Hadley, Massachusetts: | +33.9% |
| State: | +115.0% |
Median per capita income in Hadley in 2022:| Hadley: | $43,713 |
| Massachusetts: | $28,993 |
Change in median per capita income between 2000 and 2022:| Hadley, Massachusetts: | +129.7% |
| State: | +142.4% |
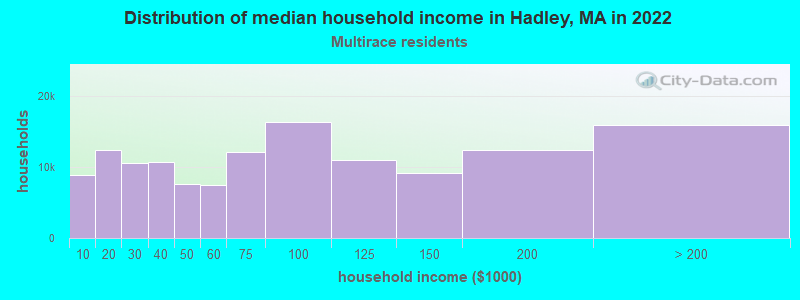
Income statistics for Multirace residents
Median household income in Hadley, MA in 2022:| Hadley: | $56,860 |
| State: | $71,552 |
Change in median household income between 2000 and 2022:| Hadley, Massachusetts: | +43.0% |
| State: | +109.0% |
Number of households with income < $10k:| Hadley: | 6.6% (8,839) |
| Massachusetts: | 6.6% (15,127) |
Number of households with income $10k - 20k:| Hadley: | 9.3% (12,425) |
| State: | 9.2% (21,158) |
Number of households with income $20k - 30k:| Hadley: | 7.8% (10,472) |
| State: | 7.8% (18,016) |
Number of households with income $30k - 40k:| Hadley: | 8.0% (10,683) |
| Massachusetts: | 7.9% (18,260) |
Number of households with income $40k - 50k:| Hadley: | 5.7% (7,581) |
| State: | 5.6% (13,027) |
Number of households with income $50k - 60k:| Hadley: | 5.6% (7,505) |
| Massachusetts: | 5.6% (12,909) |
Number of households with income $60k - 75k:| Hadley: | 9.0% (12,071) |
| State: | 9.0% (20,800) |
Number of households with income $75k - 100k:| Hadley: | 12.1% (16,287) |
| State: | 12.1% (27,875) |
Number of households with income $100k - 125k:| Hadley: | 8.1% (10,882) |
| State: | 8.1% (18,754) |
Number of households with income $125k - 150k:| Hadley: | 6.8% (9,068) |
| State: | 6.8% (15,621) |
Number of households with income $150k - 200k:| Hadley: | 9.2% (12,399) |
| State: | 9.4% (21,618) |
Number of households with income > $200k:| Hadley: | 11.8% (15,879) |
| Massachusetts: | 12.0% (27,592) |
Aggregate household income in Hadley in 2022: $13,335,035
Median family income in Hadley in 2022:| Hadley: | $131,205 |
| Massachusetts: | $78,380 |
Number of families with income < $10k:| Hadley: | 19.1% (19) |
| State: | 4.5% (7,017) |
Number of families with income $10k - 20k:| Hadley: | 6.4% (7) |
| Massachusetts: | 4.9% (7,678) |
Number of families with income $50k - 60k:| Hadley: | 36.3% (37) |
| Massachusetts: | 6.7% (10,445) |
Number of families with income $75k - 100k:| Hadley: | 38.2% (39) |
| State: | 12.1% (18,758) |
Median non-family income in Hadley in 2022:| Hadley: | $110,467 |
| State: | $42,253 |
Median per capita income in Hadley in 2022:| Hadley: | $23,986 |
| State: | $34,029 |
Change in median per capita income between 2000 and 2022:| Hadley, Massachusetts: | +78.7% |
| State: | +132.1% |
Income statistics for other residents
Number of households with income < $10k:| Hadley: | 8.7% (2) |
| Massachusetts: | 8.4% (11,559) |
Number of households with income $10k - 20k:| Hadley: | 8.7% (2) |
| Massachusetts: | 8.4% (11,499) |
Number of households with income $20k - 30k:| Hadley: | 8.7% (2) |
| State: | 9.5% (13,070) |
Number of households with income $30k - 40k:| Hadley: | 8.7% (2) |
| State: | 6.0% (8,291) |
Number of households with income $40k - 50k:| Hadley: | 8.7% (2) |
| Massachusetts: | 9.2% (12,611) |
Number of households with income $50k - 60k:| Hadley: | 8.7% (2) |
| Massachusetts: | 7.9% (10,879) |
Number of households with income $60k - 75k:| Hadley: | 8.7% (2) |
| State: | 7.5% (10,239) |
Number of households with income $75k - 100k:| Hadley: | 13.0% (3) |
| State: | 13.1% (18,032) |
Number of households with income $100k - 125k:| Hadley: | 8.7% (2) |
| State: | 9.6% (13,141) |
Number of households with income $125k - 150k:| Hadley: | 4.3% (1) |
| Massachusetts: | 5.0% (6,808) |
Number of households with income $150k - 200k:| Hadley: | 4.3% (1) |
| State: | 6.4% (8,843) |
Number of households with income > $200k:| Hadley: | 8.7% (2) |
| State: | 9.0% (12,396) |
Aggregate household income in Hadley in 2022: $977,144
Median family income in Hadley in 2022:| Hadley: | $96,296 |
| State: | $66,840 |
Number of families with income $40k - 50k:| Hadley: | 100.0% (16) |
| Massachusetts: | 8.9% (9,052) |
Median per capita income in Hadley in 2022:| Hadley: | $36,527 |
| Massachusetts: | $30,797 |