Iron City, Tennessee (TN) income map, earnings map, and wages data

Data:
The per capita income in 2022 was $14,546, which means a decrease of 18.1% compared to 2000 when it was $17,185.
Whole page based on the data from 2000 / 2022 when the population of Iron City, Tennessee was 368 / 190
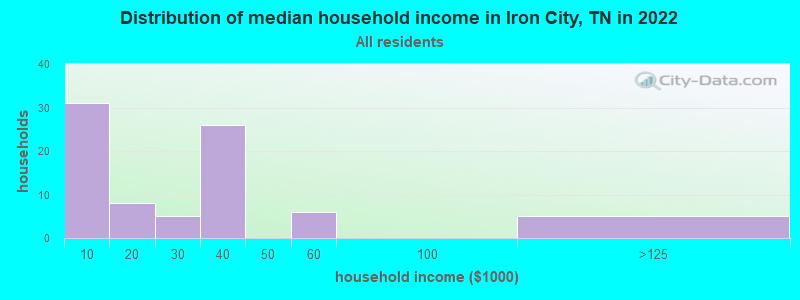
Income statistics for all residents
Number of households with income < $10k:| Iron City: | 38.3% (31) |
| Tennessee: | 5.4% (154,793) |
Number of households with income $10k - 20k:| Iron City: | 9.9% (8) |
| Tennessee: | 8.0% (228,599) |
Number of households with income $20k - 30k:| Iron City: | 6.2% (5) |
| State: | 7.9% (224,908) |
Number of households with income $30k - 40k:| Iron City: | 32.1% (26) |
| State: | 8.6% (244,297) |
Number of households with income $40k - 50k:| Iron City: | 0.0% (0) |
| State: | 8.4% (238,949) |
Number of households with income $50k - 60k:| Iron City: | 7.4% (6) |
| State: | 7.7% (218,438) |
Number of households with income $60k - 75k:| Iron City: | 0.0% (0) |
| State: | 10.3% (294,172) |
Number of households with income $75k - 100k:| Iron City: | 0.0% (0) |
| State: | 13.3% (377,310) |
Number of households with income $100k - 125k:| Iron City: | 6.2% (5) |
| State: | 9.5% (269,124) |
Number of households with income $125k - 150k:| Iron City: | 0.0% (0) |
| Tennessee: | 6.3% (178,328) |
Number of households with income $150k - 200k:| Iron City: | 0.0% (0) |
| State: | 7.2% (204,030) |
Number of households with income > $200k:| Iron City: | 0.0% (0) |
| State: | 7.5% (213,736) |
Aggregate household income in Iron City in 2022: $2,355,508
Median per capita income in Iron City in 2022:| Iron City: | $14,546 |
| State: | $36,704 |
Income statistics for White residents
Median household income in Iron City, TN in 2022:| Iron City: | $36,179 |
| State: | $69,826 |
Change in median household income between 2000 and 2022:| Iron City, Tennessee: | +79.0% |
| State: | +82.9% |
Number of households with income < $10k:| Iron City: | 23.1% (15) |
| State: | 4.6% (100,279) |
Number of households with income $10k - 20k:| Iron City: | 12.3% (8) |
| State: | 7.6% (165,031) |
Number of households with income $20k - 30k:| Iron City: | 7.7% (5) |
| Tennessee: | 7.4% (160,229) |
Number of households with income $30k - 40k:| Iron City: | 40.0% (26) |
| State: | 8.1% (174,784) |
Number of households with income $40k - 50k:| Iron City: | 0.0% (0) |
| State: | 7.8% (169,622) |
Number of households with income $50k - 60k:| Iron City: | 9.2% (6) |
| Tennessee: | 7.6% (165,508) |
Number of households with income $60k - 75k:| Iron City: | 0.0% (0) |
| State: | 10.3% (223,937) |
Number of households with income $75k - 100k:| Iron City: | 0.0% (0) |
| Tennessee: | 13.5% (292,688) |
Number of households with income $100k - 125k:| Iron City: | 7.7% (5) |
| State: | 10.1% (219,251) |
Number of households with income $125k - 150k:| Iron City: | 0.0% (0) |
| Tennessee: | 6.6% (142,574) |
Number of households with income $150k - 200k:| Iron City: | 0.0% (0) |
| State: | 7.7% (166,039) |
Number of households with income > $200k:| Iron City: | 0.0% (0) |
| State: | 8.5% (184,546) |
Aggregate household income in Iron City in 2022: $2,264,484
Median family income in Iron City in 2022:| Iron City: | $37,572 |
| State: | $86,015 |
Number of families with income $10k - 20k:| Iron City: | 12.0% (3) |
| Tennessee: | 3.5% (49,925) |
Number of families with income $30k - 40k:| Iron City: | 39.5% (9) |
| State: | 6.6% (93,498) |
Number of families with income $50k - 60k:| Iron City: | 26.3% (6) |
| State: | 7.2% (101,879) |
Number of families with income $100k - 125k:| Iron City: | 22.3% (5) |
| State: | 12.6% (178,761) |
Median per capita income in Iron City in 2022:| Iron City: | $19,649 |
| Tennessee: | $40,126 |
Change in median per capita income between 2000 and 2022:| Iron City, Tennessee: | +13.7% |
| State: | +92.6% |