The median household income in Kissee Mills, MO in 2022 was $50,487, which was 28.4% less than the median annual income of $64,811 across the entire state of Missouri. Compared to the median income of $30,898 in 2000 this represents an increase of 38.8%. The per capita income in 2022 was $27,854, which means an increase of 38.0% compared to 2000 when it was $17,267.
Whole page based on the data from 2000 / 2022 when the population of Kissee Mills, Missouri was 1,109 / 1,136
Income statistics for all residents
Median household income in Kissee Mills, MO in 2022:
Kissee Mills:
$50,487
Missouri:
$64,811
Change in median household income between 2000 and 2022:
Kissee Mills, Missouri:
+63.4%
State:
+70.9%
Number of households with income < $10k:
Kissee Mills:
0.9% (4)
State:
5.7% (144,208)
Number of households with income $10k - 20k:
Kissee Mills:
4.7% (21)
Missouri:
8.2% (205,541)
Number of households with income $20k - 30k:
Kissee Mills:
10.0% (45)
State:
7.8% (197,162)
Number of households with income $30k - 40k:
Kissee Mills:
16.4% (74)
Missouri:
8.7% (220,088)
Number of households with income $40k - 50k:
Kissee Mills:
13.8% (62)
State:
8.2% (206,651)
Number of households with income $50k - 60k:
Kissee Mills:
11.3% (51)
State:
7.8% (196,521)
Number of households with income $60k - 75k:
Kissee Mills:
7.1% (32)
Missouri:
10.1% (255,043)
Number of households with income $75k - 100k:
Kissee Mills:
5.1% (23)
Missouri:
13.4% (337,210)
Number of households with income $100k - 125k:
Kissee Mills:
8.7% (39)
State:
9.8% (247,187)
Number of households with income $125k - 150k:
Kissee Mills:
2.9% (13)
Missouri:
6.4% (160,260)
Number of households with income $150k - 200k:
Kissee Mills:
19.1% (86)
State:
6.9% (174,947)
Number of households with income > $200k:
Kissee Mills:
0.0% (0)
State:
7.0% (177,014)
Aggregate household income in Kissee Mills in 2022: $32,925,470
Median non-family income in Kissee Mills in 2022:
Kissee Mills:
$31,365
State:
$38,435
Change in median non-family income between 2000 and 2022:
Kissee Mills, Missouri:
+58.4%
Missouri:
+72.4%
Median per capita income in Kissee Mills in 2022:
Kissee Mills:
$27,854
State:
$36,640
Change in median per capita income between 2000 and 2022:
Kissee Mills, Missouri:
+61.3%
State:
+83.8%
Income statistics for White residents
Median household income in Kissee Mills, MO in 2022:
Kissee Mills:
$50,879
State:
$68,771
Change in median household income between 2000 and 2022:
Kissee Mills, Missouri:
+64.2%
Missouri:
+73.5%
Number of households with income < $10k:
Kissee Mills:
0.7% (3)
State:
4.9% (98,067)
Number of households with income $10k - 20k:
Kissee Mills:
2.6% (11)
State:
7.3% (146,436)
Number of households with income $20k - 30k:
Kissee Mills:
10.8% (45)
Missouri:
7.6% (153,201)
Number of households with income $30k - 40k:
Kissee Mills:
16.5% (69)
State:
8.4% (169,042)
Number of households with income $40k - 50k:
Kissee Mills:
14.4% (60)
State:
8.0% (160,724)
Number of households with income $50k - 60k:
Kissee Mills:
12.0% (50)
State:
7.7% (155,924)
Number of households with income $60k - 75k:
Kissee Mills:
5.0% (21)
State:
10.2% (205,080)
Number of households with income $75k - 100k:
Kissee Mills:
5.3% (22)
State:
14.1% (283,507)
Number of households with income $100k - 125k:
Kissee Mills:
9.1% (38)
State:
10.2% (205,898)
Number of households with income $125k - 150k:
Kissee Mills:
3.1% (13)
State:
6.7% (135,287)
Number of households with income $150k - 200k:
Kissee Mills:
20.4% (85)
State:
7.4% (148,450)
Number of households with income > $200k:
Kissee Mills:
0.0% (0)
Missouri:
7.6% (153,213)
Aggregate household income in Kissee Mills in 2022: $31,318,911
Median non-family income in Kissee Mills in 2022:
Kissee Mills:
$31,553
State:
$40,207
Change in median non-family income between 2000 and 2022:
Kissee Mills, Missouri:
+60.3%
State:
+75.5%
Median per capita income in Kissee Mills in 2022:
Kissee Mills:
$28,362
Missouri:
$39,160
Change in median per capita income between 2000 and 2022:
Kissee Mills, Missouri:
+62.2%
State:
+86.9%
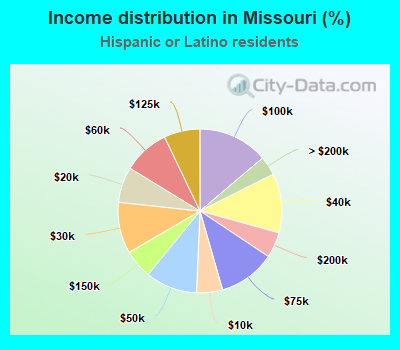
Income statistics for Hispanic or Latino residents
Number of households with income < $10k:
Kissee Mills:
0.0% (0)
State:
5.1% (4,373)
Number of households with income $10k - 20k:
Kissee Mills:
0.0% (0)
State:
7.0% (6,006)
Number of households with income $20k - 30k:
Kissee Mills:
43.8% (7)
State:
10.1% (8,643)
Number of households with income $30k - 40k:
Kissee Mills:
0.0% (0)
State:
11.7% (9,989)
Number of households with income $40k - 50k:
Kissee Mills:
0.0% (0)
State:
10.2% (8,742)
Number of households with income $50k - 60k:
Kissee Mills:
0.0% (0)
Missouri:
9.2% (7,818)
Number of households with income $60k - 75k:
Kissee Mills:
56.2% (9)
Missouri:
11.2% (9,570)
Number of households with income $75k - 100k:
Kissee Mills:
0.0% (0)
State:
13.8% (11,820)
Number of households with income $100k - 125k:
Kissee Mills:
0.0% (0)
State:
7.1% (6,070)
Number of households with income $125k - 150k:
Kissee Mills:
0.0% (0)
Missouri:
5.7% (4,859)
Number of households with income $150k - 200k:
Kissee Mills:
0.0% (0)
Missouri:
5.1% (4,323)
Number of households with income > $200k:
Kissee Mills:
0.0% (0)
State:
3.8% (3,228)
Aggregate household income in Kissee Mills in 2022: $28,006,353
Median per capita income in Kissee Mills in 2022:
Kissee Mills:
$13,996
State:
$23,656
Change in median per capita income between 2000 and 2022:
Kissee Mills, Missouri:
+57.1%
State:
+81.3%
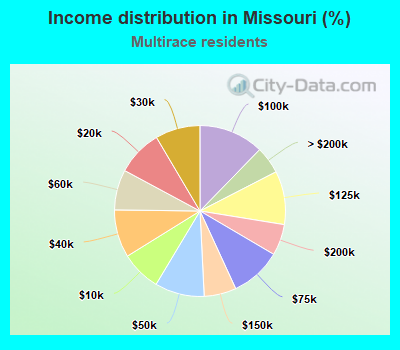
Income statistics for Multirace residents
Number of households with income < $10k:
Kissee Mills:
0.0% (0)
State:
7.6% (10,901)
Number of households with income $10k - 20k:
Kissee Mills:
65.0% (13)
State:
8.7% (12,480)
Number of households with income $20k - 30k:
Kissee Mills:
0.0% (0)
State:
8.5% (12,233)
Number of households with income $30k - 40k:
Kissee Mills:
25.0% (5)
State:
9.1% (13,060)
Number of households with income $40k - 50k:
Kissee Mills:
0.0% (0)
State:
9.4% (13,506)
Number of households with income $50k - 60k:
Kissee Mills:
0.0% (0)
Missouri:
7.6% (11,002)
Number of households with income $60k - 75k:
Kissee Mills:
10.0% (2)
State:
9.7% (13,948)
Number of households with income $75k - 100k:
Kissee Mills:
0.0% (0)
State:
12.3% (17,702)
Number of households with income $100k - 125k:
Kissee Mills:
0.0% (0)
State:
10.1% (14,590)
Number of households with income $125k - 150k:
Kissee Mills:
0.0% (0)
Missouri:
6.1% (8,758)
Number of households with income $150k - 200k:
Kissee Mills:
0.0% (0)
State:
5.9% (8,516)
Number of households with income > $200k:
Kissee Mills:
0.0% (0)
State:
5.2% (7,429)
Aggregate household income in Kissee Mills in 2022: $495,179
Median per capita income in Kissee Mills in 2022:
Kissee Mills:
$20,930
Missouri:
$25,564
Change in median per capita income between 2000 and 2022:
Kissee Mills, Missouri:
+35.5%
Missouri:
+108.9%
Income statistics for other residents
Aggregate household income in Kissee Mills in 2022: $13,746,346
Median per capita income in Kissee Mills in 2022:
Kissee Mills:
$16,753
State:
$24,560
Change in median per capita income between 2000 and 2022:
Kissee Mills, Missouri:
+127.3%
Missouri:
+115.4%
Discuss Kissee Mills, Missouri (MO) on our hugely popular Missouri forum.