Lancaster Mill, South Carolina (SC) income map, earnings map, and wages data
The median household income in Lancaster Mill, SC in 2022 was $38,395, which was 67.0% less than the median annual income of $64,115 across the entire state of South Carolina. Compared to the median income of $19,555 in 2000 this represents an increase of 49.1%. The per capita income in 2022 was $24,402, which means an increase of 55.3% compared to 2000 when it was $10,896.
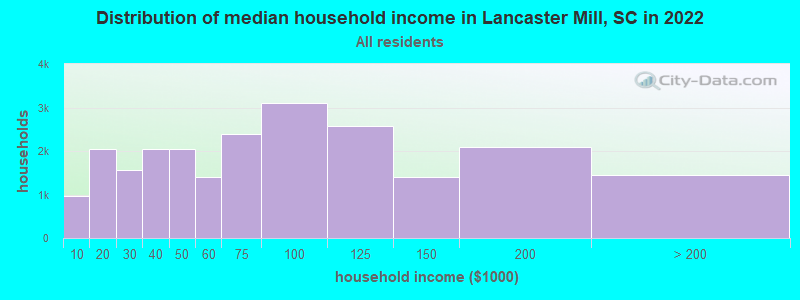
Income statistics for all residents
Median household income in Lancaster Mill, SC in 2022:| Lancaster Mill: | $38,395 |
| State: | $64,115 |
Change in median household income between 2000 and 2022:| Lancaster Mill, South Carolina: | +96.3% |
| South Carolina: | +72.9% |
Number of households with income < $10k:| Lancaster Mill: | 4.2% (977) |
| South Carolina: | 6.1% (130,922) |
Number of households with income $10k - 20k:| Lancaster Mill: | 8.8% (2,038) |
| State: | 7.9% (168,918) |
Number of households with income $20k - 30k:| Lancaster Mill: | 6.8% (1,559) |
| State: | 8.0% (171,564) |
Number of households with income $30k - 40k:| Lancaster Mill: | 8.9% (2,056) |
| State: | 9.2% (195,662) |
Number of households with income $40k - 50k:| Lancaster Mill: | 8.9% (2,054) |
| South Carolina: | 8.2% (176,179) |
Number of households with income $50k - 60k:| Lancaster Mill: | 6.1% (1,412) |
| State: | 7.5% (159,159) |
Number of households with income $60k - 75k:| Lancaster Mill: | 10.3% (2,384) |
| South Carolina: | 9.9% (211,862) |
Number of households with income $75k - 100k:| Lancaster Mill: | 13.4% (3,092) |
| South Carolina: | 13.5% (287,601) |
Number of households with income $100k - 125k:| Lancaster Mill: | 11.1% (2,565) |
| State: | 9.3% (199,068) |
Number of households with income $125k - 150k:| Lancaster Mill: | 6.0% (1,395) |
| State: | 6.2% (133,330) |
Number of households with income $150k - 200k:| Lancaster Mill: | 9.0% (2,081) |
| State: | 6.6% (141,363) |
Number of households with income > $200k:| Lancaster Mill: | 6.3% (1,451) |
| State: | 7.5% (160,452) |
Aggregate household income in Lancaster Mill in 2022: $80,193,447
Median family income in Lancaster Mill in 2022:| Lancaster Mill: | $40,577 |
| South Carolina: | $79,886 |
Median non-family income in Lancaster Mill in 2022:| Lancaster Mill: | $30,197 |
| South Carolina: | $38,426 |
Change in median non-family income between 2000 and 2022:| Lancaster Mill, South Carolina: | +110.4% |
| South Carolina: | +78.7% |
Median per capita income in Lancaster Mill in 2022:| Lancaster Mill: | $24,402 |
| State: | $36,675 |
Change in median per capita income between 2000 and 2022:| Lancaster Mill, South Carolina: | +124.0% |
| State: | +95.1% |
Income statistics for White residents
Median household income in Lancaster Mill, SC in 2022:| Lancaster Mill: | $43,913 |
| State: | $73,516 |
Change in median household income between 2000 and 2022:| Lancaster Mill, South Carolina: | +104.3% |
| State: | +74.8% |
Number of households with income < $10k:| Lancaster Mill: | 4.3% (727) |
| State: | 4.8% (68,379) |
Number of households with income $10k - 20k:| Lancaster Mill: | 4.3% (724) |
| South Carolina: | 5.9% (85,105) |
Number of households with income $20k - 30k:| Lancaster Mill: | 6.1% (1,025) |
| State: | 7.1% (101,178) |
Number of households with income $30k - 40k:| Lancaster Mill: | 8.9% (1,509) |
| South Carolina: | 8.0% (114,877) |
Number of households with income $40k - 50k:| Lancaster Mill: | 9.5% (1,601) |
| South Carolina: | 7.9% (112,749) |
Number of households with income $50k - 60k:| Lancaster Mill: | 6.0% (1,007) |
| South Carolina: | 7.1% (101,835) |
Number of households with income $60k - 75k:| Lancaster Mill: | 9.1% (1,537) |
| South Carolina: | 10.2% (145,879) |
Number of households with income $75k - 100k:| Lancaster Mill: | 17.0% (2,876) |
| State: | 14.0% (200,068) |
Number of households with income $100k - 125k:| Lancaster Mill: | 11.9% (2,008) |
| State: | 10.4% (148,542) |
Number of households with income $125k - 150k:| Lancaster Mill: | 6.5% (1,092) |
| South Carolina: | 7.3% (105,118) |
Number of households with income $150k - 200k:| Lancaster Mill: | 10.6% (1,789) |
| South Carolina: | 8.0% (114,506) |
Number of households with income > $200k:| Lancaster Mill: | 6.1% (1,026) |
| State: | 9.3% (133,550) |
Aggregate household income in Lancaster Mill in 2022: $42,459,790
Median family income in Lancaster Mill in 2022:| Lancaster Mill: | $45,287 |
| State: | $90,709 |
Number of families with income < $10k:| Lancaster Mill: | 13.0% (40) |
| State: | 2.4% (22,376) |
Number of families with income $10k - 20k:| Lancaster Mill: | 12.4% (38) |
| State: | 3.0% (28,325) |
Number of families with income $20k - 30k:| Lancaster Mill: | 8.4% (26) |
| State: | 4.4% (42,131) |
Number of families with income $30k - 40k:| Lancaster Mill: | 20.3% (62) |
| State: | 6.1% (57,510) |
Number of families with income $40k - 50k:| Lancaster Mill: | 4.7% (15) |
| South Carolina: | 7.0% (66,712) |
Number of families with income $50k - 60k:| Lancaster Mill: | 1.5% (5) |
| State: | 6.6% (62,489) |
Number of families with income $60k - 75k:| Lancaster Mill: | 7.0% (21) |
| State: | 10.0% (94,724) |
Number of families with income $100k - 125k:| Lancaster Mill: | 10.3% (31) |
| State: | 12.5% (118,160) |
Number of families with income $150k - 200k:| Lancaster Mill: | 22.4% (69) |
| South Carolina: | 10.6% (100,043) |
Median non-family income in Lancaster Mill in 2022:| Lancaster Mill: | $27,649 |
| State: | $42,596 |
Change in median non-family income between 2000 and 2022:| Lancaster Mill, South Carolina: | +115.8% |
| South Carolina: | +74.9% |
Median per capita income in Lancaster Mill in 2022:| Lancaster Mill: | $26,073 |
| State: | $42,728 |
Change in median per capita income between 2000 and 2022:| Lancaster Mill, South Carolina: | +121.4% |
| South Carolina: | +93.4% |
Income statistics for Black or African American residents
Median household income in Lancaster Mill, SC in 2022:| Lancaster Mill: | $23,592 |
| State: | $44,187 |
Change in median household income between 2000 and 2022:| Lancaster Mill, South Carolina: | +34.2% |
| State: | +76.5% |
Number of households with income < $10k:| Lancaster Mill: | 10.0% (18,367) |
| South Carolina: | 10.0% (52,303) |
Number of households with income $10k - 20k:| Lancaster Mill: | 13.4% (24,556) |
| State: | 13.4% (69,913) |
Number of households with income $20k - 30k:| Lancaster Mill: | 10.4% (19,040) |
| State: | 10.4% (54,216) |
Number of households with income $30k - 40k:| Lancaster Mill: | 12.0% (22,025) |
| South Carolina: | 12.0% (62,722) |
Number of households with income $40k - 50k:| Lancaster Mill: | 9.2% (16,778) |
| State: | 9.2% (47,773) |
Number of households with income $50k - 60k:| Lancaster Mill: | 8.3% (15,128) |
| South Carolina: | 8.3% (43,083) |
Number of households with income $60k - 75k:| Lancaster Mill: | 9.3% (17,080) |
| State: | 9.3% (48,640) |
Number of households with income $75k - 100k:| Lancaster Mill: | 12.2% (22,375) |
| South Carolina: | 12.2% (63,723) |
Number of households with income $100k - 125k:| Lancaster Mill: | 6.4% (11,628) |
| State: | 6.4% (33,117) |
Number of households with income $125k - 150k:| Lancaster Mill: | 3.2% (5,781) |
| State: | 3.2% (16,465) |
Number of households with income $150k - 200k:| Lancaster Mill: | 3.2% (5,854) |
| South Carolina: | 3.2% (16,672) |
Number of households with income > $200k:| Lancaster Mill: | 2.3% (4,288) |
| State: | 2.3% (12,213) |
Aggregate household income in Lancaster Mill in 2022: $24,313,847
Median family income in Lancaster Mill in 2022:| Lancaster Mill: | $28,855 |
| State: | $54,267 |
Number of families with income < $10k:| Lancaster Mill: | 18.3% (38) |
| State: | 7.3% (23,752) |
Number of families with income $10k - 20k:| Lancaster Mill: | 12.8% (26) |
| South Carolina: | 8.5% (27,789) |
Number of families with income $20k - 30k:| Lancaster Mill: | 4.4% (9) |
| South Carolina: | 9.4% (30,766) |
Number of families with income $30k - 40k:| Lancaster Mill: | 19.7% (41) |
| State: | 11.6% (37,651) |
Number of families with income $40k - 50k:| Lancaster Mill: | 8.6% (18) |
| State: | 9.5% (30,858) |
Number of families with income $50k - 60k:| Lancaster Mill: | 3.8% (8) |
| State: | 8.7% (28,419) |
Number of families with income $60k - 75k:| Lancaster Mill: | 2.0% (4) |
| State: | 9.6% (31,402) |
Number of families with income $75k - 100k:| Lancaster Mill: | 14.5% (30) |
| South Carolina: | 15.2% (49,441) |
Number of families with income > $200k:| Lancaster Mill: | 16.0% (33) |
| State: | 3.2% (10,269) |
Median non-family income in Lancaster Mill in 2022:| Lancaster Mill: | $27,863 |
| State: | $28,585 |
Change in median non-family income between 2000 and 2022:| Lancaster Mill, South Carolina: | +85.8% |
| State: | +100.5% |
Median per capita income in Lancaster Mill in 2022:| Lancaster Mill: | $22,687 |
| State: | $24,863 |
Change in median per capita income between 2000 and 2022:| Lancaster Mill, South Carolina: | +125.0% |
| State: | +111.1% |
Income statistics for Hispanic or Latino residents
Number of households with income < $10k:| Lancaster Mill: | 7.1% (172) |
| South Carolina: | 7.1% (7,036) |
Number of households with income $10k - 20k:| Lancaster Mill: | 5.5% (132) |
| State: | 5.4% (5,379) |
Number of households with income $20k - 30k:| Lancaster Mill: | 10.0% (243) |
| State: | 10.0% (9,993) |
Number of households with income $30k - 40k:| Lancaster Mill: | 11.9% (287) |
| South Carolina: | 11.9% (11,872) |
Number of households with income $40k - 50k:| Lancaster Mill: | 8.3% (200) |
| State: | 8.3% (8,239) |
Number of households with income $50k - 60k:| Lancaster Mill: | 8.5% (205) |
| State: | 8.5% (8,475) |
Number of households with income $60k - 75k:| Lancaster Mill: | 9.4% (227) |
| South Carolina: | 9.4% (9,330) |
Number of households with income $75k - 100k:| Lancaster Mill: | 14.6% (354) |
| State: | 14.5% (14,491) |
Number of households with income $100k - 125k:| Lancaster Mill: | 8.0% (194) |
| State: | 8.1% (8,026) |
Number of households with income $125k - 150k:| Lancaster Mill: | 6.3% (153) |
| State: | 6.3% (6,313) |
Number of households with income $150k - 200k:| Lancaster Mill: | 5.0% (120) |
| State: | 5.0% (4,963) |
Number of households with income > $200k:| Lancaster Mill: | 5.5% (134) |
| South Carolina: | 5.6% (5,548) |
Median per capita income in Lancaster Mill in 2022:| Lancaster Mill: | $1,208 |
| State: | $23,692 |
Change in median per capita income between 2000 and 2022:| Lancaster Mill, South Carolina: | +104.0% |
| South Carolina: | +95.1% |
Income statistics for other residents
Number of households with income < $10k:| Lancaster Mill: | 4.7% (126) |
| State: | 4.5% (1,945) |
Number of households with income $10k - 20k:| Lancaster Mill: | 7.0% (185) |
| State: | 6.9% (2,977) |
Number of households with income $20k - 30k:| Lancaster Mill: | 9.4% (250) |
| State: | 9.2% (3,988) |
Number of households with income $30k - 40k:| Lancaster Mill: | 11.7% (311) |
| South Carolina: | 11.8% (5,124) |
Number of households with income $40k - 50k:| Lancaster Mill: | 12.1% (321) |
| State: | 12.3% (5,309) |
Number of households with income $50k - 60k:| Lancaster Mill: | 9.6% (255) |
| State: | 9.7% (4,196) |
Number of households with income $60k - 75k:| Lancaster Mill: | 10.5% (278) |
| South Carolina: | 10.5% (4,549) |
Number of households with income $75k - 100k:| Lancaster Mill: | 13.9% (370) |
| State: | 14.1% (6,099) |
Number of households with income $100k - 125k:| Lancaster Mill: | 6.4% (169) |
| State: | 6.3% (2,747) |
Number of households with income $125k - 150k:| Lancaster Mill: | 7.0% (187) |
| South Carolina: | 7.0% (3,024) |
Number of households with income $150k - 200k:| Lancaster Mill: | 4.6% (121) |
| South Carolina: | 4.6% (1,982) |
Number of households with income > $200k:| Lancaster Mill: | 3.2% (84) |
| State: | 3.2% (1,365) |
Median per capita income in Lancaster Mill in 2022:| Lancaster Mill: | $4,055 |
| State: | $22,305 |