The median household income in Lofall, WA in 2022 was $111,544, which was 18.1% greater than the median annual income of $91,306 across the entire state of Washington. Compared to the median income of $46,840 in 2000 this represents an increase of 58.0%. The per capita income in 2022 was $57,937, which means an increase of 61.5% compared to 2000 when it was $22,317.
Whole page based on the data from 2000 / 2022 when the population of Lofall, Washington was 2,289 / 2,055
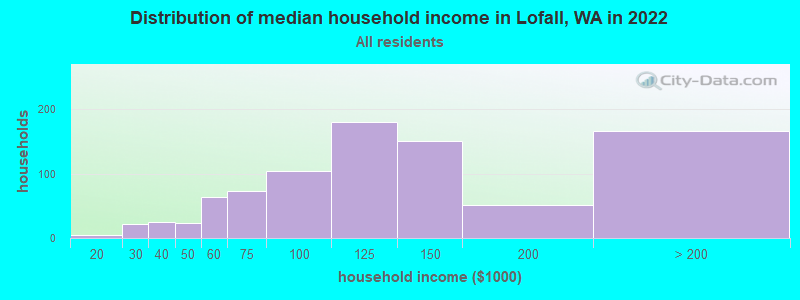
Income statistics for all residents
Median household income in Lofall, WA in 2022:
Lofall:
$111,545
State:
$91,306
Change in median household income between 2000 and 2022:
Lofall, Washington:
+138.1%
State:
+99.5%
Number of households with income < $10k:
Lofall:
0.0% (0)
State:
4.5% (139,331)
Number of households with income $10k - 20k:
Lofall:
0.6% (5)
State:
5.0% (154,508)
Number of households with income $20k - 30k:
Lofall:
2.5% (22)
State:
5.4% (166,555)
Number of households with income $30k - 40k:
Lofall:
2.9% (25)
Washington:
5.5% (170,324)
Number of households with income $40k - 50k:
Lofall:
2.7% (23)
State:
6.0% (183,941)
Number of households with income $50k - 60k:
Lofall:
7.4% (64)
Washington:
6.1% (187,395)
Number of households with income $60k - 75k:
Lofall:
8.4% (73)
State:
8.7% (266,771)
Number of households with income $75k - 100k:
Lofall:
12.0% (104)
State:
13.1% (404,672)
Number of households with income $100k - 125k:
Lofall:
20.8% (180)
State:
11.0% (337,911)
Number of households with income $125k - 150k:
Lofall:
17.5% (151)
Washington:
8.0% (244,934)
Number of households with income $150k - 200k:
Lofall:
5.9% (51)
Washington:
10.5% (323,812)
Number of households with income > $200k:
Lofall:
19.2% (166)
State:
16.2% (499,799)
Aggregate household income in Lofall in 2022: $119,789,934
Median family income in Lofall in 2022:
Lofall:
$121,526
State:
$109,192
Number of families with income $20k - 30k:
Lofall:
2.1% (13)
Washington:
3.2% (61,974)
Number of families with income $30k - 40k:
Lofall:
2.5% (16)
State:
4.1% (80,240)
Number of families with income $40k - 50k:
Lofall:
2.9% (18)
State:
4.9% (94,310)
Number of families with income $50k - 60k:
Lofall:
3.4% (22)
State:
5.3% (101,674)
Number of families with income $60k - 75k:
Lofall:
6.0% (37)
Washington:
8.2% (158,348)
Number of families with income $75k - 100k:
Lofall:
13.5% (84)
Washington:
13.8% (267,812)
Number of families with income $100k - 125k:
Lofall:
23.6% (148)
State:
12.4% (240,213)
Number of families with income $125k - 150k:
Lofall:
15.6% (97)
State:
9.3% (180,011)
Number of families with income $150k - 200k:
Lofall:
8.2% (51)
State:
13.0% (250,874)
Number of families with income > $200k:
Lofall:
22.2% (139)
State:
20.4% (393,898)
Median non-family income in Lofall in 2022:
Lofall:
$77,008
State:
$57,299
Median per capita income in Lofall in 2022:
Lofall:
$57,937
Washington:
$50,764
Income statistics for White residents
Median household income in Lofall, WA in 2022:
Lofall:
$111,511
Washington:
$91,916
Change in median household income between 2000 and 2022:
Lofall, Washington:
+131.9%
Washington:
+95.4%
Number of households with income < $10k:
Lofall:
0.0% (0)
State:
4.3% (95,850)
Number of households with income $10k - 20k:
Lofall:
0.7% (5)
Washington:
4.8% (106,421)
Number of households with income $20k - 30k:
Lofall:
2.9% (21)
Washington:
5.5% (122,860)
Number of households with income $30k - 40k:
Lofall:
2.1% (15)
State:
5.4% (119,627)
Number of households with income $40k - 50k:
Lofall:
1.4% (10)
State:
5.9% (132,276)
Number of households with income $50k - 60k:
Lofall:
8.6% (62)
State:
6.1% (136,212)
Number of households with income $60k - 75k:
Lofall:
10.4% (75)
State:
8.8% (196,086)
Number of households with income $75k - 100k:
Lofall:
12.2% (88)
Washington:
13.4% (299,192)
Number of households with income $100k - 125k:
Lofall:
19.5% (140)
State:
11.3% (252,209)
Number of households with income $125k - 150k:
Lofall:
17.1% (123)
Washington:
7.9% (175,962)
Number of households with income $150k - 200k:
Lofall:
6.8% (49)
State:
10.7% (239,156)
Number of households with income > $200k:
Lofall:
18.2% (131)
Washington:
16.1% (359,917)
Aggregate household income in Lofall in 2022: $99,507,083
Median family income in Lofall in 2022:
Lofall:
$119,877
Washington:
$112,511
Number of families with income $20k - 30k:
Lofall:
2.6% (14)
Washington:
2.9% (39,288)
Number of families with income $30k - 40k:
Lofall:
1.9% (10)
State:
3.6% (50,190)
Number of families with income $40k - 50k:
Lofall:
0.4% (2)
State:
4.6% (63,009)
Number of families with income $50k - 60k:
Lofall:
3.9% (20)
State:
5.0% (69,270)
Number of families with income $60k - 75k:
Lofall:
6.8% (35)
State:
8.2% (112,369)
Number of families with income $75k - 100k:
Lofall:
11.8% (62)
State:
14.1% (194,214)
Number of families with income $100k - 125k:
Lofall:
27.8% (145)
State:
13.2% (182,184)
Number of families with income $125k - 150k:
Lofall:
15.3% (80)
State:
9.5% (130,928)
Number of families with income $150k - 200k:
Lofall:
9.4% (49)
State:
13.7% (188,621)
Number of families with income > $200k:
Lofall:
20.0% (105)
State:
20.8% (285,982)
Median non-family income in Lofall in 2022:
Lofall:
$65,540
Washington:
$56,103
Change in median non-family income between 2000 and 2022:
Lofall, Washington:
+125.2%
Washington:
+87.7%
Median per capita income in Lofall in 2022:
Lofall:
$59,675
State:
$55,212
Income statistics for Black or African American residents
Aggregate household income in Lofall in 2022: $275,216,400
Median per capita income in Lofall in 2022:
Lofall:
$16,225
Washington:
$38,209
Change in median per capita income between 2000 and 2022:: -1.6%
Lofall, Washington:
-1.6%
State:
+115.3%
Income statistics for Asian residents
Median per capita income in Lofall in 2022:
Lofall:
$74,470
Washington:
$67,666
Income statistics for Hispanic or Latino residents
Median household income in Lofall, WA in 2022:
Lofall:
$101,618
Washington:
$74,770
Change in median household income between 2000 and 2022:
Lofall, Washington:
+149.4%
State:
+128.3%
Number of households with income < $10k:
Lofall:
0.0% (0)
State:
4.9% (14,456)
Number of households with income $10k - 20k:
Lofall:
0.0% (0)
State:
5.3% (15,449)
Number of households with income $20k - 30k:
Lofall:
0.0% (0)
Washington:
6.8% (20,016)
Number of households with income $30k - 40k:
Lofall:
0.0% (0)
Washington:
7.7% (22,548)
Number of households with income $40k - 50k:
Lofall:
33.3% (18)
State:
7.3% (21,450)
Number of households with income $50k - 60k:
Lofall:
0.0% (0)
State:
7.7% (22,744)
Number of households with income $60k - 75k:
Lofall:
0.0% (0)
Washington:
10.5% (30,737)
Number of households with income $75k - 100k:
Lofall:
0.0% (0)
State:
14.9% (43,843)
Number of households with income $100k - 125k:
Lofall:
27.8% (15)
Washington:
11.1% (32,554)
Number of households with income $125k - 150k:
Lofall:
38.9% (21)
Washington:
7.4% (21,624)
Number of households with income $150k - 200k:
Lofall:
0.0% (0)
State:
7.3% (21,360)
Number of households with income > $200k:
Lofall:
0.0% (0)
State:
9.2% (27,055)
Aggregate household income in Lofall in 2022: $5,426,915
Median per capita income in Lofall in 2022:
Lofall:
$38,748
State:
$28,252
Income statistics for Multirace residents
Number of households with income < $10k:
Lofall:
0.0% (0)
State:
4.3% (12,040)
Number of households with income $10k - 20k:
Lofall:
0.0% (0)
State:
6.6% (18,437)
Number of households with income $20k - 30k:
Lofall:
0.0% (0)
State:
5.2% (14,559)
Number of households with income $30k - 40k:
Lofall:
0.0% (0)
State:
6.7% (18,491)
Number of households with income $40k - 50k:
Lofall:
0.0% (0)
State:
6.3% (17,459)
Number of households with income $50k - 60k:
Lofall:
0.0% (0)
State:
6.9% (19,086)
Number of households with income $60k - 75k:
Lofall:
0.0% (0)
Washington:
9.1% (25,310)
Number of households with income $75k - 100k:
Lofall:
29.0% (20)
Washington:
13.5% (37,493)
Number of households with income $100k - 125k:
Lofall:
11.6% (8)
State:
10.7% (29,626)
Number of households with income $125k - 150k:
Lofall:
26.1% (18)
State:
8.6% (23,899)
Number of households with income $150k - 200k:
Lofall:
0.0% (0)
State:
10.2% (28,214)
Number of households with income > $200k:
Lofall:
33.3% (23)
Washington:
11.9% (32,947)
Aggregate household income in Lofall in 2022: $12,101,061
Median per capita income in Lofall in 2022:
Lofall:
$44,801
State:
$32,496
Income statistics for other residents
Median household income in Lofall, WA in 2022:
Lofall:
$90,273
State:
$69,545
Number of households with income < $10k:
Lofall:
0.0% (0)
State:
5.3% (6,540)
Number of households with income $10k - 20k:
Lofall:
0.0% (0)
State:
6.0% (7,385)
Number of households with income $20k - 30k:
Lofall:
0.0% (0)
State:
7.5% (9,289)
Number of households with income $30k - 40k:
Lofall:
0.0% (0)
State:
8.9% (11,015)
Number of households with income $40k - 50k:
Lofall:
24.0% (12)
State:
7.6% (9,399)
Number of households with income $50k - 60k:
Lofall:
0.0% (0)
State:
7.2% (8,867)
Number of households with income $60k - 75k:
Lofall:
0.0% (0)
State:
10.5% (13,032)
Number of households with income $75k - 100k:
Lofall:
0.0% (0)
State:
14.6% (18,007)
Number of households with income $100k - 125k:
Lofall:
60.0% (30)
State:
12.2% (15,128)
Number of households with income $125k - 150k:
Lofall:
16.0% (8)
Washington:
5.6% (6,950)
Number of households with income $150k - 200k:
Lofall:
0.0% (0)
State:
7.1% (8,749)
Number of households with income > $200k:
Lofall:
0.0% (0)
State:
7.5% (9,208)
Aggregate household income in Lofall in 2022: $5,213,049
Median non-family income in Lofall in 2022:
Lofall:
$98,799
State:
$44,777
Median per capita income in Lofall in 2022:
Lofall:
$48,083
State:
$27,542
Discuss Lofall, Washington (WA) on our hugely popular Washington forum.