Lunenburg, Vermont (VT) income map, earnings map, and wages data
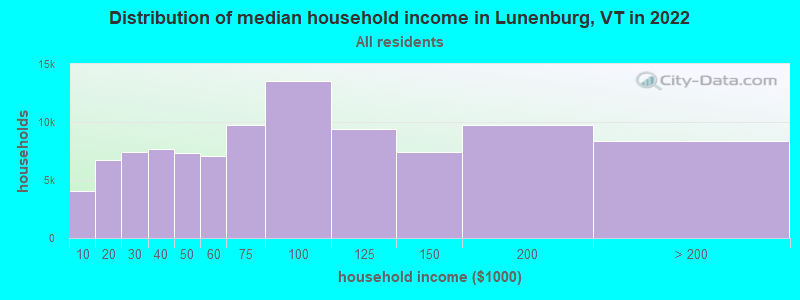
The median household income in Lunenburg, VT in 2022 was $52,516, which was 40.9% less than the median annual income of $73,991 across the entire state of Vermont. Compared to the median income of $28,802 in 2000 this represents an increase of 45.2%. The per capita income in 2022 was $26,223, which means an increase of 51.2% compared to 2000 when it was $12,804.
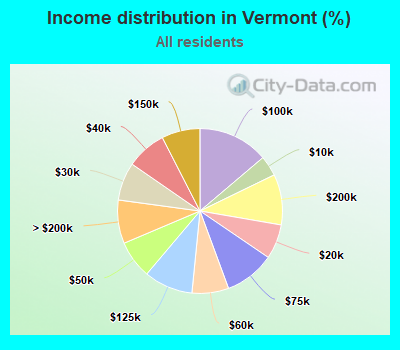
Income statistics for all residents
Median household income in Lunenburg, VT in 2022:| Lunenburg: | $52,516 |
| State: | $73,991 |
Change in median household income between 2000 and 2022:| Lunenburg, Vermont: | +82.3% |
| State: | +81.1% |
Number of households with income < $10k:| Lunenburg: | 4.1% (4,011) |
| State: | 4.0% (11,050) |
Number of households with income $10k - 20k:| Lunenburg: | 6.9% (6,754) |
| State: | 6.8% (18,853) |
Number of households with income $20k - 30k:| Lunenburg: | 7.5% (7,378) |
| Vermont: | 7.5% (20,673) |
Number of households with income $30k - 40k:| Lunenburg: | 7.8% (7,693) |
| State: | 7.8% (21,750) |
Number of households with income $40k - 50k:| Lunenburg: | 7.4% (7,317) |
| Vermont: | 7.4% (20,642) |
Number of households with income $50k - 60k:| Lunenburg: | 7.2% (7,047) |
| State: | 7.2% (19,901) |
Number of households with income $60k - 75k:| Lunenburg: | 9.9% (9,713) |
| Vermont: | 9.9% (27,351) |
Number of households with income $75k - 100k:| Lunenburg: | 13.7% (13,493) |
| State: | 13.8% (38,275) |
Number of households with income $100k - 125k:| Lunenburg: | 9.6% (9,433) |
| State: | 9.6% (26,632) |
Number of households with income $125k - 150k:| Lunenburg: | 7.5% (7,374) |
| State: | 7.5% (20,857) |
Number of households with income $150k - 200k:| Lunenburg: | 9.9% (9,745) |
| State: | 9.9% (27,469) |
Number of households with income > $200k:| Lunenburg: | 8.5% (8,348) |
| State: | 8.5% (23,637) |
Aggregate household income in Lunenburg in 2022: $106,209,956
Median family income in Lunenburg in 2022:| Lunenburg: | $66,888 |
| State: | $96,345 |
Median non-family income in Lunenburg in 2022:| Lunenburg: | $32,008 |
| Vermont: | $46,022 |
Change in median non-family income between 2000 and 2022:| Lunenburg, Vermont: | +87.9% |
| State: | +87.4% |
Median per capita income in Lunenburg in 2022:| Lunenburg: | $26,224 |
| State: | $42,251 |
Change in median per capita income between 2000 and 2022:| Lunenburg, Vermont: | +104.8% |
| State: | +104.9% |
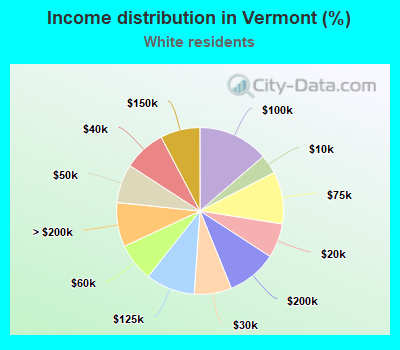
Income statistics for White residents
Median household income in Lunenburg, VT in 2022:| Lunenburg: | $51,139 |
| Vermont: | $73,591 |
Change in median household income between 2000 and 2022:| Lunenburg, Vermont: | +80.8% |
| State: | +79.2% |
Number of households with income < $10k:| Lunenburg: | 3.8% (3,353) |
| State: | 3.7% (9,508) |
Number of households with income $10k - 20k:| Lunenburg: | 6.7% (5,962) |
| State: | 6.7% (17,064) |
Number of households with income $20k - 30k:| Lunenburg: | 7.3% (6,457) |
| State: | 7.2% (18,552) |
Number of households with income $30k - 40k:| Lunenburg: | 8.1% (7,213) |
| State: | 8.2% (20,886) |
Number of households with income $40k - 50k:| Lunenburg: | 7.5% (6,639) |
| State: | 7.5% (19,216) |
Number of households with income $50k - 60k:| Lunenburg: | 7.4% (6,530) |
| Vermont: | 7.4% (18,898) |
Number of households with income $60k - 75k:| Lunenburg: | 10.2% (9,002) |
| Vermont: | 10.1% (25,944) |
Number of households with income $75k - 100k:| Lunenburg: | 13.6% (12,030) |
| State: | 13.7% (34,991) |
Number of households with income $100k - 125k:| Lunenburg: | 9.5% (8,424) |
| State: | 9.5% (24,409) |
Number of households with income $125k - 150k:| Lunenburg: | 7.7% (6,807) |
| State: | 7.7% (19,710) |
Number of households with income $150k - 200k:| Lunenburg: | 9.7% (8,562) |
| State: | 9.7% (24,802) |
Number of households with income > $200k:| Lunenburg: | 8.5% (7,566) |
| State: | 8.6% (21,983) |
Aggregate household income in Lunenburg in 2022: $93,586,504
Median family income in Lunenburg in 2022:| Lunenburg: | $65,823 |
| State: | $96,147 |
Number of families with income < $10k:| Lunenburg: | 4.9% (8) |
| State: | 1.8% (2,669) |
Number of families with income $10k - 20k:| Lunenburg: | 16.0% (26) |
| Vermont: | 3.1% (4,686) |
Number of families with income $20k - 30k:| Lunenburg: | 13.9% (22) |
| State: | 4.1% (6,266) |
Number of families with income $30k - 40k:| Lunenburg: | 12.1% (19) |
| Vermont: | 6.1% (9,273) |
Number of families with income $40k - 50k:| Lunenburg: | 15.4% (25) |
| State: | 6.4% (9,714) |
Number of families with income $50k - 60k:| Lunenburg: | 9.8% (16) |
| State: | 6.1% (9,310) |
Number of families with income $60k - 75k:| Lunenburg: | 17.1% (28) |
| State: | 9.3% (14,175) |
Number of families with income $75k - 100k:| Lunenburg: | 5.1% (8) |
| State: | 15.5% (23,673) |
Number of families with income $100k - 125k:| Lunenburg: | 5.8% (9) |
| Vermont: | 12.7% (19,323) |
Median non-family income in Lunenburg in 2022:| Lunenburg: | $30,932 |
| State: | $45,952 |
Change in median non-family income between 2000 and 2022:| Lunenburg, Vermont: | +86.8% |
| State: | +86.1% |
Median per capita income in Lunenburg in 2022:| Lunenburg: | $26,295 |
| Vermont: | $43,031 |
Change in median per capita income between 2000 and 2022:| Lunenburg, Vermont: | +106.2% |
| State: | +106.0% |
Income statistics for Asian residents
Number of households with income < $10k:| Lunenburg: | 5.3% (239,034) |
| State: | 8.9% (278) |
Number of households with income $10k - 20k:| Lunenburg: | 4.8% (215,784) |
| State: | 5.9% (184) |
Number of households with income $20k - 30k:| Lunenburg: | 4.7% (211,197) |
| Vermont: | 8.3% (258) |
Number of households with income $30k - 40k:| Lunenburg: | 4.7% (209,641) |
| State: | 8.8% (273) |
Number of households with income $40k - 50k:| Lunenburg: | 4.6% (206,436) |
| State: | 9.7% (302) |
Number of households with income $50k - 60k:| Lunenburg: | 4.8% (214,263) |
| State: | 3.4% (106) |
Number of households with income $60k - 75k:| Lunenburg: | 6.9% (307,279) |
| Vermont: | 6.5% (202) |
Number of households with income $75k - 100k:| Lunenburg: | 10.9% (486,779) |
| State: | 14.6% (455) |
Number of households with income $100k - 125k:| Lunenburg: | 10.0% (446,255) |
| State: | 9.8% (305) |
Number of households with income $125k - 150k:| Lunenburg: | 7.8% (351,153) |
| State: | 2.7% (85) |
Number of households with income $150k - 200k:| Lunenburg: | 11.8% (529,977) |
| State: | 11.8% (369) |
Number of households with income > $200k:| Lunenburg: | 23.7% (1,063,968) |
| State: | 9.6% (299) |
Median per capita income in Lunenburg in 2022:| Lunenburg: | $40,693 |
| Vermont: | $32,037 |
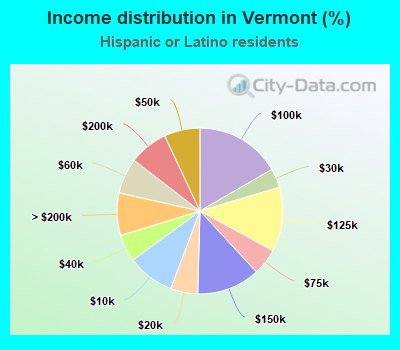
Income statistics for Hispanic or Latino residents
Median household income in Lunenburg, VT in 2022:| Lunenburg: | $114,333 |
| Vermont: | $90,490 |
Change in median household income between 2000 and 2022:| Lunenburg, Vermont: | +134.5% |
| Vermont: | +133.7% |
Number of households with income < $10k:| Lunenburg: | 9.2% (629) |
| State: | 9.2% (500) |
Number of households with income $10k - 20k:| Lunenburg: | 5.3% (363) |
| Vermont: | 5.3% (288) |
Number of households with income $20k - 30k:| Lunenburg: | 3.7% (256) |
| State: | 3.7% (203) |
Number of households with income $30k - 40k:| Lunenburg: | 5.3% (362) |
| State: | 5.3% (288) |
Number of households with income $40k - 50k:| Lunenburg: | 7.0% (477) |
| Vermont: | 7.0% (379) |
Number of households with income $50k - 60k:| Lunenburg: | 6.9% (473) |
| State: | 6.9% (376) |
Number of households with income $60k - 75k:| Lunenburg: | 5.2% (355) |
| Vermont: | 5.2% (282) |
Number of households with income $75k - 100k:| Lunenburg: | 16.7% (1,139) |
| State: | 16.7% (905) |
Number of households with income $100k - 125k:| Lunenburg: | 12.5% (858) |
| State: | 12.6% (682) |
Number of households with income $125k - 150k:| Lunenburg: | 12.3% (842) |
| State: | 12.3% (669) |
Number of households with income $150k - 200k:| Lunenburg: | 7.6% (519) |
| State: | 7.6% (412) |
Number of households with income > $200k:| Lunenburg: | 8.3% (566) |
| State: | 8.3% (450) |
Aggregate household income in Lunenburg in 2022: $341,705
Median family income in Lunenburg in 2022:| Lunenburg: | $121,043 |
| State: | $116,955 |
Median per capita income in Lunenburg in 2022:| Lunenburg: | $27,143 |
| Vermont: | $36,311 |
Change in median per capita income between 2000 and 2022:| Lunenburg, Vermont: | +132.4% |
| State: | +131.1% |
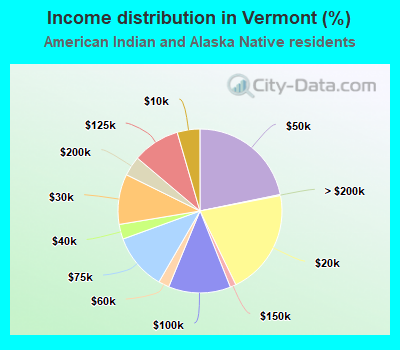
Income statistics for American Indian and Alaska Native residents
Number of households with income < $10k:| Lunenburg: | 7.8% (5) |
| State: | 4.5% (23) |
Number of households with income $10k - 20k:| Lunenburg: | 9.4% (6) |
| State: | 20.8% (107) |
Number of households with income $20k - 30k:| Lunenburg: | 9.4% (6) |
| State: | 9.9% (51) |
Number of households with income $30k - 40k:| Lunenburg: | 9.4% (6) |
| State: | 2.9% (15) |
Number of households with income $40k - 50k:| Lunenburg: | 7.8% (5) |
| State: | 21.8% (112) |
Number of households with income $50k - 60k:| Lunenburg: | 7.8% (5) |
| Vermont: | 2.1% (11) |
Number of households with income $60k - 75k:| Lunenburg: | 9.4% (6) |
| Vermont: | 11.1% (57) |
Number of households with income $75k - 100k:| Lunenburg: | 12.5% (8) |
| State: | 12.3% (63) |
Number of households with income $100k - 125k:| Lunenburg: | 9.4% (6) |
| Vermont: | 9.3% (48) |
Number of households with income $125k - 150k:| Lunenburg: | 6.2% (4) |
| State: | 1.2% (6) |
Number of households with income $150k - 200k:| Lunenburg: | 6.2% (4) |
| State: | 3.9% (20) |
Number of households with income > $200k:| Lunenburg: | 4.7% (3) |
| State: | 0.2% (1) |
Aggregate household income in Lunenburg in 2022: $81,316
Median per capita income in Lunenburg in 2022:| Lunenburg: | $9,670 |
| State: | $19,747 |
Change in median per capita income between 2000 and 2022:| Lunenburg, Vermont: | +37.8% |
| State: | +41.4% |
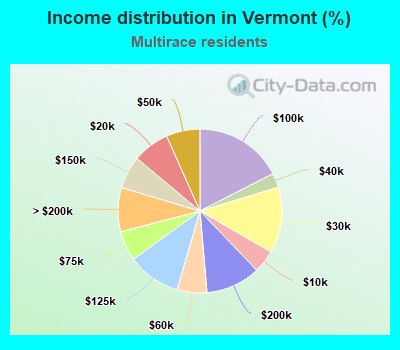
Income statistics for Multirace residents
Median household income in Lunenburg, VT in 2022:| Lunenburg: | $98,002 |
| Vermont: | $81,819 |
Number of households with income < $10k:| Lunenburg: | 4.5% (717) |
| State: | 4.5% (613) |
Number of households with income $10k - 20k:| Lunenburg: | 7.3% (1,156) |
| State: | 7.3% (988) |
Number of households with income $20k - 30k:| Lunenburg: | 13.0% (2,071) |
| State: | 13.0% (1,770) |
Number of households with income $30k - 40k:| Lunenburg: | 2.8% (451) |
| State: | 2.8% (386) |
Number of households with income $40k - 50k:| Lunenburg: | 6.7% (1,058) |
| State: | 6.7% (904) |
Number of households with income $50k - 60k:| Lunenburg: | 5.9% (932) |
| State: | 5.9% (797) |
Number of households with income $60k - 75k:| Lunenburg: | 5.9% (941) |
| State: | 5.9% (804) |
Number of households with income $75k - 100k:| Lunenburg: | 17.5% (2,780) |
| Vermont: | 17.5% (2,376) |
Number of households with income $100k - 125k:| Lunenburg: | 10.5% (1,669) |
| State: | 10.5% (1,427) |
Number of households with income $125k - 150k:| Lunenburg: | 6.5% (1,026) |
| State: | 6.5% (877) |
Number of households with income $150k - 200k:| Lunenburg: | 10.8% (1,716) |
| State: | 10.8% (1,467) |
Number of households with income > $200k:| Lunenburg: | 8.7% (1,381) |
| State: | 8.7% (1,180) |
Aggregate household income in Lunenburg in 2022: $8,546,201
Median family income in Lunenburg in 2022:| Lunenburg: | $130,684 |
| State: | $98,198 |
Number of families with income $10k - 20k:| Lunenburg: | 10.4% (8) |
| State: | 7.0% (571) |
Number of families with income $30k - 40k:| Lunenburg: | 4.4% (3) |
| Vermont: | 2.1% (173) |
Number of families with income $50k - 60k:| Lunenburg: | 7.6% (6) |
| State: | 4.2% (343) |
Number of families with income $100k - 125k:| Lunenburg: | 77.6% (58) |
| State: | 11.7% (952) |
Median non-family income in Lunenburg in 2022:| Lunenburg: | $84,118 |
| State: | $44,940 |
Change in median non-family income between 2000 and 2022:| Lunenburg, Vermont: | +132.0% |
| State: | +160.3% |
Median per capita income in Lunenburg in 2022:| Lunenburg: | $45,240 |
| State: | $34,567 |
Income statistics for other residents
Number of households with income < $10k:| Lunenburg: | 6.2% (10) |
| Vermont: | 4.4% (48) |
Number of households with income $10k - 20k:| Lunenburg: | 6.8% (11) |
| State: | 6.4% (69) |
Number of households with income $20k - 30k:| Lunenburg: | 8.0% (13) |
| Vermont: | 2.7% (29) |
Number of households with income $30k - 40k:| Lunenburg: | 8.6% (14) |
| Vermont: | 13.6% (147) |
Number of households with income $40k - 50k:| Lunenburg: | 9.3% (15) |
| State: | 13.4% (145) |
Number of households with income $50k - 60k:| Lunenburg: | 8.0% (13) |
| Vermont: | 7.8% (84) |
Number of households with income $60k - 75k:| Lunenburg: | 11.1% (18) |
| State: | 13.7% (148) |
Number of households with income $75k - 100k:| Lunenburg: | 14.2% (23) |
| State: | 8.1% (87) |
Number of households with income $100k - 125k:| Lunenburg: | 9.3% (15) |
| State: | 8.4% (91) |
Number of households with income $125k - 150k:| Lunenburg: | 6.2% (10) |
| State: | 6.1% (66) |
Number of households with income $150k - 200k:| Lunenburg: | 6.8% (11) |
| State: | 10.7% (116) |
Number of households with income > $200k:| Lunenburg: | 5.6% (9) |
| State: | 4.6% (50) |
Aggregate household income in Lunenburg in 2022: $677,909
Median family income in Lunenburg in 2022:| Lunenburg: | $106,925 |
| State: | $105,231 |
Median per capita income in Lunenburg in 2022:| Lunenburg: | $51,438 |
| State: | $36,770 |