The median household income in Maple Falls, WA in 2022 was $32,906, which was 177.5% less than the median annual income of $91,306 across the entire state of Washington. Compared to the median income of $41,250 in 2000 this represents a decrease of 25.4%. The per capita income in 2022 was $33,458, which means an increase of 27.6% compared to 2000 when it was $24,216.
Whole page based on the data from 2000 / 2022 when the population of Maple Falls, Washington was 277 / 235
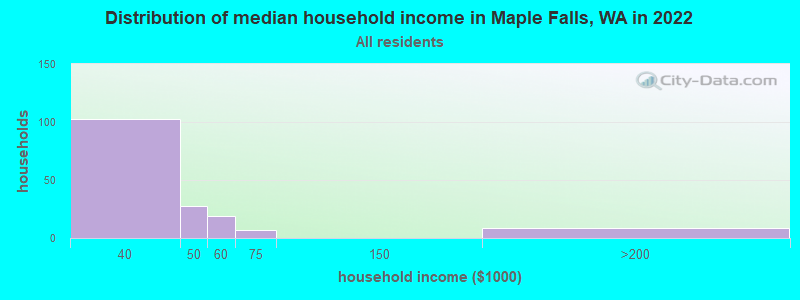
Income statistics for all residents
Median household income in Maple Falls, WA in 2022:
Maple Falls:
$32,907
State:
$91,306
Change in median household income between 2000 and 2022:: -20.2%
Maple Falls, Washington:
-20.2%
State:
+99.5%
Number of households with income < $10k:
Maple Falls:
0.0% (0)
State:
4.5% (139,331)
Number of households with income $10k - 20k:
Maple Falls:
0.0% (0)
State:
5.0% (154,508)
Number of households with income $20k - 30k:
Maple Falls:
0.0% (0)
State:
5.4% (166,555)
Number of households with income $30k - 40k:
Maple Falls:
62.0% (103)
State:
5.5% (170,324)
Number of households with income $40k - 50k:
Maple Falls:
16.9% (28)
State:
6.0% (183,941)
Number of households with income $50k - 60k:
Maple Falls:
11.4% (19)
Washington:
6.1% (187,395)
Number of households with income $60k - 75k:
Maple Falls:
4.2% (7)
Washington:
8.7% (266,771)
Number of households with income $75k - 100k:
Maple Falls:
0.0% (0)
State:
13.1% (404,672)
Number of households with income $100k - 125k:
Maple Falls:
0.0% (0)
State:
11.0% (337,911)
Number of households with income $125k - 150k:
Maple Falls:
0.0% (0)
State:
8.0% (244,934)
Number of households with income $150k - 200k:
Maple Falls:
5.4% (9)
Washington:
10.5% (323,812)
Number of households with income > $200k:
Maple Falls:
0.0% (0)
State:
16.2% (499,799)
Aggregate household income in Maple Falls in 2022: $7,807,058
Median family income in Maple Falls in 2022:
Maple Falls:
$54,693
State:
$109,192
Number of families with income $40k - 50k:
Maple Falls:
50.9% (30)
State:
4.9% (94,310)
Number of families with income $50k - 60k:
Maple Falls:
32.9% (19)
State:
5.3% (101,674)
Number of families with income $150k - 200k:
Maple Falls:
16.2% (10)
State:
13.0% (250,874)
Median income for 2 person families:
Maple Falls:
$56,125
State:
$96,815
Median income for families with 0 earners:
Maple Falls:
$61,500
State:
$60,470
Median income for families with 1 earner:
Maple Falls:
$0
State:
$83,136
Median income for families with 2 earners:
Maple Falls:
$0
State:
$135,539
Median income for families with 3+ earners:
Maple Falls:
$0
State:
$163,538
Median per capita income in Maple Falls in 2022:
Maple Falls:
$33,459
State:
$50,764
Change in median per capita income between 2000 and 2022:
Maple Falls, Washington:
+38.2%
Washington:
+121.0%
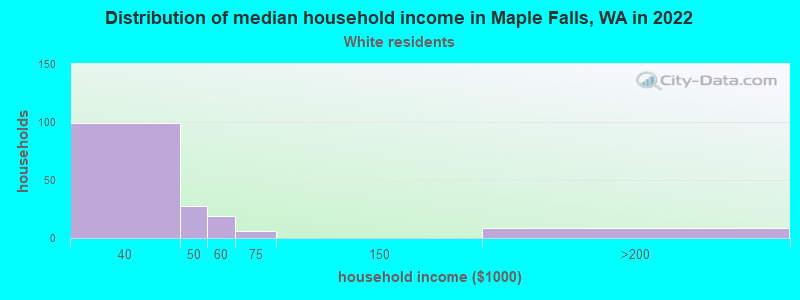
Income statistics for White residents
Median household income in Maple Falls, WA in 2022:
Maple Falls:
$32,984
State:
$91,916
Change in median household income between 2000 and 2022:: -20.0%
Maple Falls, Washington:
-20.0%
State:
+95.4%
Number of households with income < $10k:
Maple Falls:
0.0% (0)
State:
4.3% (95,850)
Number of households with income $10k - 20k:
Maple Falls:
0.0% (0)
State:
4.8% (106,421)
Number of households with income $20k - 30k:
Maple Falls:
0.0% (0)
Washington:
5.5% (122,860)
Number of households with income $30k - 40k:
Maple Falls:
61.5% (99)
State:
5.4% (119,627)
Number of households with income $40k - 50k:
Maple Falls:
17.4% (28)
State:
5.9% (132,276)
Number of households with income $50k - 60k:
Maple Falls:
11.8% (19)
State:
6.1% (136,212)
Number of households with income $60k - 75k:
Maple Falls:
3.7% (6)
State:
8.8% (196,086)
Number of households with income $75k - 100k:
Maple Falls:
0.0% (0)
Washington:
13.4% (299,192)
Number of households with income $100k - 125k:
Maple Falls:
0.0% (0)
State:
11.3% (252,209)
Number of households with income $125k - 150k:
Maple Falls:
0.0% (0)
State:
7.9% (175,962)
Number of households with income $150k - 200k:
Maple Falls:
5.6% (9)
State:
10.7% (239,156)
Number of households with income > $200k:
Maple Falls:
0.0% (0)
State:
16.1% (359,917)
Aggregate household income in Maple Falls in 2022: $7,792,664
Median family income in Maple Falls in 2022:
Maple Falls:
$53,768
Washington:
$112,511
Number of families with income $40k - 50k:
Maple Falls:
49.0% (27)
Washington:
4.6% (63,009)
Number of families with income $50k - 60k:
Maple Falls:
34.7% (19)
State:
5.0% (69,270)
Number of families with income $150k - 200k:
Maple Falls:
16.3% (9)
Washington:
13.7% (188,621)
Median per capita income in Maple Falls in 2022:
Maple Falls:
$34,858
Washington:
$55,212
Change in median per capita income between 2000 and 2022:
Maple Falls, Washington:
+43.9%
State:
+123.8%
Discuss Maple Falls, Washington (WA) on our hugely popular Washington forum.