The median household income in Marrowstone, WA in 2022 was $72,164, which was 26.5% less than the median annual income of $91,306 across the entire state of Washington. Compared to the median income of $38,182 in 2000 this represents an increase of 47.1%. The per capita income in 2022 was $53,940, which means an increase of 59.2% compared to 2000 when it was $22,028.
Whole page based on the data from 2000 / 2022 when the population of Marrowstone, Washington was 837 / 893
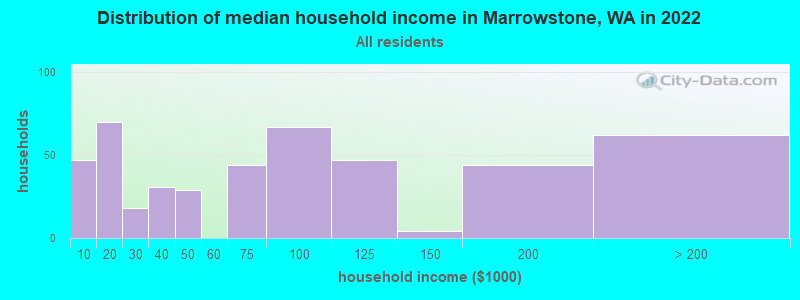
Income statistics for all residents
Median household income in Marrowstone, WA in 2022:
Marrowstone:
$72,164
State:
$91,306
Change in median household income between 2000 and 2022:
Marrowstone, Washington:
+89.0%
State:
+99.5%
Number of households with income < $10k:
Marrowstone:
10.2% (47)
Washington:
4.5% (139,331)
Number of households with income $10k - 20k:
Marrowstone:
15.1% (70)
Washington:
5.0% (154,508)
Number of households with income $20k - 30k:
Marrowstone:
3.9% (18)
State:
5.4% (166,555)
Number of households with income $30k - 40k:
Marrowstone:
6.7% (31)
Washington:
5.5% (170,324)
Number of households with income $40k - 50k:
Marrowstone:
6.3% (29)
Washington:
6.0% (183,941)
Number of households with income $50k - 60k:
Marrowstone:
0.0% (0)
Washington:
6.1% (187,395)
Number of households with income $60k - 75k:
Marrowstone:
9.5% (44)
State:
8.7% (266,771)
Number of households with income $75k - 100k:
Marrowstone:
14.5% (67)
Washington:
13.1% (404,672)
Number of households with income $100k - 125k:
Marrowstone:
10.2% (47)
State:
11.0% (337,911)
Number of households with income $125k - 150k:
Marrowstone:
0.9% (4)
State:
8.0% (244,934)
Number of households with income $150k - 200k:
Marrowstone:
9.5% (44)
Washington:
10.5% (323,812)
Number of households with income > $200k:
Marrowstone:
13.4% (62)
Washington:
16.2% (499,799)
Aggregate household income in Marrowstone in 2022: $48,269,839
Median family income in Marrowstone in 2022:
Marrowstone:
$72,387
State:
$109,192
Number of families with income $10k - 20k:
Marrowstone:
21.8% (65)
Washington:
2.6% (50,138)
Number of families with income $20k - 30k:
Marrowstone:
2.7% (8)
State:
3.2% (61,974)
Number of families with income $30k - 40k:
Marrowstone:
3.8% (11)
State:
4.1% (80,240)
Number of families with income $40k - 50k:
Marrowstone:
6.3% (19)
State:
4.9% (94,310)
Number of families with income $50k - 60k:
Marrowstone:
1.3% (4)
State:
5.3% (101,674)
Number of families with income $60k - 75k:
Marrowstone:
13.3% (40)
State:
8.2% (158,348)
Number of families with income $75k - 100k:
Marrowstone:
12.7% (38)
State:
13.8% (267,812)
Number of families with income $100k - 125k:
Marrowstone:
15.6% (47)
Washington:
12.4% (240,213)
Number of families with income $150k - 200k:
Marrowstone:
2.3% (7)
State:
13.0% (250,874)
Number of families with income > $200k:
Marrowstone:
20.2% (61)
Washington:
20.4% (393,898)
Median income for 2 person families:
Marrowstone:
$65,479
Washington:
$96,815
Median per capita income in Marrowstone in 2022:
Marrowstone:
$53,940
State:
$50,764
Change in median per capita income between 2000 and 2022:
Marrowstone, Washington:
+144.9%
Washington:
+121.0%
Income statistics for White residents
Median household income in Marrowstone, WA in 2022:
Marrowstone:
$71,634
State:
$91,916
Change in median household income between 2000 and 2022:
Marrowstone, Washington:
+86.5%
State:
+95.4%
Number of households with income < $10k:
Marrowstone:
10.3% (46)
State:
4.3% (95,850)
Number of households with income $10k - 20k:
Marrowstone:
15.1% (67)
Washington:
4.8% (106,421)
Number of households with income $20k - 30k:
Marrowstone:
3.8% (17)
Washington:
5.5% (122,860)
Number of households with income $30k - 40k:
Marrowstone:
6.5% (29)
State:
5.4% (119,627)
Number of households with income $40k - 50k:
Marrowstone:
6.3% (28)
State:
5.9% (132,276)
Number of households with income $50k - 60k:
Marrowstone:
0.0% (0)
Washington:
6.1% (136,212)
Number of households with income $60k - 75k:
Marrowstone:
9.7% (43)
Washington:
8.8% (196,086)
Number of households with income $75k - 100k:
Marrowstone:
14.4% (64)
State:
13.4% (299,192)
Number of households with income $100k - 125k:
Marrowstone:
10.1% (45)
State:
11.3% (252,209)
Number of households with income $125k - 150k:
Marrowstone:
0.9% (4)
State:
7.9% (175,962)
Number of households with income $150k - 200k:
Marrowstone:
9.4% (42)
Washington:
10.7% (239,156)
Number of households with income > $200k:
Marrowstone:
13.5% (60)
State:
16.1% (359,917)
Aggregate household income in Marrowstone in 2022: $46,260,828
Median family income in Marrowstone in 2022:
Marrowstone:
$72,182
Washington:
$112,511
Number of families with income $10k - 20k:
Marrowstone:
21.3% (61)
State:
2.0% (28,228)
Number of families with income $20k - 30k:
Marrowstone:
2.6% (7)
State:
2.9% (39,288)
Number of families with income $30k - 40k:
Marrowstone:
3.6% (10)
State:
3.6% (50,190)
Number of families with income $40k - 50k:
Marrowstone:
6.3% (18)
State:
4.6% (63,009)
Number of families with income $50k - 60k:
Marrowstone:
1.3% (4)
State:
5.0% (69,270)
Number of families with income $60k - 75k:
Marrowstone:
13.6% (39)
State:
8.2% (112,369)
Number of families with income $75k - 100k:
Marrowstone:
12.8% (36)
Washington:
14.1% (194,214)
Number of families with income $100k - 125k:
Marrowstone:
15.9% (45)
Washington:
13.2% (182,184)
Number of families with income $150k - 200k:
Marrowstone:
2.3% (7)
State:
13.7% (188,621)
Number of families with income > $200k:
Marrowstone:
20.4% (58)
State:
20.8% (285,982)
Median per capita income in Marrowstone in 2022:
Marrowstone:
$55,376
State:
$55,212
Income statistics for Hispanic or Latino residents
Median per capita income in Marrowstone in 2022:
Marrowstone:
$6,474
State:
$28,252
Income statistics for American Indian and Alaska Native residents
Median per capita income in Marrowstone in 2022:
Marrowstone:
$180,241
Washington:
$27,053
Change in median per capita income between 2000 and 2022:
Marrowstone, Washington:
+97.1%
Washington:
+98.6%
Income statistics for Multirace residents
Median per capita income in Marrowstone in 2022:
Marrowstone:
$27,463
Washington:
$32,496
Change in median per capita income between 2000 and 2022:
Marrowstone, Washington:
+144.1%
Washington:
+156.8%
Discuss Marrowstone, Washington (WA) on our hugely popular Washington forum.