The median household income in Maynardville, TN in 2022 was $44,606, which was 46.3% less than the median annual income of $65,254 across the entire state of Tennessee. Compared to the median income of $23,077 in 2000 this represents an increase of 48.3%. The per capita income in 2022 was $23,586, which means an increase of 48.4% compared to 2000 when it was $12,168.
Whole page based on the data from 2000 / 2022 when the population of Maynardville, Tennessee was 1,782 / 2,500
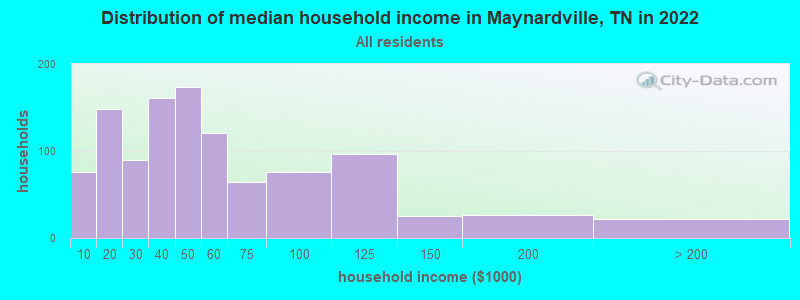
Income statistics for all residents
Median household income in Maynardville, TN in 2022:
Maynardville:
$44,606
Tennessee:
$65,254
Change in median household income between 2000 and 2022:
Maynardville, Tennessee:
+93.3%
State:
+79.5%
Number of households with income < $10k:
Maynardville:
7.1% (76)
State:
5.4% (154,793)
Number of households with income $10k - 20k:
Maynardville:
13.7% (148)
State:
8.0% (228,599)
Number of households with income $20k - 30k:
Maynardville:
8.3% (90)
State:
7.9% (224,908)
Number of households with income $30k - 40k:
Maynardville:
14.9% (161)
State:
8.6% (244,297)
Number of households with income $40k - 50k:
Maynardville:
16.0% (173)
State:
8.4% (238,949)
Number of households with income $50k - 60k:
Maynardville:
11.2% (121)
Tennessee:
7.7% (218,438)
Number of households with income $60k - 75k:
Maynardville:
5.9% (64)
Tennessee:
10.3% (294,172)
Number of households with income $75k - 100k:
Maynardville:
7.1% (76)
State:
13.3% (377,310)
Number of households with income $100k - 125k:
Maynardville:
8.9% (96)
State:
9.5% (269,124)
Number of households with income $125k - 150k:
Maynardville:
2.3% (25)
State:
6.3% (178,328)
Number of households with income $150k - 200k:
Maynardville:
2.4% (26)
State:
7.2% (204,030)
Number of households with income > $200k:
Maynardville:
2.0% (22)
Tennessee:
7.5% (213,736)
Aggregate household income in Maynardville in 2022: $60,377,560
Median family income in Maynardville in 2022:
Maynardville:
$45,429
Tennessee:
$80,910
Number of families with income < $10k:
Maynardville:
10.3% (70)
Tennessee:
3.9% (72,917)
Number of families with income $10k - 20k:
Maynardville:
6.4% (44)
Tennessee:
4.0% (73,770)
Number of families with income $20k - 30k:
Maynardville:
8.7% (59)
Tennessee:
5.6% (104,070)
Number of families with income $30k - 40k:
Maynardville:
15.2% (104)
State:
7.2% (133,292)
Number of families with income $40k - 50k:
Maynardville:
17.0% (116)
State:
7.4% (136,997)
Number of families with income $50k - 60k:
Maynardville:
11.1% (76)
Tennessee:
7.1% (131,374)
Number of families with income $60k - 75k:
Maynardville:
4.7% (32)
State:
10.8% (198,685)
Number of families with income $75k - 100k:
Maynardville:
8.6% (59)
State:
15.1% (279,195)
Number of families with income $100k - 125k:
Maynardville:
11.8% (80)
Tennessee:
11.7% (216,356)
Number of families with income $125k - 150k:
Maynardville:
2.3% (15)
Tennessee:
7.8% (144,000)
Number of families with income $150k - 200k:
Maynardville:
1.8% (12)
State:
9.3% (172,160)
Number of families with income > $200k:
Maynardville:
2.2% (15)
Tennessee:
10.0% (183,756)
Median non-family income in Maynardville in 2022:
Maynardville:
$34,996
State:
$40,285
Median per capita income in Maynardville in 2022:
Maynardville:
$23,587
State:
$36,704
Change in median per capita income between 2000 and 2022:
Maynardville, Tennessee:
+93.8%
State:
+89.3%
Income statistics for White residents
Median household income in Maynardville, TN in 2022:
Maynardville:
$44,823
State:
$69,826
Change in median household income between 2000 and 2022:
Maynardville, Tennessee:
+94.6%
State:
+82.9%
Number of households with income < $10k:
Maynardville:
7.4% (77)
Tennessee:
4.6% (100,279)
Number of households with income $10k - 20k:
Maynardville:
14.0% (146)
State:
7.6% (165,031)
Number of households with income $20k - 30k:
Maynardville:
7.8% (82)
Tennessee:
7.4% (160,229)
Number of households with income $30k - 40k:
Maynardville:
15.0% (157)
State:
8.1% (174,784)
Number of households with income $40k - 50k:
Maynardville:
15.4% (161)
State:
7.8% (169,622)
Number of households with income $50k - 60k:
Maynardville:
11.5% (120)
State:
7.6% (165,508)
Number of households with income $60k - 75k:
Maynardville:
6.0% (63)
State:
10.3% (223,937)
Number of households with income $75k - 100k:
Maynardville:
7.0% (73)
State:
13.5% (292,688)
Number of households with income $100k - 125k:
Maynardville:
9.1% (95)
Tennessee:
10.1% (219,251)
Number of households with income $125k - 150k:
Maynardville:
2.3% (24)
State:
6.6% (142,574)
Number of households with income $150k - 200k:
Maynardville:
2.4% (25)
State:
7.7% (166,039)
Number of households with income > $200k:
Maynardville:
2.1% (22)
State:
8.5% (184,546)
Aggregate household income in Maynardville in 2022: $59,018,346
Median family income in Maynardville in 2022:
Maynardville:
$45,642
Tennessee:
$86,015
Number of families with income < $10k:
Maynardville:
10.7% (70)
Tennessee:
3.1% (43,751)
Number of families with income $10k - 20k:
Maynardville:
6.7% (44)
State:
3.5% (49,925)
Number of families with income $20k - 30k:
Maynardville:
7.9% (52)
State:
5.0% (70,431)
Number of families with income $30k - 40k:
Maynardville:
15.1% (100)
Tennessee:
6.6% (93,498)
Number of families with income $40k - 50k:
Maynardville:
16.6% (109)
Tennessee:
6.8% (96,726)
Number of families with income $50k - 60k:
Maynardville:
11.5% (76)
State:
7.2% (101,879)
Number of families with income $60k - 75k:
Maynardville:
4.7% (31)
State:
10.7% (151,997)
Number of families with income $75k - 100k:
Maynardville:
8.4% (56)
State:
15.4% (218,373)
Number of families with income $100k - 125k:
Maynardville:
12.0% (79)
State:
12.6% (178,761)
Number of families with income $125k - 150k:
Maynardville:
2.3% (15)
State:
8.2% (116,575)
Number of families with income $150k - 200k:
Maynardville:
1.8% (12)
Tennessee:
9.9% (141,123)
Number of families with income > $200k:
Maynardville:
2.3% (15)
State:
11.2% (159,431)
Median non-family income in Maynardville in 2022:
Maynardville:
$35,218
Tennessee:
$41,178
Median per capita income in Maynardville in 2022:
Maynardville:
$24,334
State:
$40,126
Change in median per capita income between 2000 and 2022:
Maynardville, Tennessee:
+100.1%
Tennessee:
+92.6%
Income statistics for Black or African American residents
Median per capita income in Maynardville in 2022:
Maynardville:
$4,528
Tennessee:
$27,306
Income statistics for Hispanic or Latino residents
Aggregate household income in Maynardville in 2022: $219,167
Median per capita income in Maynardville in 2022:
Maynardville:
$16,391
Tennessee:
$21,276
Change in median per capita income between 2000 and 2022:: -10.3%
Maynardville, Tennessee:
-10.3%
Tennessee:
+76.0%
Income statistics for Multirace residents
Number of households with income < $10k:
Maynardville:
0.0% (0)
State:
6.7% (9,867)
Number of households with income $10k - 20k:
Maynardville:
0.0% (0)
State:
8.6% (12,639)
Number of households with income $20k - 30k:
Maynardville:
92.9% (13)
Tennessee:
9.2% (13,555)
Number of households with income $30k - 40k:
Maynardville:
0.0% (0)
Tennessee:
10.3% (15,117)
Number of households with income $40k - 50k:
Maynardville:
7.1% (1)
State:
9.4% (13,829)
Number of households with income $50k - 60k:
Maynardville:
0.0% (0)
Tennessee:
7.5% (10,969)
Number of households with income $60k - 75k:
Maynardville:
0.0% (0)
State:
9.2% (13,568)
Number of households with income $75k - 100k:
Maynardville:
0.0% (0)
State:
12.6% (18,516)
Number of households with income $100k - 125k:
Maynardville:
0.0% (0)
State:
8.6% (12,656)
Number of households with income $125k - 150k:
Maynardville:
0.0% (0)
State:
5.9% (8,674)
Number of households with income $150k - 200k:
Maynardville:
0.0% (0)
State:
7.2% (10,611)
Number of households with income > $200k:
Maynardville:
0.0% (0)
State:
4.8% (6,986)
Aggregate household income in Maynardville in 2022: $6,421,743
Median per capita income in Maynardville in 2022:
Maynardville:
$4,983
State:
$24,436
Change in median per capita income between 2000 and 2022:: -49.4%
Maynardville, Tennessee:
-49.4%
State:
+84.3%
Discuss Maynardville, Tennessee (TN) on our hugely popular Tennessee forum.