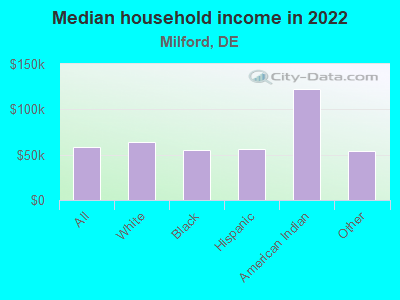
The median household income in Milford, DE in 2022 was $58,000, which was 41.7% less than the median annual income of $82,174 across the entire state of Delaware. Compared to the median income of $32,525 in 2000 this represents an increase of 43.9%. The per capita income in 2022 was $36,268, which means an increase of 55.4% compared to 2000 when it was $16,181.
Whole page based on the data from 2000 / 2022 when the population of Milford, Delaware was 6,732 / 12,458
Income statistics for all residents
Median household income in Milford, DE in 2022:
Milford:
$58,000
Delaware:
$82,174
Change in median household income between 2000 and 2022:
Milford, Delaware:
+78.3%
State:
+73.4%
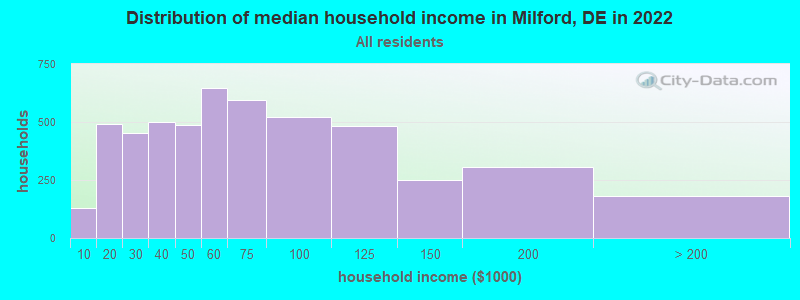
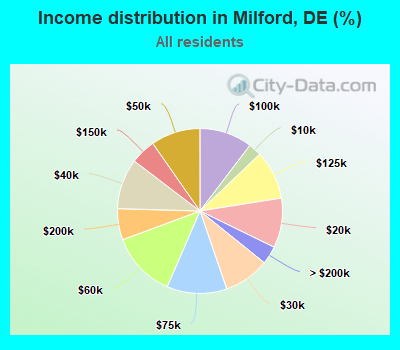
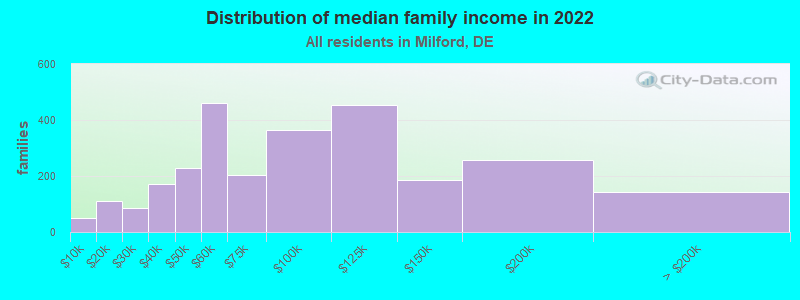
Number of households with income < $10k:
Milford:
2.6% (129)
Delaware:
4.0% (16,288)
Number of households with income $10k - 20k:
Milford:
9.7% (491)
Delaware:
5.6% (22,545)
Number of households with income $20k - 30k:
Milford:
9.0% (452)
Delaware:
6.2% (24,941)
Number of households with income $30k - 40k:
Milford:
9.9% (499)
State:
6.7% (27,051)
Number of households with income $40k - 50k:
Milford:
9.7% (489)
Delaware:
7.3% (29,468)
Number of households with income $50k - 60k:
Milford:
12.8% (648)
State:
6.3% (25,207)
Number of households with income $60k - 75k:
Milford:
11.8% (593)
Delaware:
9.7% (38,914)
Number of households with income $75k - 100k:
Milford:
10.4% (522)
State:
13.9% (56,111)
Number of households with income $100k - 125k:
Milford:
9.6% (484)
State:
11.8% (47,641)
Number of households with income $125k - 150k:
Milford:
4.9% (249)
Delaware:
8.2% (32,964)
Number of households with income $150k - 200k:
Milford:
6.1% (308)
State:
9.4% (37,675)
Number of households with income > $200k:
Milford:
3.5% (179)
State:
10.8% (43,529)
Aggregate household income in Milford in 2022: $420,675,408
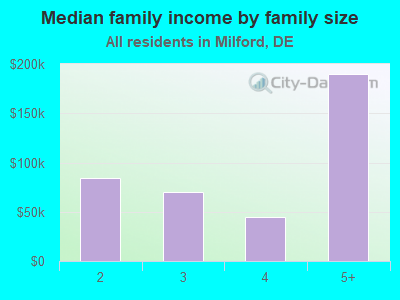
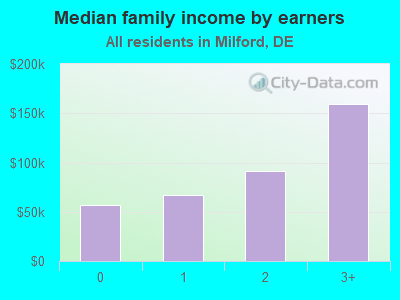
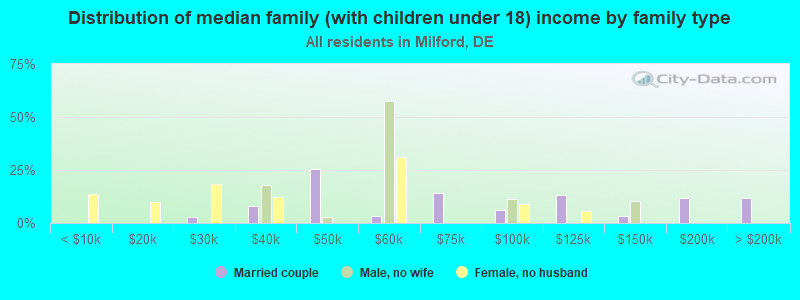
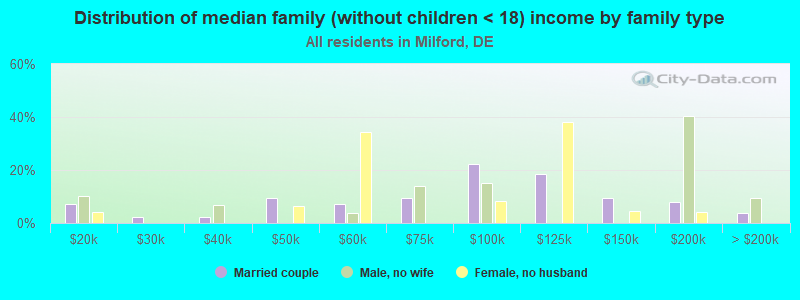
Median family income in Milford in 2022:
Milford:
$76,357
State:
$100,128
Number of families with income < $10k:
Milford:
1.8% (50)
State:
2.4% (6,390)
Number of families with income $10k - 20k:
Milford:
4.1% (112)
State:
3.0% (7,793)
Number of families with income $20k - 30k:
Milford:
3.2% (87)
Delaware:
3.3% (8,695)
Number of families with income $30k - 40k:
Milford:
6.4% (173)
State:
4.3% (11,461)
Number of families with income $40k - 50k:
Milford:
8.5% (230)
State:
6.3% (16,568)
Number of families with income $50k - 60k:
Milford:
17.0% (462)
State:
6.0% (15,705)
Number of families with income $60k - 75k:
Milford:
7.5% (203)
Delaware:
9.9% (26,167)
Number of families with income $75k - 100k:
Milford:
13.4% (363)
State:
14.8% (38,950)
Number of families with income $100k - 125k:
Milford:
16.7% (453)
State:
14.1% (37,212)
Number of families with income $125k - 150k:
Milford:
6.8% (184)
Delaware:
9.4% (24,883)
Number of families with income $150k - 200k:
Milford:
9.4% (256)
State:
12.4% (32,601)
Number of families with income > $200k:
Milford:
5.3% (144)
State:
14.2% (37,460)
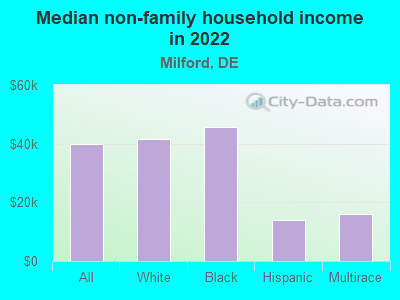
Median non-family income in Milford in 2022:
Milford:
$39,769
State:
$46,579
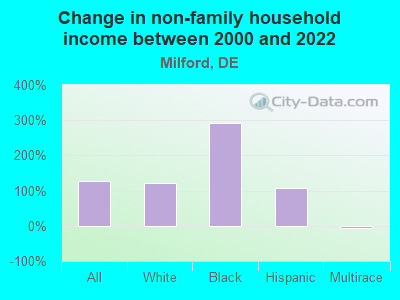
Change in median non-family income between 2000 and 2022:
Milford, Delaware:
+127.6%
State:
+55.8%
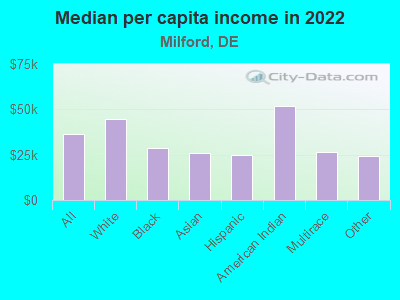
Median per capita income in Milford in 2022:
Milford:
$36,269
State:
$42,571
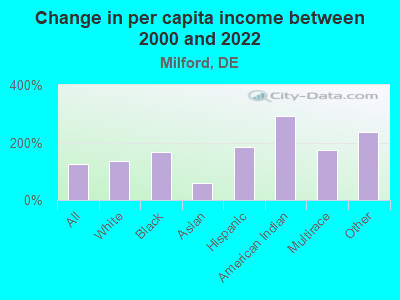
Change in median per capita income between 2000 and 2022:
Milford, Delaware:
+124.1%
State:
+82.7%
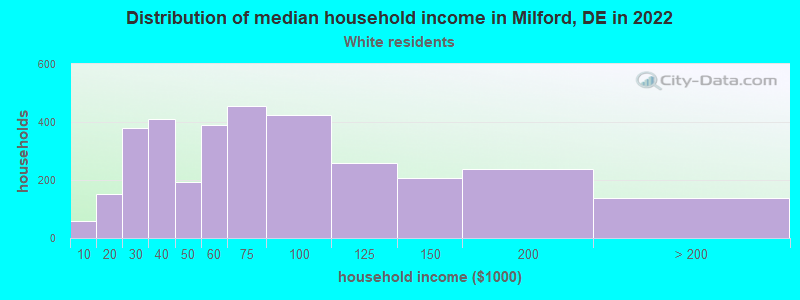
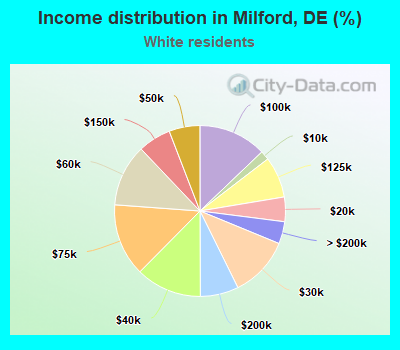
Income statistics for White residents
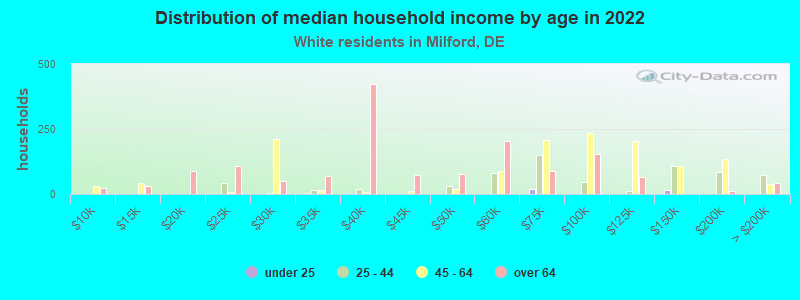
Median household income in Milford, DE in 2022:
Milford:
$64,333
Delaware:
$89,351
Change in median household income between 2000 and 2022:
Milford, Delaware:
+83.3%
State:
+76.9%
Number of households with income < $10k:
Milford:
1.7% (57)
Delaware:
3.4% (9,074)
Number of households with income $10k - 20k:
Milford:
4.6% (153)
State:
4.1% (10,674)
Number of households with income $20k - 30k:
Milford:
11.5% (379)
Delaware:
5.5% (14,529)
Number of households with income $30k - 40k:
Milford:
12.5% (412)
State:
5.9% (15,596)
Number of households with income $40k - 50k:
Milford:
5.8% (193)
State:
6.5% (17,134)
Number of households with income $50k - 60k:
Milford:
11.8% (388)
State:
6.2% (16,208)
Number of households with income $60k - 75k:
Milford:
13.7% (454)
Delaware:
9.9% (26,007)
Number of households with income $75k - 100k:
Milford:
12.9% (425)
State:
14.7% (38,630)
Number of households with income $100k - 125k:
Milford:
7.8% (257)
State:
12.4% (32,584)
Number of households with income $125k - 150k:
Milford:
6.2% (206)
Delaware:
9.5% (24,918)
Number of households with income $150k - 200k:
Milford:
7.2% (239)
State:
10.2% (27,001)
Number of households with income > $200k:
Milford:
4.2% (139)
Delaware:
11.8% (31,108)
Aggregate household income in Milford in 2022: $302,343,729
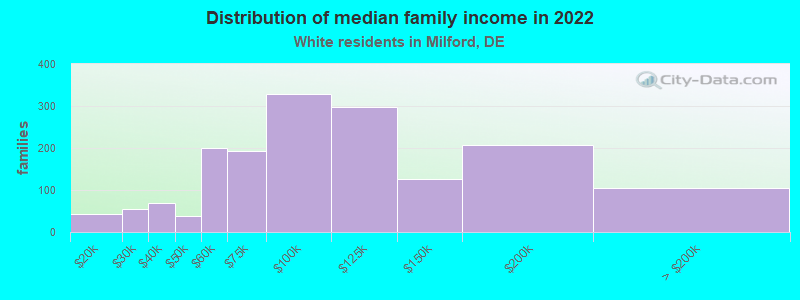
Median family income in Milford in 2022:
Milford:
$93,566
State:
$107,254
Number of families with income $10k - 20k:
Milford:
2.6% (44)
State:
1.9% (3,364)
Number of families with income $20k - 30k:
Milford:
3.3% (55)
State:
2.1% (3,677)
Number of families with income $30k - 40k:
Milford:
4.2% (70)
State:
3.4% (5,879)
Number of families with income $40k - 50k:
Milford:
2.3% (38)
State:
5.0% (8,600)
Number of families with income $50k - 60k:
Milford:
12.0% (200)
State:
5.6% (9,745)
Number of families with income $60k - 75k:
Milford:
11.7% (194)
Delaware:
10.0% (17,322)
Number of families with income $75k - 100k:
Milford:
19.7% (328)
Delaware:
15.9% (27,642)
Number of families with income $100k - 125k:
Milford:
17.9% (298)
Delaware:
14.4% (25,049)
Number of families with income $125k - 150k:
Milford:
7.6% (126)
Delaware:
11.0% (19,185)
Number of families with income $150k - 200k:
Milford:
12.4% (206)
Delaware:
13.4% (23,326)
Number of families with income > $200k:
Milford:
6.3% (105)
State:
15.6% (27,066)
Median non-family income in Milford in 2022:
Milford:
$41,562
State:
$50,472
Change in median non-family income between 2000 and 2022:
Milford, Delaware:
+123.0%
Delaware:
+62.2%
Median per capita income in Milford in 2022:
Milford:
$44,575
State:
$49,694
Change in median per capita income between 2000 and 2022:
Milford, Delaware:
+135.8%
State:
+94.2%
Income statistics for Black or African American residents
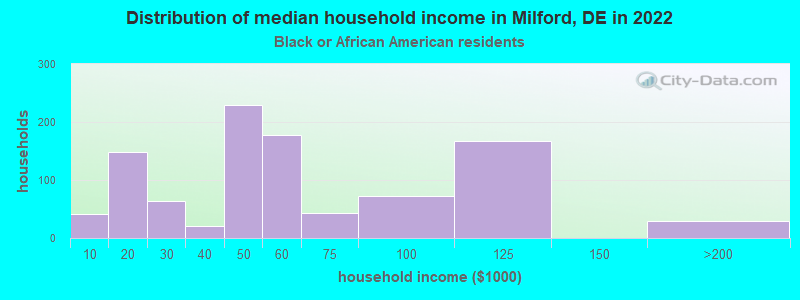
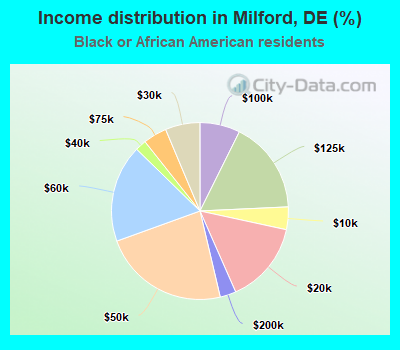
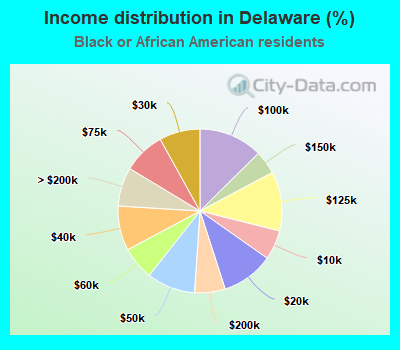
Median household income in Milford, DE in 2022:
Milford:
$54,781
Delaware:
$61,228
Change in median household income between 2000 and 2022:
Milford, Delaware:
+131.0%
State:
+72.4%
Number of households with income < $10k:
Milford:
4.1% (41)
Delaware:
5.8% (4,827)
Number of households with income $10k - 20k:
Milford:
15.0% (149)
State:
10.3% (8,504)
Number of households with income $20k - 30k:
Milford:
6.3% (63)
State:
8.0% (6,660)
Number of households with income $30k - 40k:
Milford:
2.0% (20)
State:
8.8% (7,277)
Number of households with income $40k - 50k:
Milford:
23.2% (230)
State:
9.6% (7,918)
Number of households with income $50k - 60k:
Milford:
17.8% (177)
State:
6.6% (5,428)
Number of households with income $60k - 75k:
Milford:
4.3% (43)
Delaware:
8.3% (6,859)
Number of households with income $75k - 100k:
Milford:
7.4% (73)
State:
12.6% (10,436)
Number of households with income $100k - 125k:
Milford:
16.9% (168)
State:
11.7% (9,680)
Number of households with income $125k - 150k:
Milford:
0.0% (0)
Delaware:
4.6% (3,826)
Number of households with income $150k - 200k:
Milford:
2.9% (29)
Delaware:
6.0% (4,991)
Number of households with income > $200k:
Milford:
0.0% (0)
State:
7.7% (6,355)
Aggregate household income in Milford in 2022: $76,449,397
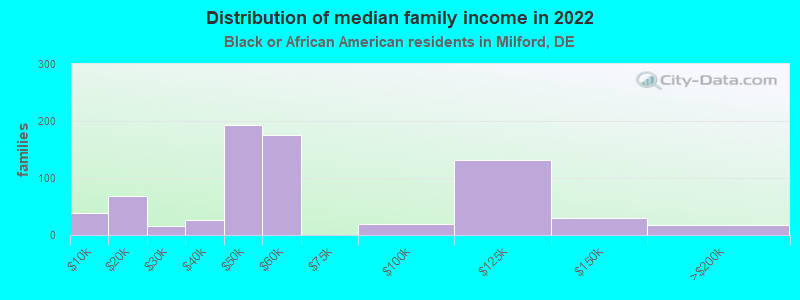
Median family income in Milford in 2022:
Milford:
$63,242
State:
$83,261
Number of families with income < $10k:
Milford:
5.4% (38)
State:
5.3% (2,684)
Number of families with income $10k - 20k:
Milford:
9.5% (68)
State:
5.7% (2,917)
Number of families with income $20k - 30k:
Milford:
2.2% (16)
State:
4.7% (2,390)
Number of families with income $30k - 40k:
Milford:
3.7% (26)
State:
6.0% (3,030)
Number of families with income $40k - 50k:
Milford:
27.1% (193)
Delaware:
8.5% (4,339)
Number of families with income $50k - 60k:
Milford:
24.5% (175)
State:
6.7% (3,434)
Number of families with income $75k - 100k:
Milford:
2.7% (19)
State:
12.4% (6,312)
Number of families with income $100k - 125k:
Milford:
18.3% (131)
State:
16.0% (8,129)
Number of families with income $125k - 150k:
Milford:
4.2% (30)
State:
5.8% (2,928)
Number of families with income $150k - 200k:
Milford:
2.3% (17)
State:
8.5% (4,350)
Median non-family income in Milford in 2022:
Milford:
$45,705
Delaware:
$36,936
Median per capita income in Milford in 2022:
Milford:
$28,465
State:
$32,135
Income statistics for Asian residents
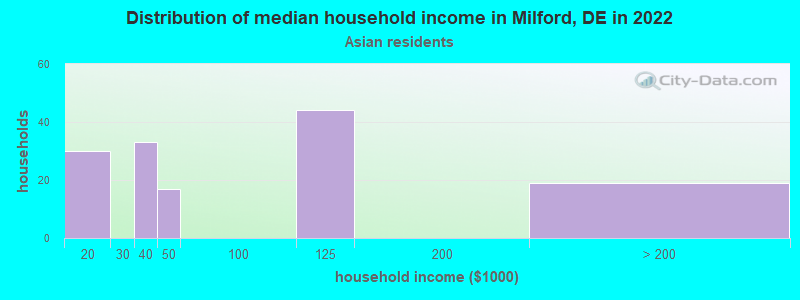
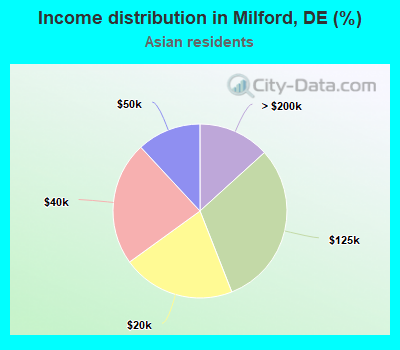
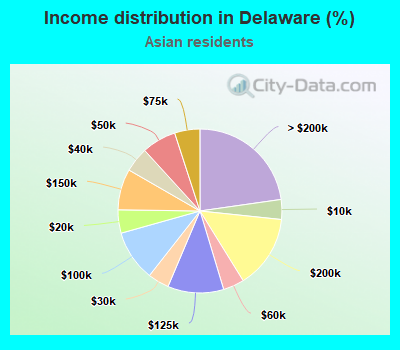
Number of households with income < $10k:
Milford:
0.0% (0)
State:
3.9% (588)
Number of households with income $10k - 20k:
Milford:
21.0% (30)
Delaware:
4.6% (693)
Number of households with income $20k - 30k:
Milford:
0.0% (0)
State:
4.2% (632)
Number of households with income $30k - 40k:
Milford:
23.1% (33)
State:
4.9% (738)
Number of households with income $40k - 50k:
Milford:
11.9% (17)
State:
6.8% (1,021)
Number of households with income $50k - 60k:
Milford:
0.0% (0)
Delaware:
4.1% (624)
Number of households with income $60k - 75k:
Milford:
0.0% (0)
State:
5.0% (751)
Number of households with income $75k - 100k:
Milford:
0.0% (0)
Delaware:
10.1% (1,514)
Number of households with income $100k - 125k:
Milford:
30.8% (44)
Delaware:
11.1% (1,664)
Number of households with income $125k - 150k:
Milford:
0.0% (0)
State:
8.1% (1,217)
Number of households with income $150k - 200k:
Milford:
0.0% (0)
Delaware:
14.5% (2,187)
Number of households with income > $200k:
Milford:
13.3% (19)
State:
22.8% (3,427)
Aggregate household income in Milford in 2022: $6,405,722
Median per capita income in Milford in 2022:
Milford:
$26,067
State:
$51,124
Change in median per capita income between 2000 and 2022:
Milford, Delaware:
+57.8%
State:
+79.9%
Income statistics for Hispanic or Latino residents
Median household income in Milford, DE in 2022:
Milford:
$56,578
Delaware:
$71,733
Change in median household income between 2000 and 2022:
Milford, Delaware:
+95.1%
Delaware:
+97.7%
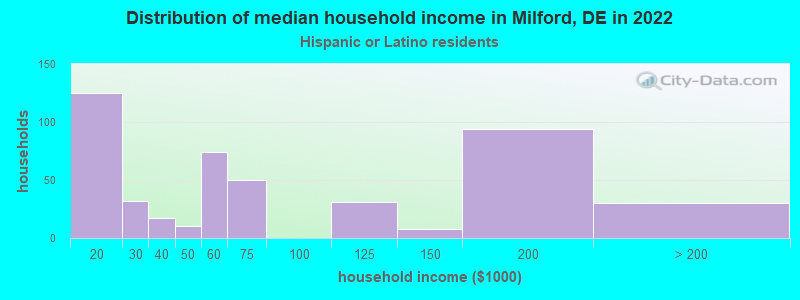
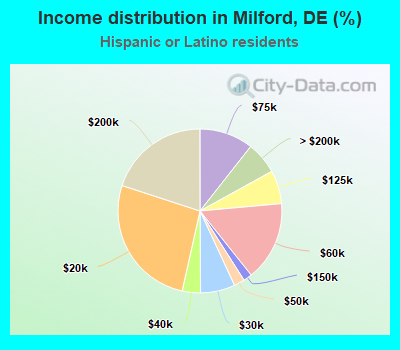
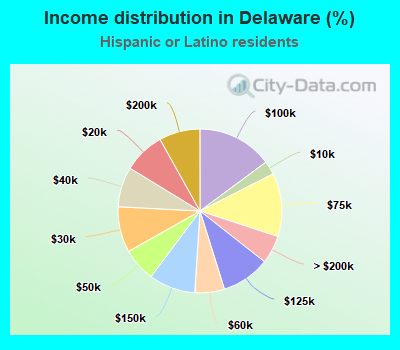
Number of households with income < $10k:
Milford:
0.0% (0)
Delaware:
2.7% (797)
Number of households with income $10k - 20k:
Milford:
26.5% (125)
Delaware:
8.2% (2,421)
Number of households with income $20k - 30k:
Milford:
6.8% (32)
State:
9.0% (2,672)
Number of households with income $30k - 40k:
Milford:
3.6% (17)
State:
7.9% (2,345)
Number of households with income $40k - 50k:
Milford:
2.1% (10)
State:
6.6% (1,962)
Number of households with income $50k - 60k:
Milford:
15.7% (74)
State:
5.9% (1,735)
Number of households with income $60k - 75k:
Milford:
10.6% (50)
State:
12.5% (3,709)
Number of households with income $75k - 100k:
Milford:
0.0% (0)
State:
14.8% (4,403)
Number of households with income $100k - 125k:
Milford:
6.6% (31)
State:
9.6% (2,833)
Number of households with income $125k - 150k:
Milford:
1.7% (8)
Delaware:
9.2% (2,723)
Number of households with income $150k - 200k:
Milford:
20.0% (94)
Delaware:
8.1% (2,398)
Number of households with income > $200k:
Milford:
6.4% (30)
State:
5.6% (1,653)
Aggregate household income in Milford in 2022: $35,801,914
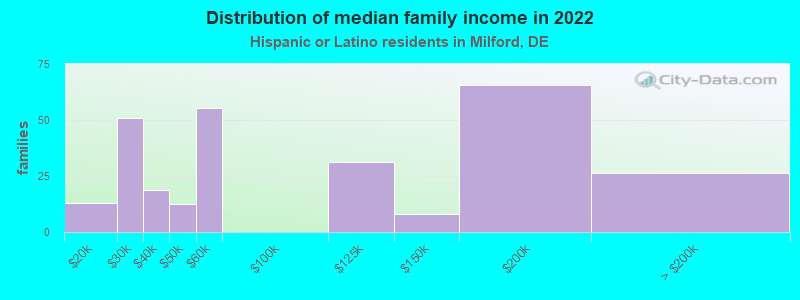
Median family income in Milford in 2022:
Milford:
$56,280
State:
$71,093
Number of families with income $10k - 20k:
Milford:
4.6% (13)
State:
6.3% (1,436)
Number of families with income $20k - 30k:
Milford:
18.1% (51)
State:
8.4% (1,913)
Number of families with income $30k - 40k:
Milford:
6.7% (19)
State:
7.1% (1,609)
Number of families with income $40k - 50k:
Milford:
4.4% (12)
State:
10.6% (2,398)
Number of families with income $50k - 60k:
Milford:
19.7% (55)
State:
6.2% (1,399)
Number of families with income $100k - 125k:
Milford:
11.0% (31)
State:
9.6% (2,179)
Number of families with income $125k - 150k:
Milford:
2.8% (8)
Delaware:
9.9% (2,257)
Number of families with income $150k - 200k:
Milford:
23.3% (66)
State:
10.0% (2,271)
Number of families with income > $200k:
Milford:
9.4% (26)
State:
4.9% (1,113)
Median non-family income in Milford in 2022:
Milford:
$14,078
Delaware:
$46,692
Change in median non-family income between 2000 and 2022:
Milford, Delaware:
+107.5%
State:
+81.9%
Median per capita income in Milford in 2022:
Milford:
$24,956
Delaware:
$25,402
Income statistics for American Indian and Alaska Native residents
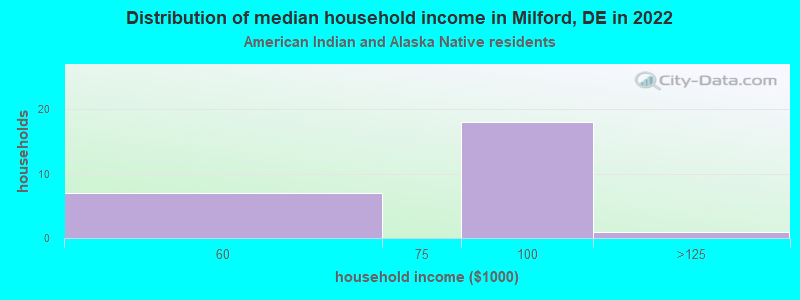
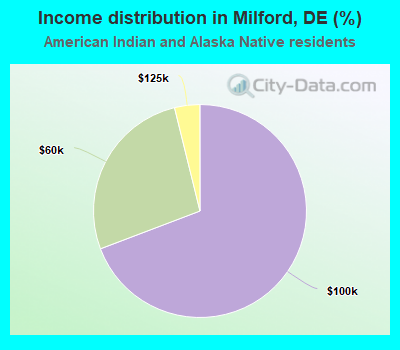
Median household income in Milford, DE in 2022:
Milford:
$122,470
State:
$70,375
Number of households with income < $10k:
Milford:
0.0% (0)
Delaware:
4.5% (56)
Number of households with income $10k - 20k:
Milford:
0.0% (0)
Delaware:
13.2% (166)
Number of households with income $20k - 30k:
Milford:
0.0% (0)
State:
11.6% (146)
Number of households with income $30k - 40k:
Milford:
0.0% (0)
State:
12.1% (152)
Number of households with income $40k - 50k:
Milford:
0.0% (0)
State:
6.2% (78)
Number of households with income $50k - 60k:
Milford:
26.9% (7)
State:
12.8% (161)
Number of households with income $60k - 75k:
Milford:
0.0% (0)
State:
4.0% (50)
Number of households with income $75k - 100k:
Milford:
69.2% (18)
State:
17.3% (217)
Number of households with income $100k - 125k:
Milford:
3.8% (1)
Delaware:
4.9% (62)
Number of households with income $125k - 150k:
Milford:
0.0% (0)
Delaware:
1.8% (22)
Number of households with income $150k - 200k:
Milford:
0.0% (0)
Delaware:
2.9% (36)
Number of households with income > $200k:
Milford:
0.0% (0)
State:
8.6% (108)
Aggregate household income in Milford in 2022: $879,996
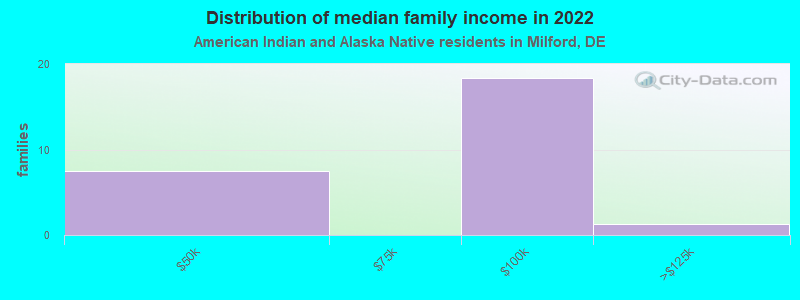
Median family income in Milford in 2022:
Milford:
$91,476
Delaware:
$54,234
Number of families with income $40k - 50k:
Milford:
27.6% (7)
State:
5.2% (42)
Number of families with income $75k - 100k:
Milford:
67.8% (18)
Delaware:
11.7% (94)
Number of families with income $100k - 125k:
Milford:
4.6% (1)
State:
4.0% (32)
Median per capita income in Milford in 2022:
Milford:
$52,065
State:
$31,308
Income statistics for Multirace residents
Number of households with income < $10k:
Milford:
0.0% (0)
State:
5.6% (1,606)
Number of households with income $10k - 20k:
Milford:
40.9% (155)
Delaware:
5.2% (1,507)
Number of households with income $20k - 30k:
Milford:
0.0% (0)
State:
7.5% (2,173)
Number of households with income $30k - 40k:
Milford:
11.1% (42)
State:
9.4% (2,728)
Number of households with income $40k - 50k:
Milford:
9.2% (35)
State:
10.5% (3,041)
Number of households with income $50k - 60k:
Milford:
0.0% (0)
State:
7.6% (2,189)
Number of households with income $60k - 75k:
Milford:
15.8% (60)
State:
12.5% (3,623)
Number of households with income $75k - 100k:
Milford:
0.0% (0)
State:
12.0% (3,469)
Number of households with income $100k - 125k:
Milford:
0.0% (0)
Delaware:
7.6% (2,197)
Number of households with income $125k - 150k:
Milford:
13.2% (50)
State:
6.8% (1,954)
Number of households with income $150k - 200k:
Milford:
9.8% (37)
State:
9.4% (2,708)
Number of households with income > $200k:
Milford:
0.0% (0)
Delaware:
6.0% (1,737)
Aggregate household income in Milford in 2022: $28,539,689
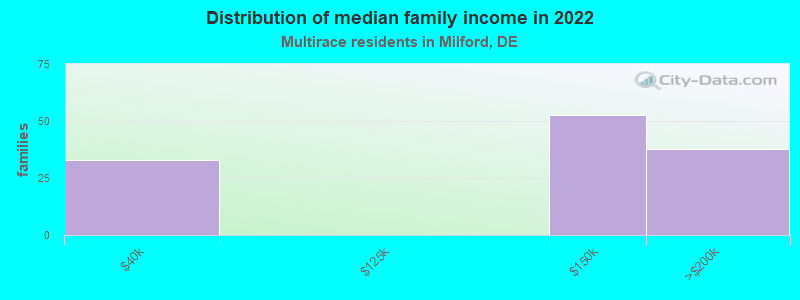
Median family income in Milford in 2022:
Milford:
$136,342
Delaware:
$72,735
Number of families with income $30k - 40k:
Milford:
26.7% (33)
Delaware:
5.2% (992)
Number of families with income $125k - 150k:
Milford:
42.8% (53)
Delaware:
7.4% (1,409)
Number of families with income $150k - 200k:
Milford:
30.5% (38)
State:
12.8% (2,427)
Median non-family income in Milford in 2022:
Milford:
$15,916
State:
$41,069
Change in median non-family income between 2000 and 2022:: -4.8%
Milford, Delaware:
-4.8%
State:
+52.5%
Median per capita income in Milford in 2022:
Milford:
$26,721
State:
$25,790
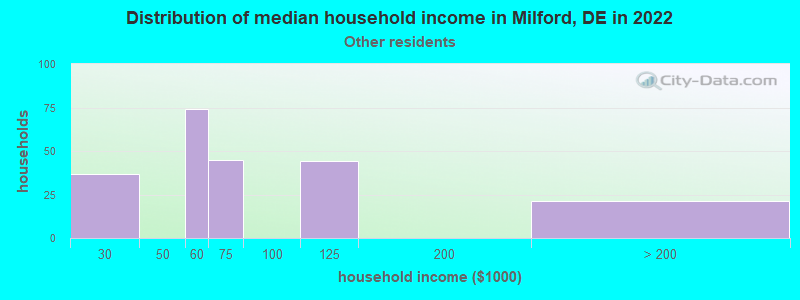
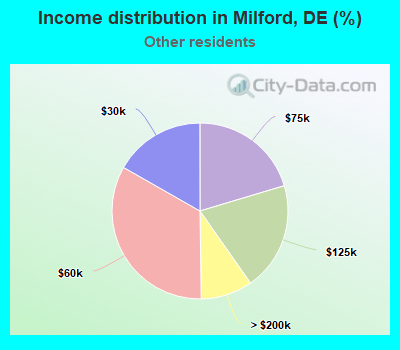
Income statistics for other residents
Median household income in Milford, DE in 2022:
Milford:
$54,555
State:
$76,255
Number of households with income < $10k:
Milford:
0.0% (0)
State:
1.0% (102)
Number of households with income $10k - 20k:
Milford:
0.0% (0)
State:
8.2% (879)
Number of households with income $20k - 30k:
Milford:
16.7% (37)
Delaware:
8.7% (928)
Number of households with income $30k - 40k:
Milford:
0.0% (0)
Delaware:
6.5% (700)
Number of households with income $40k - 50k:
Milford:
0.0% (0)
State:
2.8% (299)
Number of households with income $50k - 60k:
Milford:
33.5% (74)
State:
5.9% (635)
Number of households with income $60k - 75k:
Milford:
20.4% (45)
State:
14.3% (1,531)
Number of households with income $75k - 100k:
Milford:
0.0% (0)
Delaware:
16.8% (1,800)
Number of households with income $100k - 125k:
Milford:
19.9% (44)
State:
13.1% (1,399)
Number of households with income $125k - 150k:
Milford:
0.0% (0)
State:
9.8% (1,049)
Number of households with income $150k - 200k:
Milford:
0.0% (0)
State:
7.3% (783)
Number of households with income > $200k:
Milford:
9.5% (21)
Delaware:
5.5% (589)
Aggregate household income in Milford in 2022: $18,063,080
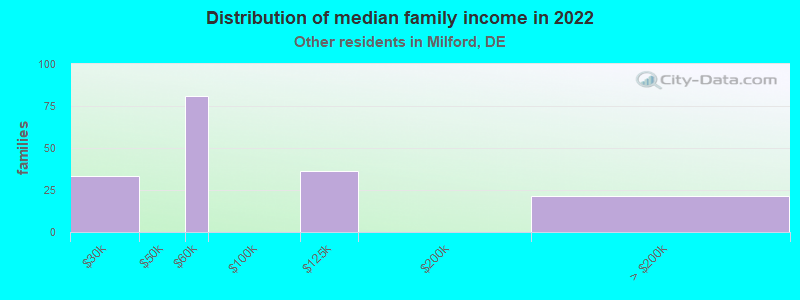
Median family income in Milford in 2022:
Milford:
$47,463
State:
$76,338
Number of families with income $20k - 30k:
Milford:
19.3% (33)
Delaware:
11.6% (999)
Number of families with income $50k - 60k:
Milford:
47.0% (81)
State:
6.3% (539)
Number of families with income $100k - 125k:
Milford:
21.1% (36)
State:
11.1% (949)
Number of families with income > $200k:
Milford:
12.6% (22)
State:
6.3% (540)
Median per capita income in Milford in 2022:
Milford:
$24,211
State:
$25,892
Discuss Milford, Delaware (DE) on our hugely popular Delaware forum.