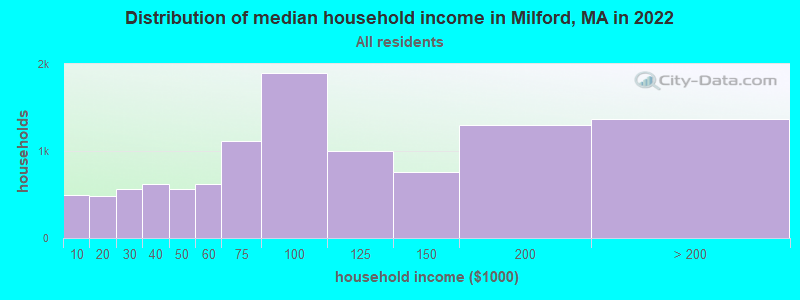
The median household income in Milford, MA in 2022 was $87,314, which was 8.2% less than the median annual income of $94,488 across the entire state of Massachusetts. Compared to the median income of $47,090 in 2000 this represents an increase of 46.1%. The per capita income in 2022 was $42,176, which means an increase of 45.9% compared to 2000 when it was $22,813.
Whole page based on the data from 2000 / 2022 when the population of Milford, Massachusetts was 24,230 / 27,698
Income statistics for all residents
Median household income in Milford, MA in 2022:
Milford:
$87,314
Massachusetts:
$94,488
Change in median household income between 2000 and 2022:
Milford, Massachusetts:
+85.4%
State:
+87.1%
Number of households with income < $10k:
Milford:
4.6% (496)
State:
5.2% (146,170)
Number of households with income $10k - 20k:
Milford:
4.4% (479)
Massachusetts:
6.4% (180,001)
Number of households with income $20k - 30k:
Milford:
5.2% (559)
Massachusetts:
5.6% (156,667)
Number of households with income $30k - 40k:
Milford:
5.8% (626)
State:
5.6% (157,168)
Number of households with income $40k - 50k:
Milford:
5.2% (561)
Massachusetts:
5.4% (151,455)
Number of households with income $50k - 60k:
Milford:
5.7% (617)
Massachusetts:
5.1% (142,726)
Number of households with income $60k - 75k:
Milford:
10.4% (1,115)
State:
7.6% (212,203)
Number of households with income $75k - 100k:
Milford:
17.6% (1,891)
State:
11.3% (317,064)
Number of households with income $100k - 125k:
Milford:
9.3% (1,000)
State:
9.7% (270,603)
Number of households with income $125k - 150k:
Milford:
7.1% (764)
Massachusetts:
8.0% (223,140)
Number of households with income $150k - 200k:
Milford:
12.0% (1,297)
State:
11.0% (308,695)
Number of households with income > $200k:
Milford:
12.7% (1,366)
State:
19.0% (531,884)
Aggregate household income in Milford in 2022: $1,160,881,452
Median family income in Milford in 2022:
Milford:
$101,799
State:
$120,263
Number of families with income < $10k:
Milford:
2.3% (166)
State:
2.9% (49,671)
Number of families with income $10k - 20k:
Milford:
2.7% (192)
State:
2.9% (50,542)
Number of families with income $20k - 30k:
Milford:
1.6% (114)
State:
3.9% (66,398)
Number of families with income $30k - 40k:
Milford:
7.2% (512)
Massachusetts:
4.5% (78,234)
Number of families with income $40k - 50k:
Milford:
1.1% (75)
State:
4.5% (77,656)
Number of families with income $50k - 60k:
Milford:
5.0% (357)
Massachusetts:
4.5% (77,928)
Number of families with income $60k - 75k:
Milford:
9.3% (661)
State:
7.0% (120,295)
Number of families with income $75k - 100k:
Milford:
18.9% (1,335)
State:
11.1% (192,172)
Number of families with income $100k - 125k:
Milford:
11.6% (825)
State:
10.6% (182,105)
Number of families with income $125k - 150k:
Milford:
9.2% (649)
State:
9.3% (159,566)
Number of families with income $150k - 200k:
Milford:
14.7% (1,043)
State:
13.4% (231,410)
Number of families with income > $200k:
Milford:
16.3% (1,153)
Massachusetts:
25.4% (438,378)
Median non-family income in Milford in 2022:
Milford:
$50,151
Massachusetts:
$55,979
Change in median non-family income between 2000 and 2022:
Milford, Massachusetts:
+87.3%
State:
+88.0%
Median per capita income in Milford in 2022:
Milford:
$42,177
Massachusetts:
$54,025
Change in median per capita income between 2000 and 2022:
Milford, Massachusetts:
+84.9%
State:
+108.2%
Income statistics for White residents
Median household income in Milford, MA in 2022:
Milford:
$95,852
State:
$101,391
Change in median household income between 2000 and 2022:
Milford, Massachusetts:
+99.9%
State:
+93.3%
Number of households with income < $10k:
Milford:
4.8% (396)
State:
4.4% (91,120)
Number of households with income $10k - 20k:
Milford:
5.1% (419)
State:
5.9% (122,055)
Number of households with income $20k - 30k:
Milford:
5.1% (416)
State:
5.1% (105,311)
Number of households with income $30k - 40k:
Milford:
4.5% (365)
Massachusetts:
5.3% (110,239)
Number of households with income $40k - 50k:
Milford:
5.4% (442)
State:
5.0% (104,636)
Number of households with income $50k - 60k:
Milford:
4.4% (356)
Massachusetts:
4.8% (99,486)
Number of households with income $60k - 75k:
Milford:
9.8% (802)
Massachusetts:
7.5% (155,124)
Number of households with income $75k - 100k:
Milford:
15.3% (1,248)
Massachusetts:
11.4% (236,252)
Number of households with income $100k - 125k:
Milford:
10.8% (883)
Massachusetts:
9.9% (204,731)
Number of households with income $125k - 150k:
Milford:
7.3% (596)
Massachusetts:
8.5% (175,324)
Number of households with income $150k - 200k:
Milford:
11.9% (973)
Massachusetts:
11.7% (242,980)
Number of households with income > $200k:
Milford:
15.7% (1,285)
State:
20.5% (425,966)
Aggregate household income in Milford in 2022: $943,220,351
Median family income in Milford in 2022:
Milford:
$113,970
Massachusetts:
$133,153
Number of families with income < $10k:
Milford:
1.4% (70)
State:
2.0% (25,038)
Number of families with income $10k - 20k:
Milford:
3.0% (153)
State:
2.1% (26,403)
Number of families with income $20k - 30k:
Milford:
0.7% (34)
State:
2.6% (32,525)
Number of families with income $30k - 40k:
Milford:
4.8% (244)
Massachusetts:
3.9% (48,079)
Number of families with income $40k - 50k:
Milford:
0.7% (36)
Massachusetts:
3.8% (46,908)
Number of families with income $50k - 60k:
Milford:
2.3% (115)
State:
3.8% (46,476)
Number of families with income $60k - 75k:
Milford:
8.8% (452)
State:
6.4% (79,040)
Number of families with income $75k - 100k:
Milford:
18.5% (943)
Massachusetts:
11.1% (137,395)
Number of families with income $100k - 125k:
Milford:
13.9% (711)
Massachusetts:
11.1% (136,771)
Number of families with income $125k - 150k:
Milford:
9.3% (474)
State:
10.0% (123,709)
Number of families with income $150k - 200k:
Milford:
15.3% (780)
State:
14.7% (181,602)
Number of families with income > $200k:
Milford:
21.5% (1,098)
State:
28.5% (351,887)
Median non-family income in Milford in 2022:
Milford:
$46,834
Massachusetts:
$59,323
Change in median non-family income between 2000 and 2022:
Milford, Massachusetts:
+77.2%
State:
+94.3%
Median per capita income in Milford in 2022:
Milford:
$48,187
Massachusetts:
$60,804
Change in median per capita income between 2000 and 2022:
Milford, Massachusetts:
+108.0%
State:
+118.7%
Income statistics for Black or African American residents
Median household income in Milford, MA in 2022:
Milford:
$65,334
State:
$63,189
Change in median household income between 2000 and 2022:
Milford, Massachusetts:
+57.4%
State:
+87.4%
Number of households with income < $10k:
Milford:
0.0% (0)
State:
9.1% (15,797)
Number of households with income $10k - 20k:
Milford:
10.7% (21)
State:
9.4% (16,267)
Number of households with income $20k - 30k:
Milford:
17.3% (34)
State:
7.8% (13,520)
Number of households with income $30k - 40k:
Milford:
0.0% (0)
Massachusetts:
8.3% (14,412)
Number of households with income $40k - 50k:
Milford:
0.0% (0)
Massachusetts:
7.9% (13,790)
Number of households with income $50k - 60k:
Milford:
0.0% (0)
State:
5.8% (10,041)
Number of households with income $60k - 75k:
Milford:
10.7% (21)
State:
8.5% (14,822)
Number of households with income $75k - 100k:
Milford:
38.1% (75)
State:
11.0% (19,122)
Number of households with income $100k - 125k:
Milford:
4.1% (8)
State:
8.4% (14,575)
Number of households with income $125k - 150k:
Milford:
0.0% (0)
Massachusetts:
6.0% (10,429)
Number of households with income $150k - 200k:
Milford:
19.3% (38)
Massachusetts:
7.2% (12,539)
Number of households with income > $200k:
Milford:
0.0% (0)
Massachusetts:
10.5% (18,185)
Aggregate household income in Milford in 2022: $17,250,215
Median family income in Milford in 2022:
Milford:
$68,190
Massachusetts:
$79,815
Number of families with income $10k - 20k:
Milford:
16.2% (31)
Massachusetts:
6.8% (7,412)
Number of families with income $20k - 30k:
Milford:
19.1% (37)
State:
6.6% (7,274)
Number of families with income $75k - 100k:
Milford:
39.2% (76)
State:
11.5% (12,654)
Number of families with income $100k - 125k:
Milford:
3.9% (8)
Massachusetts:
10.4% (11,452)
Number of families with income $150k - 200k:
Milford:
21.6% (42)
State:
9.3% (10,230)
Median per capita income in Milford in 2022:
Milford:
$23,090
State:
$33,524
Change in median per capita income between 2000 and 2022:
Milford, Massachusetts:
+33.6%
Massachusetts:
+109.4%
Income statistics for Asian residents
Median household income in Milford, MA in 2022:
Milford:
$182,410
Massachusetts:
$117,855
Change in median household income between 2000 and 2022:
Milford, Massachusetts:
+86.3%
State:
+129.9%
Number of households with income < $10k:
Milford:
3.7% (13)
Massachusetts:
6.8% (11,982)
Number of households with income $10k - 20k:
Milford:
0.0% (0)
Massachusetts:
4.8% (8,376)
Number of households with income $20k - 30k:
Milford:
0.0% (0)
Massachusetts:
3.7% (6,558)
Number of households with income $30k - 40k:
Milford:
0.0% (0)
State:
3.3% (5,748)
Number of households with income $40k - 50k:
Milford:
3.1% (11)
Massachusetts:
4.1% (7,192)
Number of households with income $50k - 60k:
Milford:
2.3% (8)
Massachusetts:
5.0% (8,734)
Number of households with income $60k - 75k:
Milford:
5.1% (18)
State:
5.8% (10,203)
Number of households with income $75k - 100k:
Milford:
12.5% (44)
State:
8.6% (15,154)
Number of households with income $100k - 125k:
Milford:
0.0% (0)
State:
10.8% (18,942)
Number of households with income $125k - 150k:
Milford:
4.5% (16)
State:
8.0% (14,037)
Number of households with income $150k - 200k:
Milford:
58.9% (208)
State:
12.5% (21,856)
Number of households with income > $200k:
Milford:
9.9% (35)
State:
26.6% (46,694)
Aggregate household income in Milford in 2022: $45,748,423
Median family income in Milford in 2022:
Milford:
$164,104
State:
$140,113
Number of families with income $40k - 50k:
Milford:
5.7% (11)
State:
3.9% (4,621)
Number of families with income $50k - 60k:
Milford:
4.6% (9)
Massachusetts:
3.9% (4,606)
Number of families with income $60k - 75k:
Milford:
8.6% (17)
State:
6.1% (7,105)
Number of families with income $75k - 100k:
Milford:
3.0% (6)
Massachusetts:
8.5% (10,022)
Number of families with income $125k - 150k:
Milford:
6.8% (13)
State:
8.6% (10,071)
Number of families with income $150k - 200k:
Milford:
53.4% (104)
State:
13.2% (15,478)
Number of families with income > $200k:
Milford:
17.9% (35)
State:
34.0% (39,856)
Median non-family income in Milford in 2022:
Milford:
$231,161
State:
$71,440
Median per capita income in Milford in 2022:
Milford:
$54,080
State:
$58,900
Change in median per capita income between 2000 and 2022:
Milford, Massachusetts:
+71.8%
Massachusetts:
+174.6%
Income statistics for Hispanic or Latino residents
Median household income in Milford, MA in 2022:
Milford:
$71,422
State:
$61,523
Number of households with income < $10k:
Milford:
3.6% (35)
State:
8.8% (25,307)
Number of households with income $10k - 20k:
Milford:
1.5% (14)
State:
10.0% (28,653)
Number of households with income $20k - 30k:
Milford:
7.1% (68)
Massachusetts:
8.8% (25,189)
Number of households with income $30k - 40k:
Milford:
7.8% (75)
Massachusetts:
7.2% (20,822)
Number of households with income $40k - 50k:
Milford:
2.0% (19)
State:
7.2% (20,817)
Number of households with income $50k - 60k:
Milford:
8.6% (83)
State:
6.5% (18,748)
Number of households with income $60k - 75k:
Milford:
22.5% (217)
Massachusetts:
8.8% (25,390)
Number of households with income $75k - 100k:
Milford:
24.4% (235)
Massachusetts:
12.0% (34,488)
Number of households with income $100k - 125k:
Milford:
9.1% (88)
State:
8.6% (24,599)
Number of households with income $125k - 150k:
Milford:
8.7% (84)
State:
6.2% (17,743)
Number of households with income $150k - 200k:
Milford:
0.6% (6)
State:
7.3% (21,017)
Number of households with income > $200k:
Milford:
4.1% (40)
State:
8.6% (24,606)
Aggregate household income in Milford in 2022: $75,846,602
Median family income in Milford in 2022:
Milford:
$86,839
State:
$66,072
Number of families with income $10k - 20k:
Milford:
0.4% (3)
Massachusetts:
6.0% (12,071)
Number of families with income $20k - 30k:
Milford:
3.6% (26)
State:
10.1% (20,376)
Number of families with income $30k - 40k:
Milford:
14.8% (105)
Massachusetts:
8.2% (16,470)
Number of families with income $50k - 60k:
Milford:
16.1% (114)
State:
7.3% (14,643)
Number of families with income $60k - 75k:
Milford:
11.8% (84)
Massachusetts:
10.6% (21,252)
Number of families with income $75k - 100k:
Milford:
20.0% (142)
Massachusetts:
12.0% (24,088)
Number of families with income $100k - 125k:
Milford:
11.4% (81)
Massachusetts:
8.9% (17,954)
Number of families with income $125k - 150k:
Milford:
15.7% (111)
Massachusetts:
6.9% (13,837)
Number of families with income $150k - 200k:
Milford:
1.3% (9)
State:
7.3% (14,683)
Number of families with income > $200k:
Milford:
4.8% (34)
State:
9.3% (18,741)
Median non-family income in Milford in 2022:
Milford:
$63,030
Massachusetts:
$37,563
Median per capita income in Milford in 2022:
Milford:
$24,752
Massachusetts:
$28,993
Change in median per capita income between 2000 and 2022:
Milford, Massachusetts:
+85.8%
State:
+142.4%
Income statistics for American Indian and Alaska Native residents
Number of households with income < $10k:
Milford:
0.0% (0)
Massachusetts:
6.6% (451)
Number of households with income $10k - 20k:
Milford:
0.0% (0)
State:
7.0% (476)
Number of households with income $20k - 30k:
Milford:
0.0% (0)
State:
2.8% (192)
Number of households with income $30k - 40k:
Milford:
0.0% (0)
State:
3.2% (218)
Number of households with income $40k - 50k:
Milford:
0.0% (0)
State:
2.9% (199)
Number of households with income $50k - 60k:
Milford:
84.1% (106)
State:
9.9% (677)
Number of households with income $60k - 75k:
Milford:
0.0% (0)
State:
11.5% (781)
Number of households with income $75k - 100k:
Milford:
0.0% (0)
State:
9.2% (629)
Number of households with income $100k - 125k:
Milford:
7.9% (10)
State:
6.0% (406)
Number of households with income $125k - 150k:
Milford:
0.0% (0)
State:
13.5% (921)
Number of households with income $150k - 200k:
Milford:
7.9% (10)
State:
12.6% (859)
Number of households with income > $200k:
Milford:
0.0% (0)
State:
14.7% (1,003)
Aggregate household income in Milford in 2022: $10,390,313
Median per capita income in Milford in 2022:
Milford:
$25,481
State:
$39,434
Change in median per capita income between 2000 and 2022:: -20.6%
Milford, Massachusetts:
-20.6%
Massachusetts:
+148.2%
Income statistics for Multirace residents
Median household income in Milford, MA in 2022:
Milford:
$71,325
State:
$71,552
Change in median household income between 2000 and 2022:
Milford, Massachusetts:
+122.2%
Massachusetts:
+109.0%
Number of households with income < $10k:
Milford:
0.0% (0)
State:
6.6% (15,127)
Number of households with income $10k - 20k:
Milford:
1.8% (22)
State:
9.2% (21,158)
Number of households with income $20k - 30k:
Milford:
0.0% (0)
State:
7.8% (18,016)
Number of households with income $30k - 40k:
Milford:
17.4% (207)
Massachusetts:
7.9% (18,260)
Number of households with income $40k - 50k:
Milford:
1.8% (22)
Massachusetts:
5.6% (13,027)
Number of households with income $50k - 60k:
Milford:
17.0% (203)
State:
5.6% (12,909)
Number of households with income $60k - 75k:
Milford:
10.1% (120)
State:
9.0% (20,800)
Number of households with income $75k - 100k:
Milford:
34.8% (415)
Massachusetts:
12.1% (27,875)
Number of households with income $100k - 125k:
Milford:
3.1% (37)
State:
8.1% (18,754)
Number of households with income $125k - 150k:
Milford:
7.0% (83)
State:
6.8% (15,621)
Number of households with income $150k - 200k:
Milford:
7.0% (83)
State:
9.4% (21,618)
Number of households with income > $200k:
Milford:
0.0% (0)
Massachusetts:
12.0% (27,592)
Aggregate household income in Milford in 2022: $77,662,209
Median family income in Milford in 2022:
Milford:
$70,592
Massachusetts:
$78,380
Number of families with income $30k - 40k:
Milford:
7.6% (65)
State:
8.2% (12,705)
Number of families with income $40k - 50k:
Milford:
4.2% (36)
State:
5.3% (8,255)
Number of families with income $50k - 60k:
Milford:
16.8% (143)
State:
6.7% (10,445)
Number of families with income $60k - 75k:
Milford:
11.0% (94)
State:
10.3% (16,064)
Number of families with income $75k - 100k:
Milford:
33.9% (289)
State:
12.1% (18,758)
Number of families with income $100k - 125k:
Milford:
4.3% (37)
State:
7.9% (12,321)
Number of families with income $125k - 150k:
Milford:
10.7% (91)
Massachusetts:
7.2% (11,128)
Number of families with income $150k - 200k:
Milford:
11.5% (98)
State:
10.3% (15,978)
Median non-family income in Milford in 2022:
Milford:
$40,440
State:
$42,253
Change in median non-family income between 2000 and 2022:: -32.9%
Milford, Massachusetts:
-32.9%
State:
+93.7%
Median per capita income in Milford in 2022:
Milford:
$25,515
State:
$34,029
Change in median per capita income between 2000 and 2022:
Milford, Massachusetts:
+96.3%
Massachusetts:
+132.1%
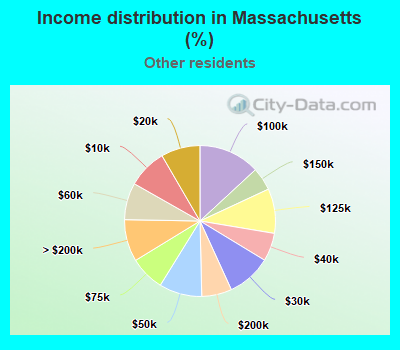
Income statistics for other residents
Median household income in Milford, MA in 2022:
Milford:
$73,820
Massachusetts:
$61,039
Number of households with income < $10k:
Milford:
2.7% (27)
Massachusetts:
8.4% (11,559)
Number of households with income $10k - 20k:
Milford:
0.0% (0)
State:
8.4% (11,499)
Number of households with income $20k - 30k:
Milford:
8.4% (85)
Massachusetts:
9.5% (13,070)
Number of households with income $30k - 40k:
Milford:
13.4% (135)
Massachusetts:
6.0% (8,291)
Number of households with income $40k - 50k:
Milford:
3.8% (38)
State:
9.2% (12,611)
Number of households with income $50k - 60k:
Milford:
9.0% (91)
State:
7.9% (10,879)
Number of households with income $60k - 75k:
Milford:
18.5% (186)
State:
7.5% (10,239)
Number of households with income $75k - 100k:
Milford:
26.2% (264)
State:
13.1% (18,032)
Number of households with income $100k - 125k:
Milford:
6.4% (65)
Massachusetts:
9.6% (13,141)
Number of households with income $125k - 150k:
Milford:
6.2% (63)
State:
5.0% (6,808)
Number of households with income $150k - 200k:
Milford:
1.8% (18)
Massachusetts:
6.4% (8,843)
Number of households with income > $200k:
Milford:
3.6% (36)
State:
9.0% (12,396)
Aggregate household income in Milford in 2022: $84,068,639
Median family income in Milford in 2022:
Milford:
$54,336
Massachusetts:
$66,840
Number of families with income < $10k:
Milford:
12.4% (117)
Massachusetts:
6.7% (6,769)
Number of families with income $20k - 30k:
Milford:
8.6% (81)
Massachusetts:
10.4% (10,595)
Number of families with income $30k - 40k:
Milford:
25.6% (242)
State:
7.0% (7,154)
Number of families with income $50k - 60k:
Milford:
9.1% (86)
State:
8.7% (8,850)
Number of families with income $60k - 75k:
Milford:
11.5% (108)
State:
8.5% (8,683)
Number of families with income $75k - 100k:
Milford:
13.0% (123)
State:
12.8% (12,997)
Number of families with income $100k - 125k:
Milford:
6.4% (60)
State:
9.3% (9,480)
Number of families with income $125k - 150k:
Milford:
6.6% (63)
State:
5.3% (5,373)
Number of families with income $150k - 200k:
Milford:
5.4% (51)
State:
7.5% (7,659)
Number of families with income > $200k:
Milford:
1.4% (13)
State:
10.0% (10,188)
Median non-family income in Milford in 2022:
Milford:
$164,386
State:
$36,127
Median per capita income in Milford in 2022:
Milford:
$30,213
Massachusetts:
$30,797
Discuss Milford, Massachusetts (MA) on our hugely popular Massachusetts forum.