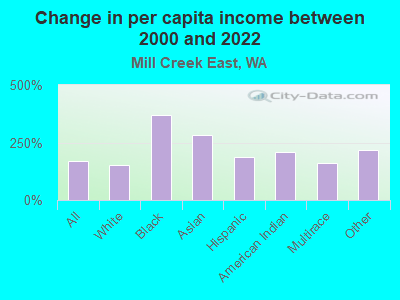
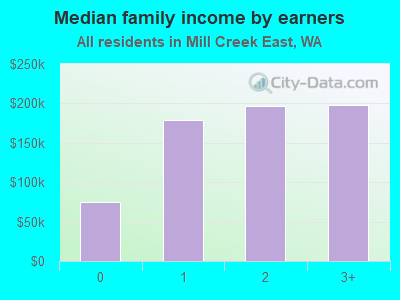
The median household income in Mill Creek East, WA in 2022 was $170,475, which was 46.4% greater than the median annual income of $91,306 across the entire state of Washington. Compared to the median income of $53,060 in 2000 this represents an increase of 68.9%. The per capita income in 2022 was $63,207, which means an increase of 63.0% compared to 2000 when it was $23,417.
Whole page based on the data from 2000 / 2022 when the population of Mill Creek East, Washington was 15,709 / 25,661
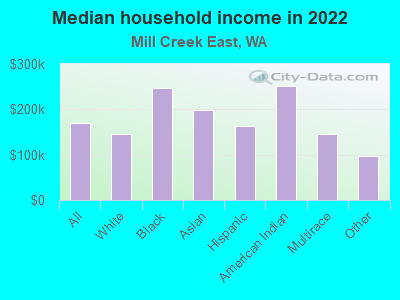
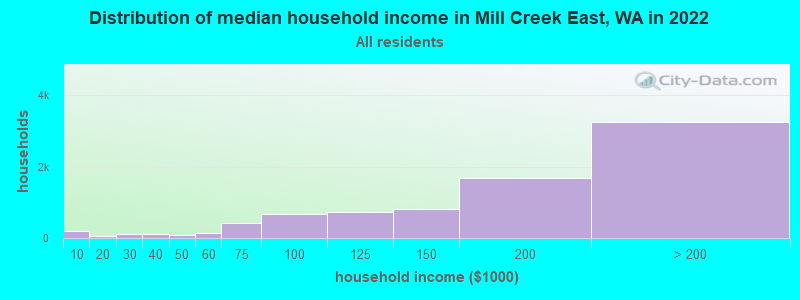
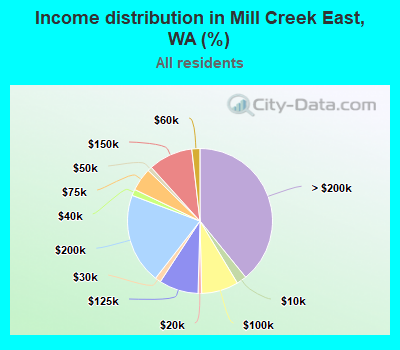
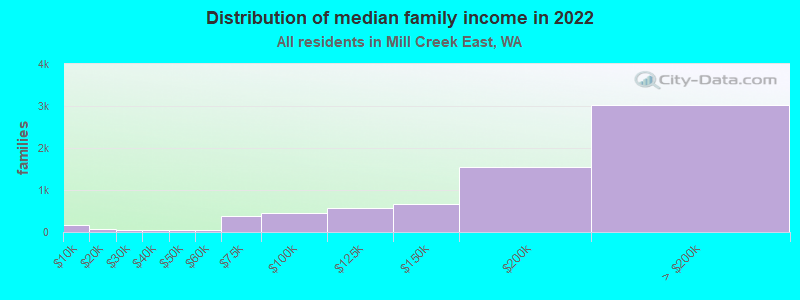
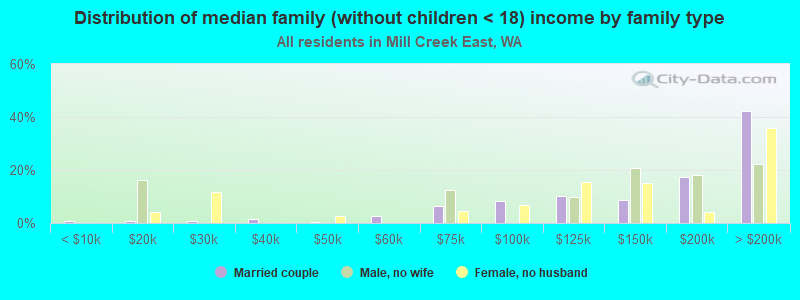
Income statistics for all residents
Median household income in Mill Creek East, WA in 2022:
Mill Creek East:
$170,476
State:
$91,306
Number of households with income < $10k:
Mill Creek East:
2.3% (187)
State:
4.5% (139,331)
Number of households with income $10k - 20k:
Mill Creek East:
0.8% (66)
State:
5.0% (154,508)
Number of households with income $20k - 30k:
Mill Creek East:
1.3% (109)
State:
5.4% (166,555)
Number of households with income $30k - 40k:
Mill Creek East:
1.4% (117)
State:
5.5% (170,324)
Number of households with income $40k - 50k:
Mill Creek East:
1.0% (81)
Washington:
6.0% (183,941)
Number of households with income $50k - 60k:
Mill Creek East:
1.8% (150)
Washington:
6.1% (187,395)
Number of households with income $60k - 75k:
Mill Creek East:
5.1% (427)
State:
8.7% (266,771)
Number of households with income $75k - 100k:
Mill Creek East:
8.2% (684)
Washington:
13.1% (404,672)
Number of households with income $100k - 125k:
Mill Creek East:
8.8% (729)
State:
11.0% (337,911)
Number of households with income $125k - 150k:
Mill Creek East:
9.9% (823)
State:
8.0% (244,934)
Number of households with income $150k - 200k:
Mill Creek East:
20.2% (1,679)
Washington:
10.5% (323,812)
Number of households with income > $200k:
Mill Creek East:
39.1% (3,250)
State:
16.2% (499,799)
Aggregate household income in Mill Creek East in 2022: $1,596,329,263
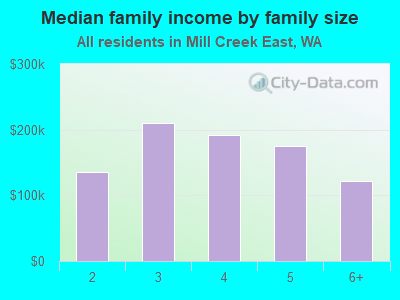
Median family income in Mill Creek East in 2022:
Mill Creek East:
$184,312
State:
$109,192
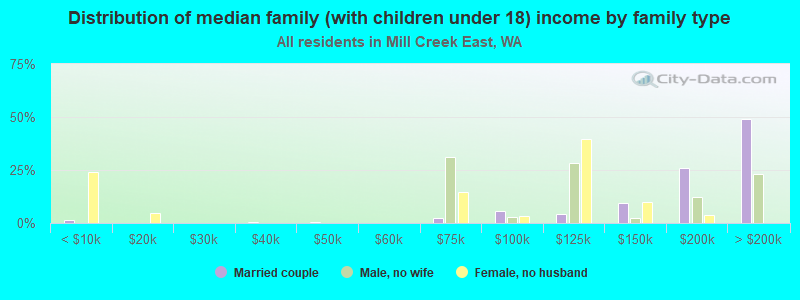
Number of families with income < $10k:
Mill Creek East:
2.2% (155)
State:
2.9% (55,953)
Number of families with income $10k - 20k:
Mill Creek East:
1.0% (71)
State:
2.6% (50,138)
Number of families with income $20k - 30k:
Mill Creek East:
0.5% (37)
State:
3.2% (61,974)
Number of families with income $30k - 40k:
Mill Creek East:
0.7% (49)
State:
4.1% (80,240)
Number of families with income $40k - 50k:
Mill Creek East:
0.5% (36)
State:
4.9% (94,310)
Number of families with income $50k - 60k:
Mill Creek East:
0.7% (49)
State:
5.3% (101,674)
Number of families with income $60k - 75k:
Mill Creek East:
5.3% (373)
State:
8.2% (158,348)
Number of families with income $75k - 100k:
Mill Creek East:
6.5% (458)
State:
13.8% (267,812)
Number of families with income $100k - 125k:
Mill Creek East:
8.3% (582)
State:
12.4% (240,213)
Number of families with income $125k - 150k:
Mill Creek East:
9.5% (670)
Washington:
9.3% (180,011)
Number of families with income $150k - 200k:
Mill Creek East:
21.8% (1,537)
State:
13.0% (250,874)
Number of families with income > $200k:
Mill Creek East:
43.0% (3,031)
State:
20.4% (393,898)
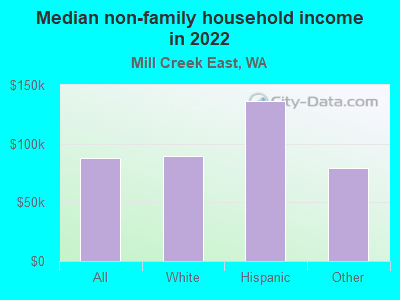
Median non-family income in Mill Creek East in 2022:
Mill Creek East:
$87,478
State:
$57,299
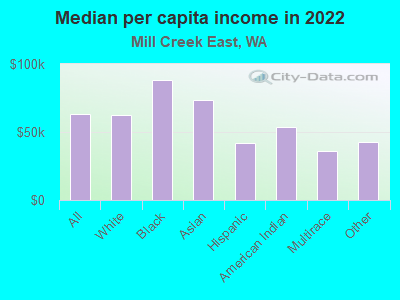
Median per capita income in Mill Creek East in 2022:
Mill Creek East:
$63,208
Washington:
$50,764
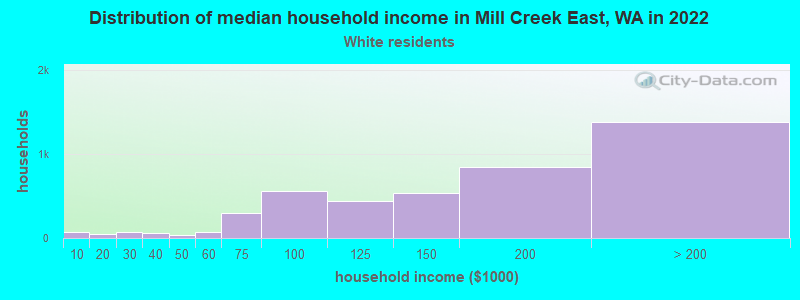
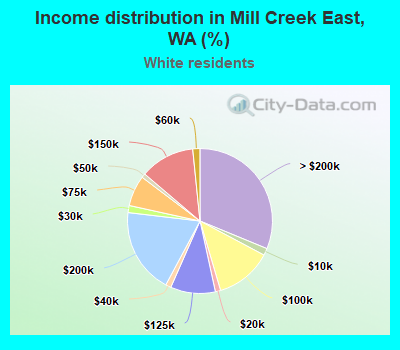
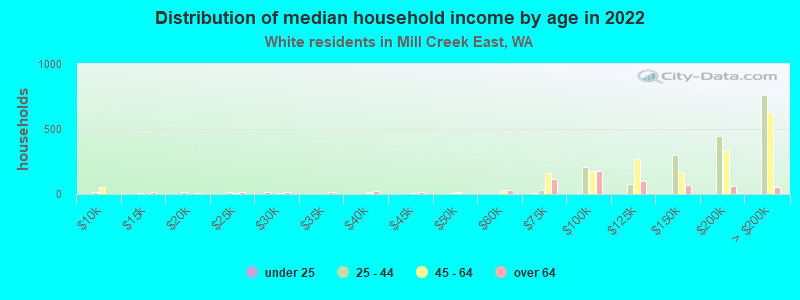
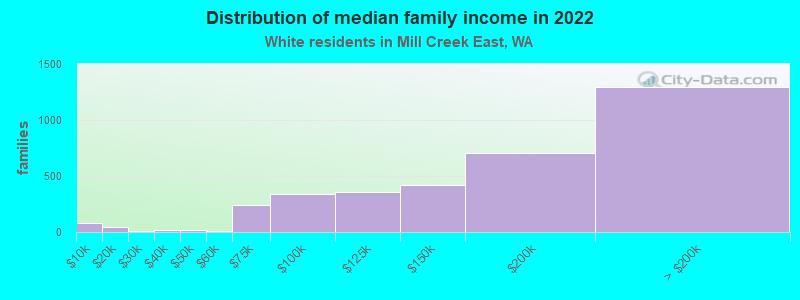
Income statistics for White residents
Median household income in Mill Creek East, WA in 2022:
Mill Creek East:
$145,190
Washington:
$91,916
Number of households with income < $10k:
Mill Creek East:
1.6% (69)
State:
4.3% (95,850)
Number of households with income $10k - 20k:
Mill Creek East:
1.2% (52)
State:
4.8% (106,421)
Number of households with income $20k - 30k:
Mill Creek East:
1.6% (70)
State:
5.5% (122,860)
Number of households with income $30k - 40k:
Mill Creek East:
1.2% (54)
State:
5.4% (119,627)
Number of households with income $40k - 50k:
Mill Creek East:
0.9% (41)
State:
5.9% (132,276)
Number of households with income $50k - 60k:
Mill Creek East:
1.6% (71)
State:
6.1% (136,212)
Number of households with income $60k - 75k:
Mill Creek East:
6.9% (304)
State:
8.8% (196,086)
Number of households with income $75k - 100k:
Mill Creek East:
12.6% (559)
State:
13.4% (299,192)
Number of households with income $100k - 125k:
Mill Creek East:
10.0% (444)
State:
11.3% (252,209)
Number of households with income $125k - 150k:
Mill Creek East:
12.2% (539)
State:
7.9% (175,962)
Number of households with income $150k - 200k:
Mill Creek East:
19.0% (843)
State:
10.7% (239,156)
Number of households with income > $200k:
Mill Creek East:
31.2% (1,384)
State:
16.1% (359,917)
Aggregate household income in Mill Creek East in 2022: $763,483,997
Median family income in Mill Creek East in 2022:
Mill Creek East:
$163,148
Washington:
$112,511
Number of families with income < $10k:
Mill Creek East:
2.4% (84)
State:
2.4% (33,676)
Number of families with income $10k - 20k:
Mill Creek East:
1.3% (46)
Washington:
2.0% (28,228)
Number of families with income $20k - 30k:
Mill Creek East:
0.1% (5)
State:
2.9% (39,288)
Number of families with income $30k - 40k:
Mill Creek East:
0.6% (21)
Washington:
3.6% (50,190)
Number of families with income $40k - 50k:
Mill Creek East:
0.6% (22)
Washington:
4.6% (63,009)
Number of families with income $50k - 60k:
Mill Creek East:
0.3% (10)
State:
5.0% (69,270)
Number of families with income $60k - 75k:
Mill Creek East:
6.8% (242)
State:
8.2% (112,369)
Number of families with income $75k - 100k:
Mill Creek East:
9.7% (343)
State:
14.1% (194,214)
Number of families with income $100k - 125k:
Mill Creek East:
10.1% (361)
State:
13.2% (182,184)
Number of families with income $125k - 150k:
Mill Creek East:
11.8% (419)
State:
9.5% (130,928)
Number of families with income $150k - 200k:
Mill Creek East:
19.8% (703)
State:
13.7% (188,621)
Number of families with income > $200k:
Mill Creek East:
36.5% (1,298)
State:
20.8% (285,982)
Median non-family income in Mill Creek East in 2022:
Mill Creek East:
$89,442
State:
$56,103
Median per capita income in Mill Creek East in 2022:
Mill Creek East:
$62,296
Washington:
$55,212
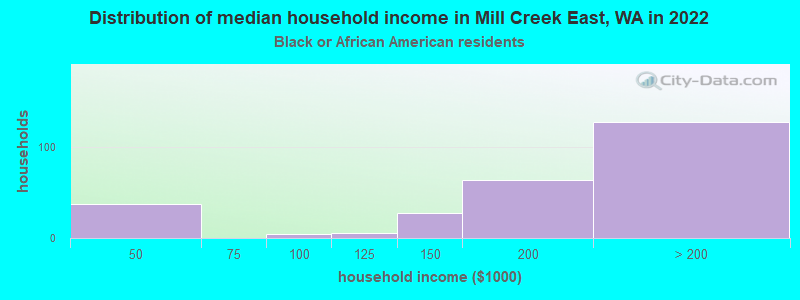
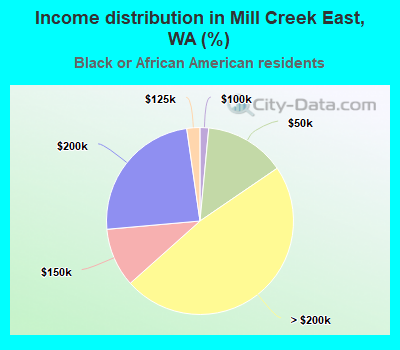
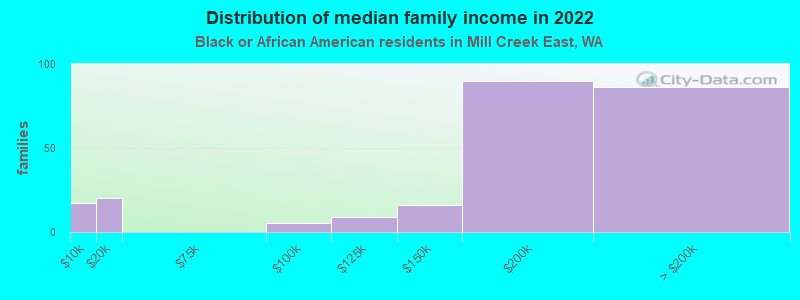
Income statistics for Black or African American residents
Median household income in Mill Creek East, WA in 2022:
Mill Creek East:
$246,158
Washington:
$68,202
Number of households with income < $10k:
Mill Creek East:
0.0% (0)
Washington:
7.2% (8,014)
Number of households with income $10k - 20k:
Mill Creek East:
0.0% (0)
State:
8.0% (8,904)
Number of households with income $20k - 30k:
Mill Creek East:
0.0% (0)
State:
7.4% (8,207)
Number of households with income $30k - 40k:
Mill Creek East:
0.0% (0)
State:
5.6% (6,220)
Number of households with income $40k - 50k:
Mill Creek East:
14.0% (37)
State:
9.5% (10,585)
Number of households with income $50k - 60k:
Mill Creek East:
0.0% (0)
Washington:
7.3% (8,078)
Number of households with income $60k - 75k:
Mill Creek East:
0.0% (0)
State:
8.7% (9,704)
Number of households with income $75k - 100k:
Mill Creek East:
1.5% (4)
State:
12.9% (14,315)
Number of households with income $100k - 125k:
Mill Creek East:
2.3% (6)
State:
7.7% (8,592)
Number of households with income $125k - 150k:
Mill Creek East:
10.2% (27)
State:
8.9% (9,840)
Number of households with income $150k - 200k:
Mill Creek East:
24.2% (64)
Washington:
7.6% (8,434)
Number of households with income > $200k:
Mill Creek East:
47.9% (127)
State:
9.1% (10,075)
Aggregate household income in Mill Creek East in 2022: $38,605,279
Median family income in Mill Creek East in 2022:
Mill Creek East:
$196,124
State:
$82,165
Number of families with income < $10k:
Mill Creek East:
7.2% (18)
Washington:
5.5% (3,709)
Number of families with income $10k - 20k:
Mill Creek East:
8.2% (20)
State:
7.4% (4,951)
Number of families with income $75k - 100k:
Mill Creek East:
2.2% (5)
State:
14.8% (9,876)
Number of families with income $100k - 125k:
Mill Creek East:
3.7% (9)
Washington:
9.0% (6,018)
Number of families with income $125k - 150k:
Mill Creek East:
6.6% (16)
State:
9.5% (6,348)
Number of families with income $150k - 200k:
Mill Creek East:
36.8% (90)
State:
8.6% (5,737)
Number of families with income > $200k:
Mill Creek East:
35.3% (86)
State:
12.0% (8,041)
Median per capita income in Mill Creek East in 2022:
Mill Creek East:
$88,137
State:
$38,209
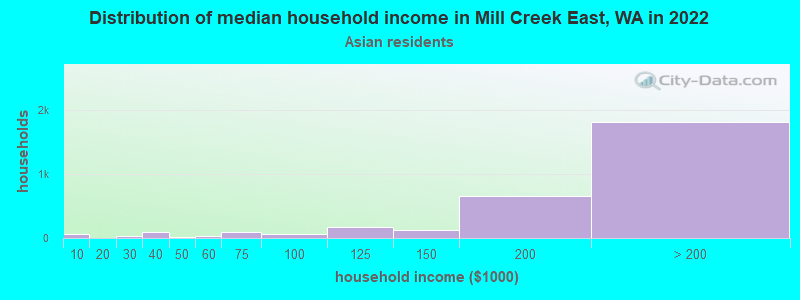
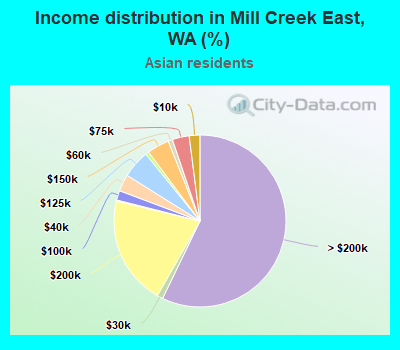
Income statistics for Asian residents
Median household income in Mill Creek East, WA in 2022:
Mill Creek East:
$199,299
State:
$125,692
Number of households with income < $10k:
Mill Creek East:
2.0% (64)
State:
4.9% (14,099)
Number of households with income $10k - 20k:
Mill Creek East:
0.2% (6)
State:
3.5% (9,873)
Number of households with income $20k - 30k:
Mill Creek East:
1.1% (35)
State:
2.9% (8,352)
Number of households with income $30k - 40k:
Mill Creek East:
3.2% (101)
State:
4.0% (11,415)
Number of households with income $40k - 50k:
Mill Creek East:
0.6% (20)
Washington:
4.0% (11,421)
Number of households with income $50k - 60k:
Mill Creek East:
0.8% (26)
State:
4.2% (12,100)
Number of households with income $60k - 75k:
Mill Creek East:
3.2% (101)
Washington:
6.3% (17,903)
Number of households with income $75k - 100k:
Mill Creek East:
1.8% (57)
State:
10.4% (29,663)
Number of households with income $100k - 125k:
Mill Creek East:
5.3% (167)
State:
9.4% (26,839)
Number of households with income $125k - 150k:
Mill Creek East:
4.2% (133)
State:
8.5% (24,200)
Number of households with income $150k - 200k:
Mill Creek East:
20.5% (651)
State:
12.6% (35,976)
Number of households with income > $200k:
Mill Creek East:
57.2% (1,816)
State:
29.2% (83,109)
Aggregate household income in Mill Creek East in 2022: $768,355,309
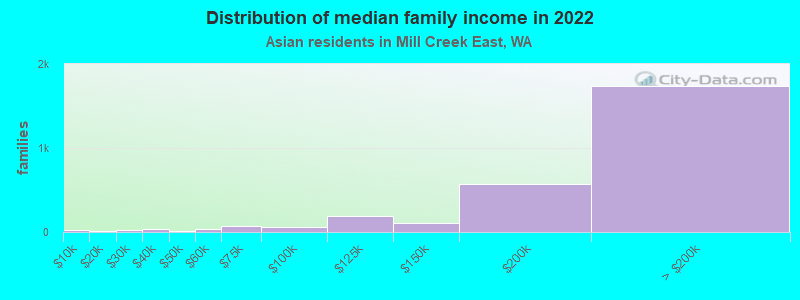
Median family income in Mill Creek East in 2022:
Mill Creek East:
$190,801
Washington:
$143,595
Number of families with income < $10k:
Mill Creek East:
1.0% (28)
Washington:
2.9% (5,479)
Number of families with income $10k - 20k:
Mill Creek East:
0.2% (7)
State:
2.2% (4,150)
Number of families with income $20k - 30k:
Mill Creek East:
1.0% (28)
State:
1.9% (3,558)
Number of families with income $30k - 40k:
Mill Creek East:
1.1% (31)
State:
3.1% (5,734)
Number of families with income $40k - 50k:
Mill Creek East:
0.5% (15)
Washington:
3.6% (6,707)
Number of families with income $50k - 60k:
Mill Creek East:
1.2% (35)
Washington:
4.1% (7,663)
Number of families with income $60k - 75k:
Mill Creek East:
2.3% (66)
State:
5.1% (9,490)
Number of families with income $75k - 100k:
Mill Creek East:
2.1% (62)
State:
11.7% (21,919)
Number of families with income $100k - 125k:
Mill Creek East:
6.5% (188)
State:
9.3% (17,280)
Number of families with income $125k - 150k:
Mill Creek East:
3.9% (113)
State:
8.4% (15,602)
Number of families with income $150k - 200k:
Mill Creek East:
19.8% (570)
State:
13.3% (24,789)
Number of families with income > $200k:
Mill Creek East:
60.3% (1,739)
State:
34.4% (64,250)
Median per capita income in Mill Creek East in 2022:
Mill Creek East:
$73,474
State:
$67,666
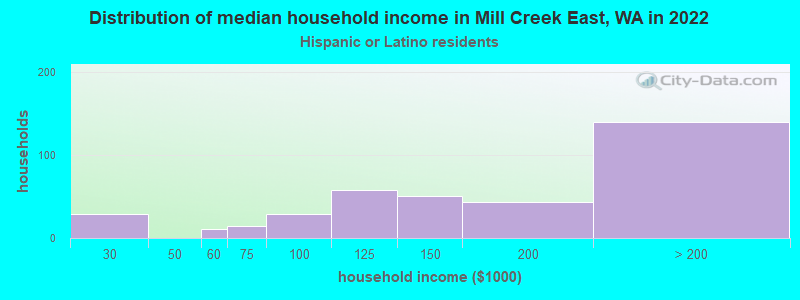
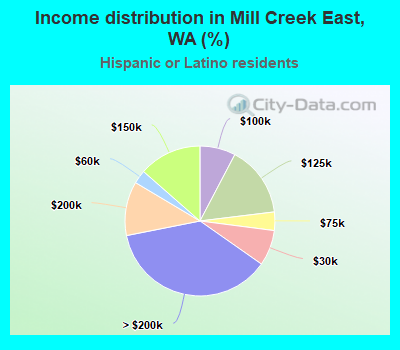
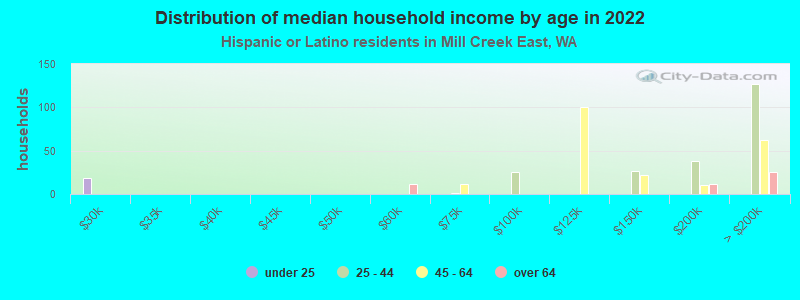
Income statistics for Hispanic or Latino residents
Median household income in Mill Creek East, WA in 2022:
Mill Creek East:
$162,292
Washington:
$74,770
Number of households with income < $10k:
Mill Creek East:
0.0% (0)
State:
4.9% (14,456)
Number of households with income $10k - 20k:
Mill Creek East:
0.0% (0)
State:
5.3% (15,449)
Number of households with income $20k - 30k:
Mill Creek East:
7.7% (29)
Washington:
6.8% (20,016)
Number of households with income $30k - 40k:
Mill Creek East:
0.0% (0)
State:
7.7% (22,548)
Number of households with income $40k - 50k:
Mill Creek East:
0.0% (0)
Washington:
7.3% (21,450)
Number of households with income $50k - 60k:
Mill Creek East:
2.9% (11)
Washington:
7.7% (22,744)
Number of households with income $60k - 75k:
Mill Creek East:
4.0% (15)
Washington:
10.5% (30,737)
Number of households with income $75k - 100k:
Mill Creek East:
7.7% (29)
Washington:
14.9% (43,843)
Number of households with income $100k - 125k:
Mill Creek East:
15.4% (58)
State:
11.1% (32,554)
Number of households with income $125k - 150k:
Mill Creek East:
13.5% (51)
State:
7.4% (21,624)
Number of households with income $150k - 200k:
Mill Creek East:
11.7% (44)
State:
7.3% (21,360)
Number of households with income > $200k:
Mill Creek East:
37.1% (140)
State:
9.2% (27,055)
Aggregate household income in Mill Creek East in 2022: $64,569,853
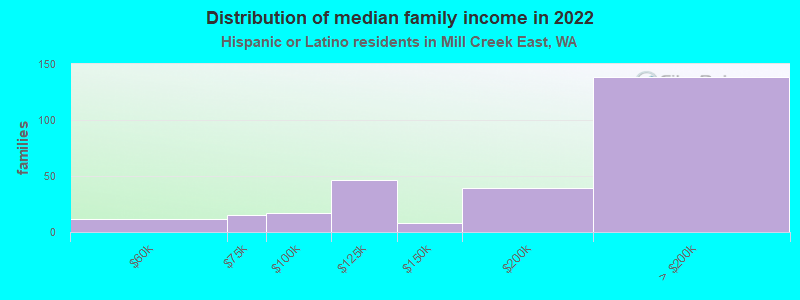
Median family income in Mill Creek East in 2022:
Mill Creek East:
$175,406
Washington:
$76,866
Number of families with income $50k - 60k:
Mill Creek East:
4.3% (12)
Washington:
7.9% (16,852)
Number of families with income $60k - 75k:
Mill Creek East:
5.6% (15)
Washington:
11.4% (24,342)
Number of families with income $75k - 100k:
Mill Creek East:
6.1% (17)
State:
14.4% (30,698)
Number of families with income $100k - 125k:
Mill Creek East:
16.6% (46)
State:
11.4% (24,331)
Number of families with income $125k - 150k:
Mill Creek East:
3.1% (8)
State:
7.5% (16,099)
Number of families with income $150k - 200k:
Mill Creek East:
14.3% (39)
State:
8.2% (17,551)
Number of families with income > $200k:
Mill Creek East:
50.0% (138)
Washington:
9.7% (20,653)
Median non-family income in Mill Creek East in 2022:
Mill Creek East:
$136,030
Washington:
$54,173
Median per capita income in Mill Creek East in 2022:
Mill Creek East:
$42,205
State:
$28,252
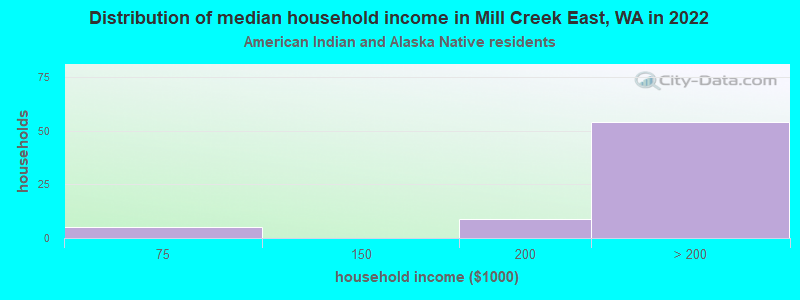
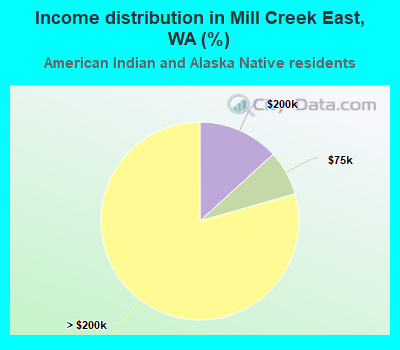
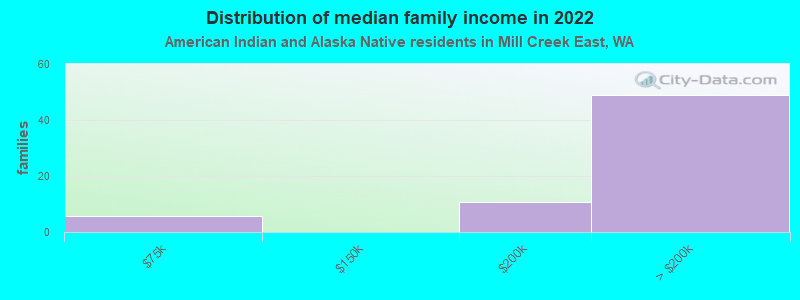
Income statistics for American Indian and Alaska Native residents
Median household income in Mill Creek East, WA in 2022:
Mill Creek East:
$251,131
State:
$71,255
Number of households with income < $10k:
Mill Creek East:
0.0% (0)
Washington:
5.9% (1,768)
Number of households with income $10k - 20k:
Mill Creek East:
0.0% (0)
State:
8.9% (2,694)
Number of households with income $20k - 30k:
Mill Creek East:
0.0% (0)
Washington:
8.0% (2,412)
Number of households with income $30k - 40k:
Mill Creek East:
0.0% (0)
Washington:
7.7% (2,327)
Number of households with income $40k - 50k:
Mill Creek East:
0.0% (0)
Washington:
5.8% (1,755)
Number of households with income $50k - 60k:
Mill Creek East:
0.0% (0)
Washington:
7.5% (2,259)
Number of households with income $60k - 75k:
Mill Creek East:
7.4% (5)
State:
8.8% (2,669)
Number of households with income $75k - 100k:
Mill Creek East:
0.0% (0)
State:
12.8% (3,861)
Number of households with income $100k - 125k:
Mill Creek East:
0.0% (0)
Washington:
12.0% (3,618)
Number of households with income $125k - 150k:
Mill Creek East:
0.0% (0)
State:
8.6% (2,580)
Number of households with income $150k - 200k:
Mill Creek East:
13.2% (9)
State:
5.9% (1,774)
Number of households with income > $200k:
Mill Creek East:
79.4% (54)
Washington:
8.1% (2,447)
Aggregate household income in Mill Creek East in 2022: $12,742,447
Median family income in Mill Creek East in 2022:
Mill Creek East:
$227,910
State:
$79,010
Number of families with income $60k - 75k:
Mill Creek East:
8.7% (6)
Washington:
10.5% (2,124)
Number of families with income $150k - 200k:
Mill Creek East:
16.3% (11)
State:
7.8% (1,584)
Number of families with income > $200k:
Mill Creek East:
74.9% (49)
State:
8.4% (1,698)
Median per capita income in Mill Creek East in 2022:
Mill Creek East:
$53,734
State:
$27,053
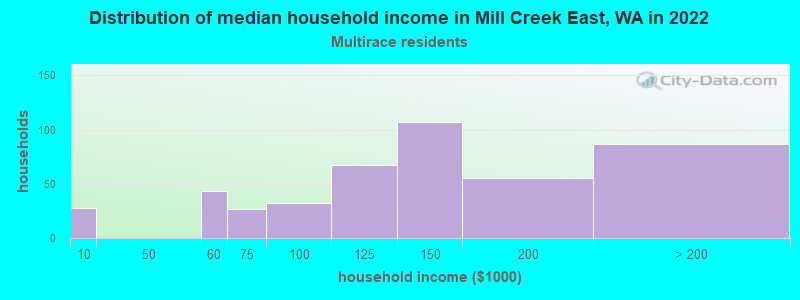
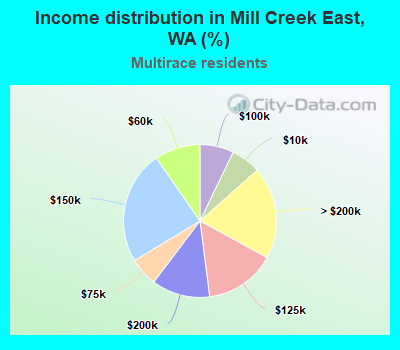
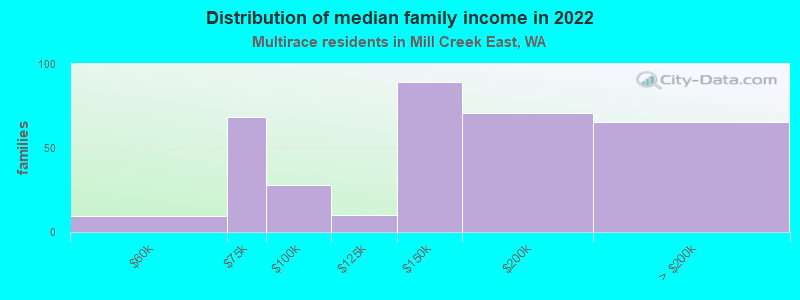
Income statistics for Multirace residents
Median household income in Mill Creek East, WA in 2022:
Mill Creek East:
$144,605
State:
$84,303
Number of households with income < $10k:
Mill Creek East:
6.3% (28)
Washington:
4.3% (12,040)
Number of households with income $10k - 20k:
Mill Creek East:
0.0% (0)
State:
6.6% (18,437)
Number of households with income $20k - 30k:
Mill Creek East:
0.0% (0)
State:
5.2% (14,559)
Number of households with income $30k - 40k:
Mill Creek East:
0.0% (0)
Washington:
6.7% (18,491)
Number of households with income $40k - 50k:
Mill Creek East:
0.0% (0)
State:
6.3% (17,459)
Number of households with income $50k - 60k:
Mill Creek East:
9.6% (43)
Washington:
6.9% (19,086)
Number of households with income $60k - 75k:
Mill Creek East:
6.1% (27)
Washington:
9.1% (25,310)
Number of households with income $75k - 100k:
Mill Creek East:
7.2% (32)
Washington:
13.5% (37,493)
Number of households with income $100k - 125k:
Mill Creek East:
15.0% (67)
State:
10.7% (29,626)
Number of households with income $125k - 150k:
Mill Creek East:
24.0% (107)
State:
8.6% (23,899)
Number of households with income $150k - 200k:
Mill Creek East:
12.3% (55)
Washington:
10.2% (28,214)
Number of households with income > $200k:
Mill Creek East:
19.5% (87)
State:
11.9% (32,947)
Aggregate household income in Mill Creek East in 2022: $69,530,800
Median family income in Mill Creek East in 2022:
Mill Creek East:
$157,631
State:
$95,629
Number of families with income $50k - 60k:
Mill Creek East:
2.7% (9)
Washington:
5.6% (9,922)
Number of families with income $60k - 75k:
Mill Creek East:
20.1% (69)
State:
9.7% (17,113)
Number of families with income $75k - 100k:
Mill Creek East:
8.1% (28)
Washington:
13.6% (23,984)
Number of families with income $100k - 125k:
Mill Creek East:
3.0% (10)
Washington:
10.4% (18,288)
Number of families with income $125k - 150k:
Mill Creek East:
26.2% (90)
Washington:
10.5% (18,481)
Number of families with income $150k - 200k:
Mill Creek East:
20.8% (71)
State:
11.9% (20,852)
Number of families with income > $200k:
Mill Creek East:
19.1% (65)
State:
14.4% (25,289)
Median per capita income in Mill Creek East in 2022:
Mill Creek East:
$35,829
State:
$32,496
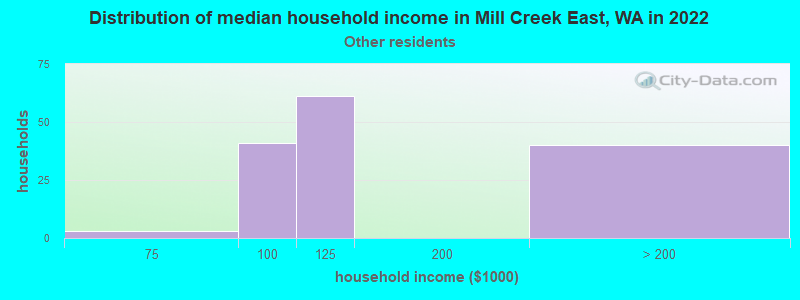
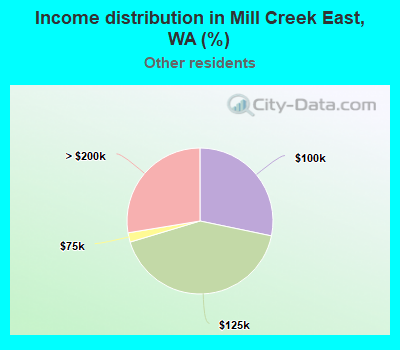
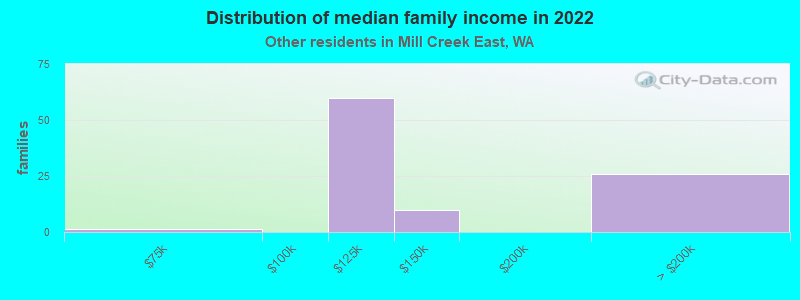
Income statistics for other residents
Median household income in Mill Creek East, WA in 2022:
Mill Creek East:
$96,316
State:
$69,545
Number of households with income < $10k:
Mill Creek East:
0.0% (0)
State:
5.3% (6,540)
Number of households with income $10k - 20k:
Mill Creek East:
0.0% (0)
Washington:
6.0% (7,385)
Number of households with income $20k - 30k:
Mill Creek East:
0.0% (0)
Washington:
7.5% (9,289)
Number of households with income $30k - 40k:
Mill Creek East:
0.0% (0)
State:
8.9% (11,015)
Number of households with income $40k - 50k:
Mill Creek East:
0.0% (0)
State:
7.6% (9,399)
Number of households with income $50k - 60k:
Mill Creek East:
0.0% (0)
Washington:
7.2% (8,867)
Number of households with income $60k - 75k:
Mill Creek East:
2.1% (3)
Washington:
10.5% (13,032)
Number of households with income $75k - 100k:
Mill Creek East:
28.3% (41)
State:
14.6% (18,007)
Number of households with income $100k - 125k:
Mill Creek East:
42.1% (61)
State:
12.2% (15,128)
Number of households with income $125k - 150k:
Mill Creek East:
0.0% (0)
State:
5.6% (6,950)
Number of households with income $150k - 200k:
Mill Creek East:
0.0% (0)
Washington:
7.1% (8,749)
Number of households with income > $200k:
Mill Creek East:
27.6% (40)
State:
7.5% (9,208)
Aggregate household income in Mill Creek East in 2022: $24,945,132
Median family income in Mill Creek East in 2022:
Mill Creek East:
$114,113
State:
$72,588
Number of families with income $60k - 75k:
Mill Creek East:
1.5% (1)
State:
10.3% (9,864)
Number of families with income $100k - 125k:
Mill Creek East:
61.8% (60)
State:
12.9% (12,298)
Number of families with income $125k - 150k:
Mill Creek East:
10.0% (10)
Washington:
6.0% (5,679)
Number of families with income > $200k:
Mill Creek East:
26.6% (26)
State:
7.1% (6,764)
Median non-family income in Mill Creek East in 2022:
Mill Creek East:
$79,409
State:
$44,777
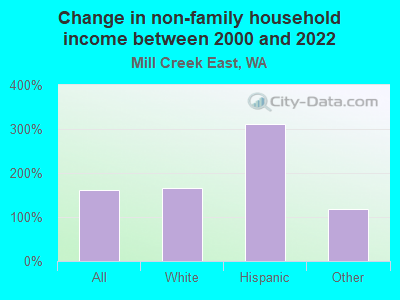
Change in median non-family income between 2000 and 2022:
Mill Creek East, Washington:
+119.5%
Washington:
+84.2%
Median per capita income in Mill Creek East in 2022:
Mill Creek East:
$42,967
State:
$27,542
Discuss Mill Creek East, Washington (WA) on our hugely popular Washington forum.