The median household income in Millerton, OK in 2022 was $40,113, which was 48.8% less than the median annual income of $59,673 across the entire state of Oklahoma. Compared to the median income of $19,375 in 2000 this represents an increase of 51.7%. The per capita income in 2022 was $24,549, which means an increase of 54.5% compared to 2000 when it was $11,168.
Whole page based on the data from 2000 / 2022 when the population of Millerton, Oklahoma was 359 / 213
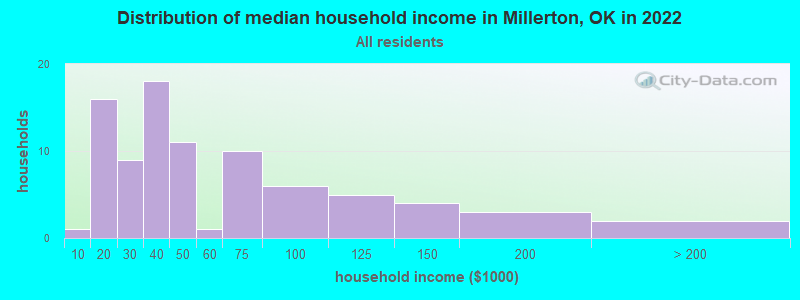
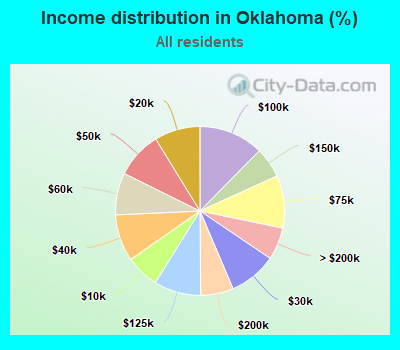
Income statistics for all residents
Median household income in Millerton, OK in 2022:
Millerton:
$40,113
State:
$59,673
Change in median household income between 2000 and 2022:
Millerton, Oklahoma:
+107.0%
State:
+78.7%
Number of households with income < $10k:
Millerton:
1.2% (1)
State:
6.4% (100,950)
Number of households with income $10k - 20k:
Millerton:
18.6% (16)
State:
8.8% (137,709)
Number of households with income $20k - 30k:
Millerton:
10.5% (9)
Oklahoma:
9.1% (143,661)
Number of households with income $30k - 40k:
Millerton:
20.9% (18)
State:
9.0% (141,098)
Number of households with income $40k - 50k:
Millerton:
12.8% (11)
Oklahoma:
8.9% (140,217)
Number of households with income $50k - 60k:
Millerton:
1.2% (1)
Oklahoma:
8.1% (126,882)
Number of households with income $60k - 75k:
Millerton:
11.6% (10)
Oklahoma:
10.0% (157,916)
Number of households with income $75k - 100k:
Millerton:
7.0% (6)
Oklahoma:
12.4% (195,015)
Number of households with income $100k - 125k:
Millerton:
5.8% (5)
Oklahoma:
9.0% (141,779)
Number of households with income $125k - 150k:
Millerton:
4.7% (4)
Oklahoma:
5.8% (91,594)
Number of households with income $150k - 200k:
Millerton:
3.5% (3)
State:
6.3% (98,589)
Number of households with income > $200k:
Millerton:
2.3% (2)
Oklahoma:
6.2% (97,770)
Aggregate household income in Millerton in 2022: $5,125,921
Median family income in Millerton in 2022:
Millerton:
$48,297
State:
$75,476
Number of families with income $10k - 20k:
Millerton:
5.1% (3)
State:
4.9% (49,571)
Number of families with income $20k - 30k:
Millerton:
3.4% (2)
State:
6.3% (64,367)
Number of families with income $30k - 40k:
Millerton:
24.1% (14)
Oklahoma:
7.5% (76,467)
Number of families with income $40k - 50k:
Millerton:
19.6% (12)
Oklahoma:
8.3% (84,578)
Number of families with income $50k - 60k:
Millerton:
3.6% (2)
State:
7.8% (79,642)
Number of families with income $60k - 75k:
Millerton:
12.1% (7)
State:
10.6% (108,169)
Number of families with income $75k - 100k:
Millerton:
12.0% (7)
Oklahoma:
14.6% (148,857)
Number of families with income $100k - 125k:
Millerton:
6.8% (4)
Oklahoma:
11.2% (113,480)
Number of families with income $125k - 150k:
Millerton:
6.5% (4)
State:
7.6% (77,253)
Number of families with income $150k - 200k:
Millerton:
3.4% (2)
State:
8.4% (85,947)
Number of families with income > $200k:
Millerton:
3.4% (2)
State:
8.5% (86,531)
Median non-family income in Millerton in 2022:
Millerton:
$18,018
State:
$35,419
Change in median non-family income between 2000 and 2022:
Millerton, Oklahoma:
+71.6%
State:
+83.2%
Median per capita income in Millerton in 2022:
Millerton:
$24,549
Oklahoma:
$32,930
Change in median per capita income between 2000 and 2022:
Millerton, Oklahoma:
+119.8%
Oklahoma:
+86.6%
Income statistics for White residents
Median household income in Millerton, OK in 2022:
Millerton:
$38,243
State:
$63,444
Change in median household income between 2000 and 2022:
Millerton, Oklahoma:
+102.6%
State:
+79.3%
Number of households with income < $10k:
Millerton:
1.5% (1)
State:
5.5% (60,994)
Number of households with income $10k - 20k:
Millerton:
19.7% (13)
State:
8.2% (91,263)
Number of households with income $20k - 30k:
Millerton:
7.6% (5)
Oklahoma:
8.7% (96,988)
Number of households with income $30k - 40k:
Millerton:
24.2% (16)
Oklahoma:
8.4% (93,121)
Number of households with income $40k - 50k:
Millerton:
10.6% (7)
Oklahoma:
8.6% (95,446)
Number of households with income $50k - 60k:
Millerton:
1.5% (1)
Oklahoma:
7.9% (87,723)
Number of households with income $60k - 75k:
Millerton:
13.6% (9)
Oklahoma:
9.9% (109,955)
Number of households with income $75k - 100k:
Millerton:
6.1% (4)
State:
12.9% (143,880)
Number of households with income $100k - 125k:
Millerton:
7.6% (5)
State:
9.7% (107,851)
Number of households with income $125k - 150k:
Millerton:
4.5% (3)
Oklahoma:
6.3% (69,802)
Number of households with income $150k - 200k:
Millerton:
0.0% (0)
State:
6.9% (76,863)
Number of households with income > $200k:
Millerton:
3.0% (2)
State:
7.0% (78,099)
Aggregate household income in Millerton in 2022: $3,700,662
Median family income in Millerton in 2022:
Millerton:
$50,662
Oklahoma:
$82,251
Number of families with income $10k - 20k:
Millerton:
2.2% (1)
Oklahoma:
4.1% (29,440)
Number of families with income $30k - 40k:
Millerton:
29.0% (12)
State:
6.5% (46,540)
Number of families with income $40k - 50k:
Millerton:
17.2% (7)
Oklahoma:
7.7% (55,082)
Number of families with income $50k - 60k:
Millerton:
4.9% (2)
Oklahoma:
7.5% (53,408)
Number of families with income $60k - 75k:
Millerton:
14.1% (6)
Oklahoma:
10.4% (74,624)
Number of families with income $75k - 100k:
Millerton:
11.9% (5)
State:
15.3% (109,679)
Number of families with income $100k - 125k:
Millerton:
9.4% (4)
Oklahoma:
12.0% (86,208)
Number of families with income $125k - 150k:
Millerton:
6.6% (3)
Oklahoma:
8.3% (59,328)
Number of families with income > $200k:
Millerton:
4.7% (2)
State:
9.7% (69,551)
Median non-family income in Millerton in 2022:
Millerton:
$15,434
State:
$36,941
Change in median non-family income between 2000 and 2022:
Millerton, Oklahoma:
+54.3%
State:
+83.5%
Median per capita income in Millerton in 2022:
Millerton:
$24,062
State:
$37,390
Change in median per capita income between 2000 and 2022:
Millerton, Oklahoma:
+119.8%
State:
+92.4%
Income statistics for Black or African American residents
Aggregate household income in Millerton in 2022: $450,967
Median per capita income in Millerton in 2022:
Millerton:
$40,685
State:
$24,741
Change in median per capita income between 2000 and 2022:
Millerton, Oklahoma:
+120.9%
State:
+98.7%
Income statistics for Hispanic or Latino residents
Median per capita income in Millerton in 2022:
Millerton:
$4,504
State:
$19,473
Income statistics for American Indian and Alaska Native residents
Aggregate household income in Millerton in 2022: $700,267
Median per capita income in Millerton in 2022:
Millerton:
$35,995
Oklahoma:
$25,549
Income statistics for Multirace residents
Median household income in Millerton, OK in 2022:
Millerton:
$36,674
State:
$53,626
Change in median household income between 2000 and 2022:
Millerton, Oklahoma:
+46.7%
Oklahoma:
+81.7%
Aggregate household income in Millerton in 2022: $534,132
Median family income in Millerton in 2022:
Millerton:
$53,903
State:
$62,946
Median per capita income in Millerton in 2022:
Millerton:
$18,731
State:
$23,085
Change in median per capita income between 2000 and 2022:
Millerton, Oklahoma:
+103.6%
State:
+93.8%
Discuss Millerton, Oklahoma (OK) on our hugely popular Oklahoma forum.