Monterey, Massachusetts (MA) income map, earnings map, and wages data
The median household income in Monterey, MA in 2022 was $94,508, which was about the same as the median annual income of $94,488 across the entire state of Massachusetts. Compared to the median income of $49,750 in 2000 this represents an increase of 47.4%. The per capita income in 2022 was $69,514, which means an increase of 55.4% compared to 2000 when it was $30,992.
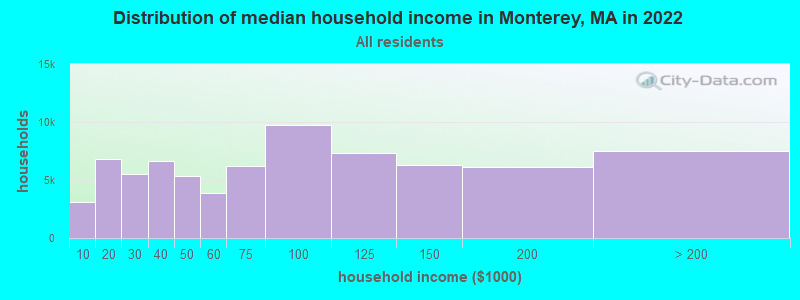
Income statistics for all residents
Median household income in Monterey, MA in 2022:| Monterey: | $94,508 |
| Massachusetts: | $94,488 |
Change in median household income between 2000 and 2022:| Monterey, Massachusetts: | +90.0% |
| State: | +87.1% |
Number of households with income < $10k:| Monterey: | 4.1% (3,067) |
| State: | 5.2% (146,170) |
Number of households with income $10k - 20k:| Monterey: | 9.2% (6,830) |
| Massachusetts: | 6.4% (180,001) |
Number of households with income $20k - 30k:| Monterey: | 7.5% (5,548) |
| Massachusetts: | 5.6% (156,667) |
Number of households with income $30k - 40k:| Monterey: | 8.9% (6,613) |
| State: | 5.6% (157,168) |
Number of households with income $40k - 50k:| Monterey: | 7.1% (5,305) |
| State: | 5.4% (151,455) |
Number of households with income $50k - 60k:| Monterey: | 5.2% (3,892) |
| State: | 5.1% (142,726) |
Number of households with income $60k - 75k:| Monterey: | 8.3% (6,182) |
| State: | 7.6% (212,203) |
Number of households with income $75k - 100k:| Monterey: | 13.1% (9,713) |
| State: | 11.3% (317,064) |
Number of households with income $100k - 125k:| Monterey: | 9.8% (7,310) |
| Massachusetts: | 9.7% (270,603) |
Number of households with income $125k - 150k:| Monterey: | 8.5% (6,297) |
| Massachusetts: | 8.0% (223,140) |
Number of households with income $150k - 200k:| Monterey: | 8.2% (6,107) |
| State: | 11.0% (308,695) |
Number of households with income > $200k:| Monterey: | 10.1% (7,507) |
| Massachusetts: | 19.0% (531,884) |
Aggregate household income in Monterey in 2022: $82,774,947
Median family income in Monterey in 2022:| Monterey: | $114,095 |
| Massachusetts: | $120,263 |
Median non-family income in Monterey in 2022:| Monterey: | $56,856 |
| State: | $55,979 |
Change in median non-family income between 2000 and 2022:| Monterey, Massachusetts: | +95.6% |
| Massachusetts: | +88.0% |
Median per capita income in Monterey in 2022:| Monterey: | $69,515 |
| State: | $54,025 |
Change in median per capita income between 2000 and 2022:| Monterey, Massachusetts: | +124.3% |
| State: | +108.2% |
Income statistics for White residents
Median household income in Monterey, MA in 2022:| Monterey: | $96,650 |
| Massachusetts: | $101,391 |
Change in median household income between 2000 and 2022:| Monterey, Massachusetts: | +92.7% |
| State: | +93.3% |
Number of households with income < $10k:| Monterey: | 4.3% (2,922) |
| State: | 4.4% (91,120) |
Number of households with income $10k - 20k:| Monterey: | 8.5% (5,691) |
| Massachusetts: | 5.9% (122,055) |
Number of households with income $20k - 30k:| Monterey: | 8.1% (5,438) |
| Massachusetts: | 5.1% (105,311) |
Number of households with income $30k - 40k:| Monterey: | 8.2% (5,498) |
| State: | 5.3% (110,239) |
Number of households with income $40k - 50k:| Monterey: | 7.0% (4,729) |
| Massachusetts: | 5.0% (104,636) |
Number of households with income $50k - 60k:| Monterey: | 4.5% (3,007) |
| State: | 4.8% (99,486) |
Number of households with income $60k - 75k:| Monterey: | 8.9% (5,974) |
| State: | 7.5% (155,124) |
Number of households with income $75k - 100k:| Monterey: | 13.0% (8,729) |
| Massachusetts: | 11.4% (236,252) |
Number of households with income $100k - 125k:| Monterey: | 9.6% (6,456) |
| Massachusetts: | 9.9% (204,731) |
Number of households with income $125k - 150k:| Monterey: | 8.6% (5,771) |
| State: | 8.5% (175,324) |
Number of households with income $150k - 200k:| Monterey: | 8.8% (5,940) |
| State: | 11.7% (242,980) |
Number of households with income > $200k:| Monterey: | 10.6% (7,165) |
| State: | 20.5% (425,966) |
Aggregate household income in Monterey in 2022: $75,805,369
Median family income in Monterey in 2022:| Monterey: | $117,292 |
| Massachusetts: | $133,153 |
Number of families with income < $10k:| Monterey: | 1.0% (3) |
| State: | 2.0% (25,038) |
Number of families with income $10k - 20k:| Monterey: | 1.4% (5) |
| Massachusetts: | 2.1% (26,403) |
Number of families with income $20k - 30k:| Monterey: | 2.5% (8) |
| State: | 2.6% (32,525) |
Number of families with income $30k - 40k:| Monterey: | 3.9% (13) |
| State: | 3.9% (48,079) |
Number of families with income $40k - 50k:| Monterey: | 2.7% (9) |
| State: | 3.8% (46,908) |
Number of families with income $50k - 60k:| Monterey: | 3.0% (10) |
| State: | 3.8% (46,476) |
Number of families with income $60k - 75k:| Monterey: | 7.7% (26) |
| State: | 6.4% (79,040) |
Number of families with income $75k - 100k:| Monterey: | 7.2% (24) |
| State: | 11.1% (137,395) |
Number of families with income $100k - 125k:| Monterey: | 6.7% (22) |
| Massachusetts: | 11.1% (136,771) |
Number of families with income $125k - 150k:| Monterey: | 8.6% (29) |
| State: | 10.0% (123,709) |
Number of families with income $150k - 200k:| Monterey: | 21.7% (73) |
| State: | 14.7% (181,602) |
Number of families with income > $200k:| Monterey: | 33.6% (112) |
| State: | 28.5% (351,887) |
Median non-family income in Monterey in 2022:| Monterey: | $56,769 |
| State: | $59,323 |
Change in median non-family income between 2000 and 2022:| Monterey, Massachusetts: | +95.3% |
| Massachusetts: | +94.3% |
Median per capita income in Monterey in 2022:| Monterey: | $71,393 |
| State: | $60,804 |
Change in median per capita income between 2000 and 2022:| Monterey, Massachusetts: | +128.4% |
| State: | +118.7% |
Income statistics for Black or African American residents
Median household income in Monterey, MA in 2022:| Monterey: | $37,618 |
| Massachusetts: | $63,189 |
Change in median household income between 2000 and 2022:| Monterey, Massachusetts: | +43.3% |
| State: | +87.4% |
Number of households with income < $10k:| Monterey: | 9.1% (12,295) |
| State: | 9.1% (15,797) |
Number of households with income $10k - 20k:| Monterey: | 9.4% (12,661) |
| Massachusetts: | 9.4% (16,267) |
Number of households with income $20k - 30k:| Monterey: | 7.8% (10,523) |
| State: | 7.8% (13,520) |
Number of households with income $30k - 40k:| Monterey: | 8.3% (11,217) |
| Massachusetts: | 8.3% (14,412) |
Number of households with income $40k - 50k:| Monterey: | 7.9% (10,733) |
| State: | 7.9% (13,790) |
Number of households with income $50k - 60k:| Monterey: | 5.8% (7,815) |
| Massachusetts: | 5.8% (10,041) |
Number of households with income $60k - 75k:| Monterey: | 8.5% (11,536) |
| State: | 8.5% (14,822) |
Number of households with income $75k - 100k:| Monterey: | 11.0% (14,883) |
| Massachusetts: | 11.0% (19,122) |
Number of households with income $100k - 125k:| Monterey: | 8.4% (11,344) |
| State: | 8.4% (14,575) |
Number of households with income $125k - 150k:| Monterey: | 6.0% (8,117) |
| State: | 6.0% (10,429) |
Number of households with income $150k - 200k:| Monterey: | 7.2% (9,759) |
| Massachusetts: | 7.2% (12,539) |
Number of households with income > $200k:| Monterey: | 10.5% (14,154) |
| State: | 10.5% (18,185) |
Aggregate household income in Monterey in 2022: $240,495
Median family income in Monterey in 2022:| Monterey: | $50,681 |
| State: | $79,815 |
Median per capita income in Monterey in 2022:| Monterey: | $20,209 |
| Massachusetts: | $33,524 |
Income statistics for Asian residents
Median household income in Monterey, MA in 2022:| Monterey: | $147,330 |
| Massachusetts: | $117,855 |
Change in median household income between 2000 and 2022:| Monterey, Massachusetts: | +83.0% |
| State: | +129.9% |
Number of households with income < $10k:| Monterey: | 6.8% (18,809) |
| State: | 6.8% (11,982) |
Number of households with income $10k - 20k:| Monterey: | 4.8% (13,149) |
| Massachusetts: | 4.8% (8,376) |
Number of households with income $20k - 30k:| Monterey: | 3.7% (10,295) |
| Massachusetts: | 3.7% (6,558) |
Number of households with income $30k - 40k:| Monterey: | 3.3% (9,023) |
| State: | 3.3% (5,748) |
Number of households with income $40k - 50k:| Monterey: | 4.1% (11,290) |
| State: | 4.1% (7,192) |
Number of households with income $50k - 60k:| Monterey: | 5.0% (13,711) |
| State: | 5.0% (8,734) |
Number of households with income $60k - 75k:| Monterey: | 5.8% (16,017) |
| Massachusetts: | 5.8% (10,203) |
Number of households with income $75k - 100k:| Monterey: | 8.6% (23,789) |
| State: | 8.6% (15,154) |
Number of households with income $100k - 125k:| Monterey: | 10.8% (29,735) |
| State: | 10.8% (18,942) |
Number of households with income $125k - 150k:| Monterey: | 8.0% (22,035) |
| Massachusetts: | 8.0% (14,037) |
Number of households with income $150k - 200k:| Monterey: | 12.5% (34,309) |
| State: | 12.5% (21,856) |
Number of households with income > $200k:| Monterey: | 26.6% (73,300) |
| State: | 26.6% (46,694) |
Aggregate household income in Monterey in 2022: $676,757
Median non-family income in Monterey in 2022:| Monterey: | $183,515 |
| State: | $71,440 |
Change in median non-family income between 2000 and 2022:| Monterey, Massachusetts: | +128.0% |
| State: | +128.0% |
Median per capita income in Monterey in 2022:| Monterey: | $104,537 |
| Massachusetts: | $58,900 |
Income statistics for Hispanic or Latino residents
Median household income in Monterey, MA in 2022:| Monterey: | $85,758 |
| Massachusetts: | $61,523 |
Change in median household income between 2000 and 2022:| Monterey, Massachusetts: | +69.4% |
| State: | +125.4% |
Number of households with income < $10k:| Monterey: | 8.8% (46,929) |
| State: | 8.8% (25,307) |
Number of households with income $10k - 20k:| Monterey: | 10.0% (53,134) |
| State: | 10.0% (28,653) |
Number of households with income $20k - 30k:| Monterey: | 8.8% (46,711) |
| State: | 8.8% (25,189) |
Number of households with income $30k - 40k:| Monterey: | 7.2% (38,612) |
| Massachusetts: | 7.2% (20,822) |
Number of households with income $40k - 50k:| Monterey: | 7.2% (38,603) |
| Massachusetts: | 7.2% (20,817) |
Number of households with income $50k - 60k:| Monterey: | 6.5% (34,766) |
| State: | 6.5% (18,748) |
Number of households with income $60k - 75k:| Monterey: | 8.8% (47,083) |
| Massachusetts: | 8.8% (25,390) |
Number of households with income $75k - 100k:| Monterey: | 12.0% (63,954) |
| State: | 12.0% (34,488) |
Number of households with income $100k - 125k:| Monterey: | 8.6% (45,616) |
| Massachusetts: | 8.6% (24,599) |
Number of households with income $125k - 150k:| Monterey: | 6.2% (32,903) |
| Massachusetts: | 6.2% (17,743) |
Number of households with income $150k - 200k:| Monterey: | 7.3% (38,974) |
| State: | 7.3% (21,017) |
Number of households with income > $200k:| Monterey: | 8.6% (45,629) |
| Massachusetts: | 8.6% (24,606) |
Aggregate household income in Monterey in 2022: $1,652,934
Median family income in Monterey in 2022:| Monterey: | $52,200 |
| Massachusetts: | $66,072 |
Number of families with income < $10k:| Monterey: | 5.4% (2) |
| Massachusetts: | 6.2% (12,456) |
Number of families with income $10k - 20k:| Monterey: | 4.4% (2) |
| Massachusetts: | 6.0% (12,071) |
Number of families with income $20k - 30k:| Monterey: | 11.5% (4) |
| Massachusetts: | 10.1% (20,376) |
Number of families with income $30k - 40k:| Monterey: | 9.6% (4) |
| Massachusetts: | 8.2% (16,470) |
Number of families with income $40k - 50k:| Monterey: | 8.5% (3) |
| State: | 7.4% (14,829) |
Number of families with income $50k - 60k:| Monterey: | 8.3% (3) |
| State: | 7.3% (14,643) |
Number of families with income $60k - 75k:| Monterey: | 11.2% (4) |
| State: | 10.6% (21,252) |
Number of families with income $75k - 100k:| Monterey: | 7.5% (3) |
| State: | 12.0% (24,088) |
Number of families with income $100k - 125k:| Monterey: | 4.3% (2) |
| State: | 8.9% (17,954) |
Number of families with income $125k - 150k:| Monterey: | 3.8% (1) |
| State: | 6.9% (13,837) |
Number of families with income $150k - 200k:| Monterey: | 8.9% (3) |
| State: | 7.3% (14,683) |
Number of families with income > $200k:| Monterey: | 16.7% (6) |
| Massachusetts: | 9.3% (18,741) |
Median non-family income in Monterey in 2022:| Monterey: | $52,970 |
| State: | $37,563 |
Change in median non-family income between 2000 and 2022:| Monterey, Massachusetts: | +95.6% |
| State: | +115.0% |
Median per capita income in Monterey in 2022:| Monterey: | $63,125 |
| State: | $28,993 |
Change in median per capita income between 2000 and 2022:| Monterey, Massachusetts: | +67.1% |
| State: | +142.4% |
Income statistics for Multirace residents
Median household income in Monterey, MA in 2022:| Monterey: | $63,272 |
| State: | $71,552 |
Number of households with income < $10k:| Monterey: | 6.6% (3,614) |
| State: | 6.6% (15,127) |
Number of households with income $10k - 20k:| Monterey: | 9.3% (5,079) |
| State: | 9.2% (21,158) |
Number of households with income $20k - 30k:| Monterey: | 7.8% (4,281) |
| State: | 7.8% (18,016) |
Number of households with income $30k - 40k:| Monterey: | 8.0% (4,367) |
| Massachusetts: | 7.9% (18,260) |
Number of households with income $40k - 50k:| Monterey: | 5.7% (3,099) |
| State: | 5.6% (13,027) |
Number of households with income $50k - 60k:| Monterey: | 5.6% (3,068) |
| State: | 5.6% (12,909) |
Number of households with income $60k - 75k:| Monterey: | 9.0% (4,935) |
| Massachusetts: | 9.0% (20,800) |
Number of households with income $75k - 100k:| Monterey: | 12.1% (6,658) |
| State: | 12.1% (27,875) |
Number of households with income $100k - 125k:| Monterey: | 8.1% (4,448) |
| Massachusetts: | 8.1% (18,754) |
Number of households with income $125k - 150k:| Monterey: | 6.8% (3,707) |
| State: | 6.8% (15,621) |
Number of households with income $150k - 200k:| Monterey: | 9.2% (5,069) |
| Massachusetts: | 9.4% (21,618) |
Number of households with income > $200k:| Monterey: | 11.8% (6,492) |
| State: | 12.0% (27,592) |
Aggregate household income in Monterey in 2022: $1,039,337
Median non-family income in Monterey in 2022:| Monterey: | $68,548 |
| State: | $42,253 |
Median per capita income in Monterey in 2022:| Monterey: | $54,568 |
| State: | $34,029 |