Morgan Mill-Bluff Dale, Texas (TX) income map, earnings map, and wages data
The median household income in Morgan Mill-Bluff Dale, TX in 2022 was $72,052, which was about the same as the median annual income of $72,284 across the entire state of Texas. Compared to the median income of $39,083 in 2000 this represents an increase of 45.8%. The per capita income in 2022 was $40,959, which means an increase of 48.5% compared to 2000 when it was $21,090.
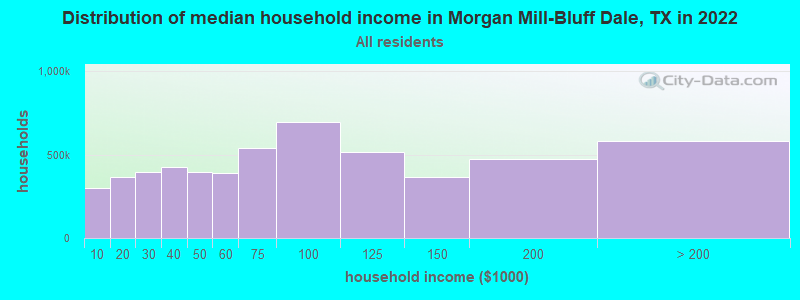
Income statistics for all residents
Median household income in Morgan Mill-Bluff Dale, TX in 2022:| Morgan Mill-Bluff Dale: | $72,053 |
| State: | $72,284 |
Change in median household income between 2000 and 2022:| Morgan Mill-Bluff Dale, Texas: | +84.4% |
| Texas: | +81.0% |
Number of households with income < $10k:| Morgan Mill-Bluff Dale: | 5.5% (298,884) |
| State: | 5.5% (611,011) |
Number of households with income $10k - 20k:| Morgan Mill-Bluff Dale: | 6.7% (363,713) |
| State: | 6.7% (743,157) |
Number of households with income $20k - 30k:| Morgan Mill-Bluff Dale: | 7.2% (393,200) |
| State: | 7.2% (803,381) |
Number of households with income $30k - 40k:| Morgan Mill-Bluff Dale: | 7.8% (423,839) |
| Texas: | 7.8% (866,080) |
Number of households with income $40k - 50k:| Morgan Mill-Bluff Dale: | 7.3% (396,626) |
| State: | 7.3% (810,440) |
Number of households with income $50k - 60k:| Morgan Mill-Bluff Dale: | 7.2% (391,358) |
| State: | 7.2% (799,783) |
Number of households with income $60k - 75k:| Morgan Mill-Bluff Dale: | 9.9% (536,032) |
| State: | 9.9% (1,095,384) |
Number of households with income $75k - 100k:| Morgan Mill-Bluff Dale: | 12.8% (694,612) |
| State: | 12.8% (1,419,057) |
Number of households with income $100k - 125k:| Morgan Mill-Bluff Dale: | 9.5% (516,255) |
| Texas: | 9.5% (1,054,577) |
Number of households with income $125k - 150k:| Morgan Mill-Bluff Dale: | 6.7% (363,092) |
| State: | 6.7% (741,518) |
Number of households with income $150k - 200k:| Morgan Mill-Bluff Dale: | 8.7% (470,680) |
| State: | 8.7% (961,776) |
Number of households with income > $200k:| Morgan Mill-Bluff Dale: | 10.7% (577,994) |
| Texas: | 10.7% (1,181,544) |
Aggregate household income in Morgan Mill-Bluff Dale in 2022: $11,914,384,999
Median family income in Morgan Mill-Bluff Dale in 2022:| Morgan Mill-Bluff Dale: | $93,988 |
| State: | $86,267 |
Median non-family income in Morgan Mill-Bluff Dale in 2022:| Morgan Mill-Bluff Dale: | $36,261 |
| State: | $45,999 |
Change in median non-family income between 2000 and 2022:| Morgan Mill-Bluff Dale, Texas: | +85.2% |
| State: | +79.5% |
Median per capita income in Morgan Mill-Bluff Dale in 2022:| Morgan Mill-Bluff Dale: | $40,959 |
| State: | $38,123 |
Change in median per capita income between 2000 and 2022:| Morgan Mill-Bluff Dale, Texas: | +94.2% |
| State: | +94.3% |
Income statistics for White residents
Median household income in Morgan Mill-Bluff Dale, TX in 2022:| Morgan Mill-Bluff Dale: | $73,299 |
| State: | $82,032 |
Change in median household income between 2000 and 2022:| Morgan Mill-Bluff Dale, Texas: | +90.4% |
| State: | +91.0% |
Number of households with income < $10k:| Morgan Mill-Bluff Dale: | 4.7% (122,324) |
| State: | 4.7% (273,716) |
Number of households with income $10k - 20k:| Morgan Mill-Bluff Dale: | 5.5% (144,480) |
| Texas: | 5.5% (322,702) |
Number of households with income $20k - 30k:| Morgan Mill-Bluff Dale: | 6.2% (163,036) |
| State: | 6.2% (363,947) |
Number of households with income $30k - 40k:| Morgan Mill-Bluff Dale: | 6.8% (178,707) |
| State: | 6.8% (399,275) |
Number of households with income $40k - 50k:| Morgan Mill-Bluff Dale: | 6.5% (171,548) |
| State: | 6.5% (383,417) |
Number of households with income $50k - 60k:| Morgan Mill-Bluff Dale: | 6.6% (173,805) |
| State: | 6.6% (388,535) |
Number of households with income $60k - 75k:| Morgan Mill-Bluff Dale: | 9.6% (252,990) |
| State: | 9.7% (566,295) |
Number of households with income $75k - 100k:| Morgan Mill-Bluff Dale: | 13.0% (339,976) |
| Texas: | 13.0% (760,276) |
Number of households with income $100k - 125k:| Morgan Mill-Bluff Dale: | 10.2% (267,235) |
| State: | 10.2% (597,596) |
Number of households with income $125k - 150k:| Morgan Mill-Bluff Dale: | 7.4% (195,288) |
| Texas: | 7.4% (436,830) |
Number of households with income $150k - 200k:| Morgan Mill-Bluff Dale: | 9.9% (260,457) |
| Texas: | 9.9% (583,067) |
Number of households with income > $200k:| Morgan Mill-Bluff Dale: | 13.5% (353,154) |
| Texas: | 13.5% (792,647) |
Aggregate household income in Morgan Mill-Bluff Dale in 2022: $7,061,010,532
Median family income in Morgan Mill-Bluff Dale in 2022:| Morgan Mill-Bluff Dale: | $98,554 |
| State: | $101,788 |
Number of families with income < $10k:| Morgan Mill-Bluff Dale: | 1.5% (9) |
| Texas: | 2.8% (108,142) |
Number of families with income $10k - 20k:| Morgan Mill-Bluff Dale: | 2.6% (16) |
| State: | 2.9% (113,421) |
Number of families with income $20k - 30k:| Morgan Mill-Bluff Dale: | 5.4% (34) |
| State: | 4.1% (157,688) |
Number of families with income $30k - 40k:| Morgan Mill-Bluff Dale: | 6.6% (41) |
| Texas: | 5.2% (198,847) |
Number of families with income $40k - 50k:| Morgan Mill-Bluff Dale: | 5.7% (36) |
| State: | 5.6% (216,490) |
Number of families with income $50k - 60k:| Morgan Mill-Bluff Dale: | 6.3% (39) |
| Texas: | 5.7% (220,689) |
Number of families with income $60k - 75k:| Morgan Mill-Bluff Dale: | 11.4% (71) |
| State: | 9.0% (346,106) |
Number of families with income $75k - 100k:| Morgan Mill-Bluff Dale: | 12.2% (76) |
| State: | 13.7% (527,363) |
Number of families with income $100k - 125k:| Morgan Mill-Bluff Dale: | 17.0% (107) |
| Texas: | 11.6% (448,411) |
Number of families with income $125k - 150k:| Morgan Mill-Bluff Dale: | 7.0% (44) |
| Texas: | 9.2% (355,798) |
Number of families with income $150k - 200k:| Morgan Mill-Bluff Dale: | 4.0% (25) |
| State: | 12.5% (480,185) |
Number of families with income > $200k:| Morgan Mill-Bluff Dale: | 20.5% (129) |
| State: | 17.6% (677,490) |
Median non-family income in Morgan Mill-Bluff Dale in 2022:| Morgan Mill-Bluff Dale: | $36,391 |
| State: | $50,587 |
Change in median non-family income between 2000 and 2022:| Morgan Mill-Bluff Dale, Texas: | +85.8% |
| Texas: | +87.7% |
Median per capita income in Morgan Mill-Bluff Dale in 2022:| Morgan Mill-Bluff Dale: | $45,496 |
| State: | $47,740 |
Change in median per capita income between 2000 and 2022:| Morgan Mill-Bluff Dale, Texas: | +112.1% |
| Texas: | +114.3% |
Income statistics for Black or African American residents
Median household income in Morgan Mill-Bluff Dale, TX in 2022:| Morgan Mill-Bluff Dale: | $34,700 |
| State: | $55,759 |
Change in median household income between 2000 and 2022:| Morgan Mill-Bluff Dale, Texas: | +113.5% |
| State: | +90.3% |
Number of households with income < $10k:| Morgan Mill-Bluff Dale: | 8.9% (34,911) |
| Texas: | 8.9% (126,378) |
Number of households with income $10k - 20k:| Morgan Mill-Bluff Dale: | 9.9% (39,030) |
| State: | 9.9% (140,369) |
Number of households with income $20k - 30k:| Morgan Mill-Bluff Dale: | 8.5% (33,579) |
| State: | 8.5% (120,639) |
Number of households with income $30k - 40k:| Morgan Mill-Bluff Dale: | 9.7% (37,965) |
| Texas: | 9.7% (137,517) |
Number of households with income $40k - 50k:| Morgan Mill-Bluff Dale: | 7.9% (31,189) |
| State: | 8.0% (112,973) |
Number of households with income $50k - 60k:| Morgan Mill-Bluff Dale: | 8.2% (32,318) |
| State: | 8.3% (117,156) |
Number of households with income $60k - 75k:| Morgan Mill-Bluff Dale: | 10.4% (40,796) |
| Texas: | 10.4% (147,462) |
Number of households with income $75k - 100k:| Morgan Mill-Bluff Dale: | 11.5% (45,046) |
| State: | 11.5% (162,718) |
Number of households with income $100k - 125k:| Morgan Mill-Bluff Dale: | 8.1% (31,983) |
| State: | 8.2% (115,829) |
Number of households with income $125k - 150k:| Morgan Mill-Bluff Dale: | 4.9% (19,381) |
| State: | 4.9% (69,556) |
Number of households with income $150k - 200k:| Morgan Mill-Bluff Dale: | 6.4% (25,102) |
| State: | 6.4% (90,701) |
Number of households with income > $200k:| Morgan Mill-Bluff Dale: | 5.5% (21,565) |
| State: | 5.5% (77,988) |
Aggregate household income in Morgan Mill-Bluff Dale in 2022: $813,041
Median family income in Morgan Mill-Bluff Dale in 2022:| Morgan Mill-Bluff Dale: | $36,367 |
| State: | $69,134 |
Median per capita income in Morgan Mill-Bluff Dale in 2022:| Morgan Mill-Bluff Dale: | $17,895 |
| State: | $30,490 |
Change in median per capita income between 2000 and 2022:| Morgan Mill-Bluff Dale, Texas: | +116.3% |
| Texas: | +113.9% |
Income statistics for Asian residents
Median household income in Morgan Mill-Bluff Dale, TX in 2022:| Morgan Mill-Bluff Dale: | $110,682 |
| State: | $107,673 |
Change in median household income between 2000 and 2022:| Morgan Mill-Bluff Dale, Texas: | +105.9% |
| Texas: | +115.1% |
Number of households with income < $10k:| Morgan Mill-Bluff Dale: | 5.3% (16,068) |
| Texas: | 5.2% (29,885) |
Number of households with income $10k - 20k:| Morgan Mill-Bluff Dale: | 4.8% (14,539) |
| Texas: | 4.7% (27,044) |
Number of households with income $20k - 30k:| Morgan Mill-Bluff Dale: | 4.1% (12,530) |
| State: | 4.1% (23,363) |
Number of households with income $30k - 40k:| Morgan Mill-Bluff Dale: | 4.1% (12,527) |
| Texas: | 4.1% (23,309) |
Number of households with income $40k - 50k:| Morgan Mill-Bluff Dale: | 5.2% (16,014) |
| State: | 5.2% (29,826) |
Number of households with income $50k - 60k:| Morgan Mill-Bluff Dale: | 4.6% (14,205) |
| State: | 4.7% (26,512) |
Number of households with income $60k - 75k:| Morgan Mill-Bluff Dale: | 6.5% (19,840) |
| State: | 6.5% (36,905) |
Number of households with income $75k - 100k:| Morgan Mill-Bluff Dale: | 11.3% (34,500) |
| State: | 11.3% (64,350) |
Number of households with income $100k - 125k:| Morgan Mill-Bluff Dale: | 11.3% (34,720) |
| Texas: | 11.4% (64,714) |
Number of households with income $125k - 150k:| Morgan Mill-Bluff Dale: | 9.3% (28,305) |
| State: | 9.3% (52,719) |
Number of households with income $150k - 200k:| Morgan Mill-Bluff Dale: | 12.5% (38,101) |
| Texas: | 12.5% (70,953) |
Number of households with income > $200k:| Morgan Mill-Bluff Dale: | 21.1% (64,575) |
| State: | 21.1% (120,260) |
Aggregate household income in Morgan Mill-Bluff Dale in 2022: $4,649,253
Median family income in Morgan Mill-Bluff Dale in 2022:| Morgan Mill-Bluff Dale: | $114,716 |
| State: | $123,328 |
Median per capita income in Morgan Mill-Bluff Dale in 2022:| Morgan Mill-Bluff Dale: | $47,064 |
| State: | $48,626 |
Change in median per capita income between 2000 and 2022:| Morgan Mill-Bluff Dale, Texas: | +127.1% |
| State: | +132.0% |
Income statistics for Hispanic or Latino residents
Median household income in Morgan Mill-Bluff Dale, TX in 2022:| Morgan Mill-Bluff Dale: | $44,798 |
| Texas: | $60,504 |
Change in median household income between 2000 and 2022:| Morgan Mill-Bluff Dale, Texas: | +112.9% |
| State: | +102.5% |
Number of households with income < $10k:| Morgan Mill-Bluff Dale: | 5.8% (75,436) |
| State: | 5.8% (213,953) |
Number of households with income $10k - 20k:| Morgan Mill-Bluff Dale: | 8.0% (104,914) |
| Texas: | 8.0% (297,456) |
Number of households with income $20k - 30k:| Morgan Mill-Bluff Dale: | 9.2% (119,871) |
| State: | 9.2% (340,166) |
Number of households with income $30k - 40k:| Morgan Mill-Bluff Dale: | 9.5% (124,978) |
| Texas: | 9.5% (354,336) |
Number of households with income $40k - 50k:| Morgan Mill-Bluff Dale: | 8.8% (115,262) |
| Texas: | 8.8% (327,013) |
Number of households with income $50k - 60k:| Morgan Mill-Bluff Dale: | 8.3% (108,785) |
| Texas: | 8.3% (308,818) |
Number of households with income $60k - 75k:| Morgan Mill-Bluff Dale: | 10.9% (142,830) |
| State: | 10.9% (405,109) |
Number of households with income $75k - 100k:| Morgan Mill-Bluff Dale: | 13.8% (180,470) |
| Texas: | 13.8% (511,639) |
Number of households with income $100k - 125k:| Morgan Mill-Bluff Dale: | 8.6% (112,785) |
| Texas: | 8.6% (319,728) |
Number of households with income $125k - 150k:| Morgan Mill-Bluff Dale: | 5.7% (74,471) |
| State: | 5.7% (210,932) |
Number of households with income $150k - 200k:| Morgan Mill-Bluff Dale: | 6.4% (83,170) |
| State: | 6.4% (236,055) |
Number of households with income > $200k:| Morgan Mill-Bluff Dale: | 5.1% (66,774) |
| Texas: | 5.1% (189,259) |
Aggregate household income in Morgan Mill-Bluff Dale in 2022: $41,256,092
Median family income in Morgan Mill-Bluff Dale in 2022:| Morgan Mill-Bluff Dale: | $47,213 |
| State: | $65,080 |
Number of families with income < $10k:| Morgan Mill-Bluff Dale: | 4.4% (20) |
| Texas: | 5.3% (147,493) |
Number of families with income $10k - 20k:| Morgan Mill-Bluff Dale: | 7.9% (36) |
| Texas: | 6.3% (174,531) |
Number of families with income $20k - 30k:| Morgan Mill-Bluff Dale: | 12.5% (57) |
| Texas: | 8.6% (238,528) |
Number of families with income $30k - 40k:| Morgan Mill-Bluff Dale: | 12.2% (56) |
| Texas: | 9.1% (251,999) |
Number of families with income $40k - 50k:| Morgan Mill-Bluff Dale: | 8.8% (41) |
| State: | 8.6% (240,188) |
Number of families with income $50k - 60k:| Morgan Mill-Bluff Dale: | 8.0% (37) |
| State: | 8.0% (223,566) |
Number of families with income $60k - 75k:| Morgan Mill-Bluff Dale: | 12.6% (58) |
| State: | 10.9% (302,688) |
Number of families with income $75k - 100k:| Morgan Mill-Bluff Dale: | 10.9% (50) |
| State: | 14.3% (398,554) |
Number of families with income $100k - 125k:| Morgan Mill-Bluff Dale: | 11.1% (51) |
| State: | 9.5% (264,007) |
Number of families with income $125k - 150k:| Morgan Mill-Bluff Dale: | 3.8% (17) |
| State: | 6.2% (171,274) |
Number of families with income $150k - 200k:| Morgan Mill-Bluff Dale: | 1.7% (8) |
| State: | 7.3% (202,259) |
Number of families with income > $200k:| Morgan Mill-Bluff Dale: | 6.1% (28) |
| State: | 5.9% (165,129) |
Median non-family income in Morgan Mill-Bluff Dale in 2022:| Morgan Mill-Bluff Dale: | $26,913 |
| Texas: | $39,934 |
Change in median non-family income between 2000 and 2022:| Morgan Mill-Bluff Dale, Texas: | +120.8% |
| State: | +109.1% |
Median per capita income in Morgan Mill-Bluff Dale in 2022:| Morgan Mill-Bluff Dale: | $18,744 |
| State: | $24,862 |
Change in median per capita income between 2000 and 2022:| Morgan Mill-Bluff Dale, Texas: | +128.5% |
| State: | +130.8% |
Income statistics for American Indian and Alaska Native residents
Median household income in Morgan Mill-Bluff Dale, TX in 2022:| Morgan Mill-Bluff Dale: | $98,072 |
| State: | $65,765 |
Change in median household income between 2000 and 2022:| Morgan Mill-Bluff Dale, Texas: | +93.7% |
| Texas: | +88.3% |
Number of households with income < $10k:| Morgan Mill-Bluff Dale: | 4.1% (2,467) |
| State: | 4.1% (3,398) |
Number of households with income $10k - 20k:| Morgan Mill-Bluff Dale: | 8.3% (5,044) |
| State: | 8.3% (6,949) |
Number of households with income $20k - 30k:| Morgan Mill-Bluff Dale: | 9.3% (5,622) |
| State: | 9.3% (7,742) |
Number of households with income $30k - 40k:| Morgan Mill-Bluff Dale: | 9.1% (5,531) |
| State: | 9.1% (7,627) |
Number of households with income $40k - 50k:| Morgan Mill-Bluff Dale: | 7.1% (4,303) |
| State: | 7.1% (5,922) |
Number of households with income $50k - 60k:| Morgan Mill-Bluff Dale: | 8.1% (4,910) |
| Texas: | 8.1% (6,761) |
Number of households with income $60k - 75k:| Morgan Mill-Bluff Dale: | 12.7% (7,684) |
| State: | 12.7% (10,588) |
Number of households with income $75k - 100k:| Morgan Mill-Bluff Dale: | 13.0% (7,918) |
| State: | 13.0% (10,903) |
Number of households with income $100k - 125k:| Morgan Mill-Bluff Dale: | 9.9% (5,995) |
| State: | 9.9% (8,256) |
Number of households with income $125k - 150k:| Morgan Mill-Bluff Dale: | 5.2% (3,160) |
| State: | 5.2% (4,355) |
Number of households with income $150k - 200k:| Morgan Mill-Bluff Dale: | 6.7% (4,078) |
| State: | 6.7% (5,623) |
Number of households with income > $200k:| Morgan Mill-Bluff Dale: | 6.6% (4,004) |
| State: | 6.6% (5,522) |
Aggregate household income in Morgan Mill-Bluff Dale in 2022: $1,012,666
Median family income in Morgan Mill-Bluff Dale in 2022:| Morgan Mill-Bluff Dale: | $96,537 |
| State: | $72,369 |
Median per capita income in Morgan Mill-Bluff Dale in 2022:| Morgan Mill-Bluff Dale: | $43,765 |
| Texas: | $28,166 |
Change in median per capita income between 2000 and 2022:| Morgan Mill-Bluff Dale, Texas: | +95.5% |
| Texas: | +77.2% |
Income statistics for Multirace residents
Median household income in Morgan Mill-Bluff Dale, TX in 2022:| Morgan Mill-Bluff Dale: | $129,896 |
| Texas: | $62,748 |
Change in median household income between 2000 and 2022:| Morgan Mill-Bluff Dale, Texas: | +97.9% |
| State: | +92.3% |
Number of households with income < $10k:| Morgan Mill-Bluff Dale: | 5.5% (122,885) |
| Texas: | 5.5% (122,324) |
Number of households with income $10k - 20k:| Morgan Mill-Bluff Dale: | 8.2% (183,071) |
| State: | 8.2% (182,232) |
Number of households with income $20k - 30k:| Morgan Mill-Bluff Dale: | 8.5% (190,130) |
| State: | 8.5% (189,456) |
Number of households with income $30k - 40k:| Morgan Mill-Bluff Dale: | 8.9% (198,354) |
| Texas: | 8.9% (197,499) |
Number of households with income $40k - 50k:| Morgan Mill-Bluff Dale: | 8.7% (192,667) |
| State: | 8.7% (191,735) |
Number of households with income $50k - 60k:| Morgan Mill-Bluff Dale: | 8.0% (178,200) |
| State: | 8.0% (177,535) |
Number of households with income $60k - 75k:| Morgan Mill-Bluff Dale: | 10.5% (233,569) |
| Texas: | 10.5% (232,479) |
Number of households with income $75k - 100k:| Morgan Mill-Bluff Dale: | 13.1% (291,714) |
| State: | 13.1% (290,448) |
Number of households with income $100k - 125k:| Morgan Mill-Bluff Dale: | 8.6% (192,515) |
| State: | 8.6% (191,595) |
Number of households with income $125k - 150k:| Morgan Mill-Bluff Dale: | 6.0% (134,092) |
| Texas: | 6.0% (133,361) |
Number of households with income $150k - 200k:| Morgan Mill-Bluff Dale: | 7.2% (159,711) |
| State: | 7.2% (159,195) |
Number of households with income > $200k:| Morgan Mill-Bluff Dale: | 6.7% (148,701) |
| Texas: | 6.7% (148,064) |
Aggregate household income in Morgan Mill-Bluff Dale in 2022: $14,957,785
Median family income in Morgan Mill-Bluff Dale in 2022:| Morgan Mill-Bluff Dale: | $129,277 |
| State: | $69,780 |
Number of families with income $20k - 30k:| Morgan Mill-Bluff Dale: | 20.6% (16) |
| State: | 7.8% (126,627) |
Number of families with income $60k - 75k:| Morgan Mill-Bluff Dale: | 43.6% (35) |
| State: | 10.5% (169,549) |
Number of families with income $75k - 100k:| Morgan Mill-Bluff Dale: | 35.8% (28) |
| State: | 14.0% (226,284) |
Median per capita income in Morgan Mill-Bluff Dale in 2022:| Morgan Mill-Bluff Dale: | $16,408 |
| State: | $26,785 |
Change in median per capita income between 2000 and 2022:| Morgan Mill-Bluff Dale, Texas: | +108.4% |
| State: | +110.9% |
Income statistics for other residents
Number of households with income < $10k:| Morgan Mill-Bluff Dale: | 6.2% (1) |
| Texas: | 5.9% (54,162) |
Number of households with income $10k - 20k:| Morgan Mill-Bluff Dale: | 0.0% (0) |
| State: | 6.8% (62,891) |
Number of households with income $20k - 30k:| Morgan Mill-Bluff Dale: | 12.5% (2) |
| Texas: | 10.6% (97,294) |
Number of households with income $30k - 40k:| Morgan Mill-Bluff Dale: | 12.5% (2) |
| State: | 10.8% (99,670) |
Number of households with income $40k - 50k:| Morgan Mill-Bluff Dale: | 12.5% (2) |
| State: | 9.3% (85,548) |
Number of households with income $50k - 60k:| Morgan Mill-Bluff Dale: | 6.2% (1) |
| Texas: | 9.0% (82,757) |
Number of households with income $60k - 75k:| Morgan Mill-Bluff Dale: | 12.5% (2) |
| State: | 10.9% (100,326) |
Number of households with income $75k - 100k:| Morgan Mill-Bluff Dale: | 12.5% (2) |
| Texas: | 14.0% (128,767) |
Number of households with income $100k - 125k:| Morgan Mill-Bluff Dale: | 6.2% (1) |
| State: | 8.2% (75,218) |
Number of households with income $125k - 150k:| Morgan Mill-Bluff Dale: | 6.2% (1) |
| State: | 4.8% (44,223) |
Number of households with income $150k - 200k:| Morgan Mill-Bluff Dale: | 6.2% (1) |
| State: | 5.6% (51,376) |
Number of households with income > $200k:| Morgan Mill-Bluff Dale: | 6.2% (1) |
| State: | 4.0% (36,393) |
Aggregate household income in Morgan Mill-Bluff Dale in 2022: $1,048,861
Median family income in Morgan Mill-Bluff Dale in 2022:| Morgan Mill-Bluff Dale: | $70,812 |
| Texas: | $60,064 |
Median per capita income in Morgan Mill-Bluff Dale in 2022:| Morgan Mill-Bluff Dale: | $21,858 |
| State: | $23,899 |
Change in median per capita income between 2000 and 2022:| Morgan Mill-Bluff Dale, Texas: | +141.8% |
| State: | +135.2% |