Mount Selman, Texas (TX) income map, earnings map, and wages data
The median household income in Mount Selman, TX in 2022 was $66,402, which was 8.9% less than the median annual income of $72,284 across the entire state of Texas. Compared to the median income of $36,018 in 2000 this represents an increase of 45.8%. The per capita income in 2022 was $32,658, which means an increase of 48.5% compared to 2000 when it was $16,816.
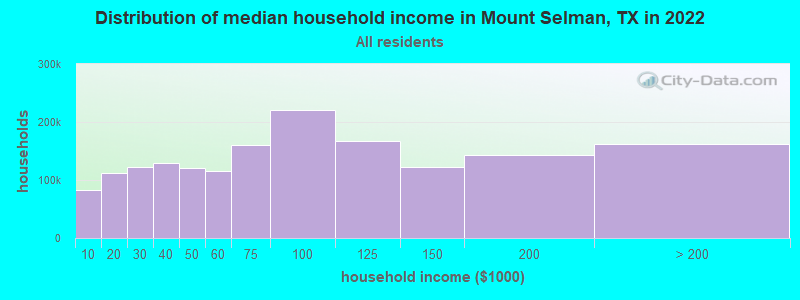
Income statistics for all residents
Median household income in Mount Selman, TX in 2022:| Mount Selman: | $66,402 |
| State: | $72,284 |
Change in median household income between 2000 and 2022:| Mount Selman, Texas: | +84.4% |
| Texas: | +81.0% |
Number of households with income < $10k:| Mount Selman: | 5.5% (275,445) |
| State: | 5.5% (611,011) |
Number of households with income $10k - 20k:| Mount Selman: | 6.7% (335,190) |
| State: | 6.7% (743,157) |
Number of households with income $20k - 30k:| Mount Selman: | 7.2% (362,364) |
| State: | 7.2% (803,381) |
Number of households with income $30k - 40k:| Mount Selman: | 7.8% (390,600) |
| State: | 7.8% (866,080) |
Number of households with income $40k - 50k:| Mount Selman: | 7.3% (365,522) |
| State: | 7.3% (810,440) |
Number of households with income $50k - 60k:| Mount Selman: | 7.2% (360,667) |
| Texas: | 7.2% (799,783) |
Number of households with income $60k - 75k:| Mount Selman: | 9.9% (493,995) |
| Texas: | 9.9% (1,095,384) |
Number of households with income $75k - 100k:| Mount Selman: | 12.8% (640,138) |
| State: | 12.8% (1,419,057) |
Number of households with income $100k - 125k:| Mount Selman: | 9.5% (475,769) |
| Texas: | 9.5% (1,054,577) |
Number of households with income $125k - 150k:| Mount Selman: | 6.7% (334,617) |
| Texas: | 6.7% (741,518) |
Number of households with income $150k - 200k:| Mount Selman: | 8.7% (433,768) |
| State: | 8.7% (961,776) |
Number of households with income > $200k:| Mount Selman: | 10.7% (532,666) |
| State: | 10.7% (1,181,544) |
Aggregate household income in Mount Selman in 2022: $18,325,869,304
Median family income in Mount Selman in 2022:| Mount Selman: | $80,134 |
| Texas: | $86,267 |
Median non-family income in Mount Selman in 2022:| Mount Selman: | $39,484 |
| State: | $45,999 |
Change in median non-family income between 2000 and 2022:| Mount Selman, Texas: | +85.2% |
| State: | +79.5% |
Median per capita income in Mount Selman in 2022:| Mount Selman: | $32,659 |
| State: | $38,123 |
Change in median per capita income between 2000 and 2022:| Mount Selman, Texas: | +94.2% |
| State: | +94.3% |
Income statistics for White residents
Median household income in Mount Selman, TX in 2022:| Mount Selman: | $69,050 |
| State: | $82,032 |
Change in median household income between 2000 and 2022:| Mount Selman, Texas: | +90.4% |
| Texas: | +91.0% |
Number of households with income < $10k:| Mount Selman: | 4.7% (115,232) |
| State: | 4.7% (273,716) |
Number of households with income $10k - 20k:| Mount Selman: | 5.5% (136,104) |
| State: | 5.5% (322,702) |
Number of households with income $20k - 30k:| Mount Selman: | 6.2% (153,583) |
| State: | 6.2% (363,947) |
Number of households with income $30k - 40k:| Mount Selman: | 6.8% (168,347) |
| State: | 6.8% (399,275) |
Number of households with income $40k - 50k:| Mount Selman: | 6.5% (161,603) |
| State: | 6.5% (383,417) |
Number of households with income $50k - 60k:| Mount Selman: | 6.6% (163,729) |
| State: | 6.6% (388,535) |
Number of households with income $60k - 75k:| Mount Selman: | 9.6% (238,323) |
| State: | 9.7% (566,295) |
Number of households with income $75k - 100k:| Mount Selman: | 13.0% (320,267) |
| State: | 13.0% (760,276) |
Number of households with income $100k - 125k:| Mount Selman: | 10.2% (251,742) |
| State: | 10.2% (597,596) |
Number of households with income $125k - 150k:| Mount Selman: | 7.4% (183,966) |
| State: | 7.4% (436,830) |
Number of households with income $150k - 200k:| Mount Selman: | 9.9% (245,358) |
| Texas: | 9.9% (583,067) |
Number of households with income > $200k:| Mount Selman: | 13.5% (332,680) |
| State: | 13.5% (792,647) |
Aggregate household income in Mount Selman in 2022: $10,524,199,600
Median family income in Mount Selman in 2022:| Mount Selman: | $84,520 |
| Texas: | $101,788 |
Number of families with income < $10k:| Mount Selman: | 3.5% (32) |
| State: | 2.8% (108,142) |
Number of families with income $10k - 20k:| Mount Selman: | 4.5% (40) |
| State: | 2.9% (113,421) |
Number of families with income $20k - 30k:| Mount Selman: | 6.4% (58) |
| State: | 4.1% (157,688) |
Number of families with income $30k - 40k:| Mount Selman: | 8.7% (78) |
| State: | 5.2% (198,847) |
Number of families with income $40k - 50k:| Mount Selman: | 8.4% (76) |
| Texas: | 5.6% (216,490) |
Number of families with income $50k - 60k:| Mount Selman: | 8.7% (78) |
| State: | 5.7% (220,689) |
Number of families with income $60k - 75k:| Mount Selman: | 12.3% (112) |
| State: | 9.0% (346,106) |
Number of families with income $75k - 100k:| Mount Selman: | 11.6% (105) |
| State: | 13.7% (527,363) |
Number of families with income $100k - 125k:| Mount Selman: | 8.5% (77) |
| Texas: | 11.6% (448,411) |
Number of families with income $125k - 150k:| Mount Selman: | 4.9% (44) |
| State: | 9.2% (355,798) |
Number of families with income $150k - 200k:| Mount Selman: | 16.5% (149) |
| Texas: | 12.5% (480,185) |
Number of families with income > $200k:| Mount Selman: | 6.1% (55) |
| State: | 17.6% (677,490) |
Median non-family income in Mount Selman in 2022:| Mount Selman: | $39,991 |
| State: | $50,587 |
Change in median non-family income between 2000 and 2022:| Mount Selman, Texas: | +85.8% |
| State: | +87.7% |
Median per capita income in Mount Selman in 2022:| Mount Selman: | $36,460 |
| State: | $47,740 |
Change in median per capita income between 2000 and 2022:| Mount Selman, Texas: | +112.1% |
| State: | +114.3% |
Income statistics for Black or African American residents
Median household income in Mount Selman, TX in 2022:| Mount Selman: | $68,957 |
| Texas: | $55,759 |
Change in median household income between 2000 and 2022:| Mount Selman, Texas: | +113.5% |
| State: | +90.3% |
Number of households with income < $10k:| Mount Selman: | 8.9% (69,375) |
| Texas: | 8.9% (126,378) |
Number of households with income $10k - 20k:| Mount Selman: | 9.9% (77,560) |
| State: | 9.9% (140,369) |
Number of households with income $20k - 30k:| Mount Selman: | 8.5% (66,728) |
| State: | 8.5% (120,639) |
Number of households with income $30k - 40k:| Mount Selman: | 9.7% (75,444) |
| State: | 9.7% (137,517) |
Number of households with income $40k - 50k:| Mount Selman: | 7.9% (61,978) |
| Texas: | 8.0% (112,973) |
Number of households with income $50k - 60k:| Mount Selman: | 8.2% (64,222) |
| State: | 8.3% (117,156) |
Number of households with income $60k - 75k:| Mount Selman: | 10.4% (81,070) |
| State: | 10.4% (147,462) |
Number of households with income $75k - 100k:| Mount Selman: | 11.5% (89,515) |
| Texas: | 11.5% (162,718) |
Number of households with income $100k - 125k:| Mount Selman: | 8.1% (63,557) |
| State: | 8.2% (115,829) |
Number of households with income $125k - 150k:| Mount Selman: | 4.9% (38,514) |
| State: | 4.9% (69,556) |
Number of households with income $150k - 200k:| Mount Selman: | 6.4% (49,882) |
| State: | 6.4% (90,701) |
Number of households with income > $200k:| Mount Selman: | 5.5% (42,855) |
| State: | 5.5% (77,988) |
Aggregate household income in Mount Selman in 2022: $78,334,441
Median family income in Mount Selman in 2022:| Mount Selman: | $97,111 |
| State: | $69,134 |
Number of families with income < $10k:| Mount Selman: | 0.8% (1) |
| State: | 6.8% (55,625) |
Number of families with income $10k - 20k:| Mount Selman: | 13.1% (9) |
| Texas: | 6.8% (55,300) |
Number of families with income $20k - 30k:| Mount Selman: | 4.4% (3) |
| Texas: | 7.1% (57,877) |
Number of families with income $30k - 40k:| Mount Selman: | 7.0% (5) |
| State: | 8.5% (68,776) |
Number of families with income $40k - 50k:| Mount Selman: | 16.5% (12) |
| State: | 7.1% (57,907) |
Number of families with income $60k - 75k:| Mount Selman: | 58.2% (41) |
| Texas: | 10.1% (81,994) |
Median non-family income in Mount Selman in 2022:| Mount Selman: | $9,832 |
| State: | $40,133 |
Change in median non-family income between 2000 and 2022:| Mount Selman, Texas: | +133.0% |
| Texas: | +102.2% |
Median per capita income in Mount Selman in 2022:| Mount Selman: | $28,716 |
| State: | $30,490 |
Change in median per capita income between 2000 and 2022:| Mount Selman, Texas: | +116.3% |
| Texas: | +113.9% |
Income statistics for Asian residents
Median household income in Mount Selman, TX in 2022:| Mount Selman: | $59,202 |
| State: | $107,673 |
Change in median household income between 2000 and 2022:| Mount Selman, Texas: | +105.9% |
| State: | +115.1% |
Number of households with income < $10k:| Mount Selman: | 5.3% (8,595) |
| Texas: | 5.2% (29,885) |
Number of households with income $10k - 20k:| Mount Selman: | 4.8% (7,777) |
| State: | 4.7% (27,044) |
Number of households with income $20k - 30k:| Mount Selman: | 4.1% (6,702) |
| Texas: | 4.1% (23,363) |
Number of households with income $30k - 40k:| Mount Selman: | 4.1% (6,700) |
| State: | 4.1% (23,309) |
Number of households with income $40k - 50k:| Mount Selman: | 5.2% (8,566) |
| State: | 5.2% (29,826) |
Number of households with income $50k - 60k:| Mount Selman: | 4.6% (7,598) |
| Texas: | 4.7% (26,512) |
Number of households with income $60k - 75k:| Mount Selman: | 6.5% (10,612) |
| State: | 6.5% (36,905) |
Number of households with income $75k - 100k:| Mount Selman: | 11.3% (18,453) |
| State: | 11.3% (64,350) |
Number of households with income $100k - 125k:| Mount Selman: | 11.3% (18,571) |
| State: | 11.4% (64,714) |
Number of households with income $125k - 150k:| Mount Selman: | 9.3% (15,140) |
| State: | 9.3% (52,719) |
Number of households with income $150k - 200k:| Mount Selman: | 12.5% (20,380) |
| Texas: | 12.5% (70,953) |
Number of households with income > $200k:| Mount Selman: | 21.1% (34,540) |
| Texas: | 21.1% (120,260) |
Aggregate household income in Mount Selman in 2022: $6,071,786
Median family income in Mount Selman in 2022:| Mount Selman: | $61,359 |
| Texas: | $123,328 |
Median per capita income in Mount Selman in 2022:| Mount Selman: | $18,171 |
| State: | $48,626 |
Change in median per capita income between 2000 and 2022:| Mount Selman, Texas: | +127.1% |
| Texas: | +132.0% |
Income statistics for Hispanic or Latino residents
Median household income in Mount Selman, TX in 2022:| Mount Selman: | $89,593 |
| Texas: | $60,504 |
Change in median household income between 2000 and 2022:| Mount Selman, Texas: | +112.9% |
| State: | +102.5% |
Number of households with income < $10k:| Mount Selman: | 5.8% (150,868) |
| Texas: | 5.8% (213,953) |
Number of households with income $10k - 20k:| Mount Selman: | 8.0% (209,822) |
| Texas: | 8.0% (297,456) |
Number of households with income $20k - 30k:| Mount Selman: | 9.2% (239,736) |
| State: | 9.2% (340,166) |
Number of households with income $30k - 40k:| Mount Selman: | 9.5% (249,949) |
| State: | 9.5% (354,336) |
Number of households with income $40k - 50k:| Mount Selman: | 8.8% (230,519) |
| State: | 8.8% (327,013) |
Number of households with income $50k - 60k:| Mount Selman: | 8.3% (217,565) |
| State: | 8.3% (308,818) |
Number of households with income $60k - 75k:| Mount Selman: | 10.9% (285,653) |
| State: | 10.9% (405,109) |
Number of households with income $75k - 100k:| Mount Selman: | 13.8% (360,931) |
| Texas: | 13.8% (511,639) |
Number of households with income $100k - 125k:| Mount Selman: | 8.6% (225,565) |
| Texas: | 8.6% (319,728) |
Number of households with income $125k - 150k:| Mount Selman: | 5.7% (148,939) |
| State: | 5.7% (210,932) |
Number of households with income $150k - 200k:| Mount Selman: | 6.4% (166,337) |
| State: | 6.4% (236,055) |
Number of households with income > $200k:| Mount Selman: | 5.1% (133,545) |
| State: | 5.1% (189,259) |
Aggregate household income in Mount Selman in 2022: $44,928,278
Median family income in Mount Selman in 2022:| Mount Selman: | $100,517 |
| State: | $65,080 |
Number of families with income < $10k:| Mount Selman: | 8.5% (69) |
| State: | 5.3% (147,493) |
Number of families with income $10k - 20k:| Mount Selman: | 11.8% (95) |
| State: | 6.3% (174,531) |
Number of families with income $20k - 30k:| Mount Selman: | 13.6% (110) |
| State: | 8.6% (238,528) |
Number of families with income $30k - 40k:| Mount Selman: | 13.4% (109) |
| State: | 9.1% (251,999) |
Number of families with income $40k - 50k:| Mount Selman: | 9.7% (78) |
| State: | 8.6% (240,188) |
Number of families with income $50k - 60k:| Mount Selman: | 9.4% (76) |
| State: | 8.0% (223,566) |
Number of families with income $60k - 75k:| Mount Selman: | 11.2% (91) |
| State: | 10.9% (302,688) |
Number of families with income $75k - 100k:| Mount Selman: | 8.5% (69) |
| Texas: | 14.3% (398,554) |
Number of families with income $100k - 125k:| Mount Selman: | 4.5% (37) |
| Texas: | 9.5% (264,007) |
Number of families with income $125k - 150k:| Mount Selman: | 2.2% (17) |
| State: | 6.2% (171,274) |
Number of families with income $150k - 200k:| Mount Selman: | 5.7% (46) |
| Texas: | 7.3% (202,259) |
Number of families with income > $200k:| Mount Selman: | 1.5% (12) |
| Texas: | 5.9% (165,129) |
Median non-family income in Mount Selman in 2022:| Mount Selman: | $35,882 |
| State: | $39,934 |
Change in median non-family income between 2000 and 2022:| Mount Selman, Texas: | +120.8% |
| State: | +109.1% |
Median per capita income in Mount Selman in 2022:| Mount Selman: | $38,798 |
| Texas: | $24,862 |
Change in median per capita income between 2000 and 2022:| Mount Selman, Texas: | +128.5% |
| State: | +130.8% |
Income statistics for Multirace residents
Median household income in Mount Selman, TX in 2022:| Mount Selman: | $4,946 |
| State: | $62,748 |
Change in median household income between 2000 and 2022:| Mount Selman, Texas: | +97.9% |
| Texas: | +92.3% |
Number of households with income < $10k:| Mount Selman: | 5.5% (4,679) |
| State: | 5.5% (122,324) |
Number of households with income $10k - 20k:| Mount Selman: | 8.2% (6,971) |
| State: | 8.2% (182,232) |
Number of households with income $20k - 30k:| Mount Selman: | 8.5% (7,240) |
| State: | 8.5% (189,456) |
Number of households with income $30k - 40k:| Mount Selman: | 8.9% (7,553) |
| Texas: | 8.9% (197,499) |
Number of households with income $40k - 50k:| Mount Selman: | 8.7% (7,337) |
| State: | 8.7% (191,735) |
Number of households with income $50k - 60k:| Mount Selman: | 8.0% (6,786) |
| State: | 8.0% (177,535) |
Number of households with income $60k - 75k:| Mount Selman: | 10.5% (8,894) |
| Texas: | 10.5% (232,479) |
Number of households with income $75k - 100k:| Mount Selman: | 13.1% (11,108) |
| State: | 13.1% (290,448) |
Number of households with income $100k - 125k:| Mount Selman: | 8.7% (7,331) |
| State: | 8.6% (191,595) |
Number of households with income $125k - 150k:| Mount Selman: | 6.0% (5,106) |
| Texas: | 6.0% (133,361) |
Number of households with income $150k - 200k:| Mount Selman: | 7.2% (6,082) |
| Texas: | 7.2% (159,195) |
Number of households with income > $200k:| Mount Selman: | 6.7% (5,663) |
| State: | 6.7% (148,064) |
Aggregate household income in Mount Selman in 2022: $117,609
Median non-family income in Mount Selman in 2022:| Mount Selman: | $4,827 |
| Texas: | $40,634 |
Change in median non-family income between 2000 and 2022:| Mount Selman, Texas: | +93.2% |
| Texas: | +77.2% |
Median per capita income in Mount Selman in 2022:| Mount Selman: | $183 |
| Texas: | $26,785 |
Income statistics for other residents
Number of households with income < $10k:| Mount Selman: | 5.9% (19,550) |
| Texas: | 5.9% (54,162) |
Number of households with income $10k - 20k:| Mount Selman: | 6.8% (22,697) |
| State: | 6.8% (62,891) |
Number of households with income $20k - 30k:| Mount Selman: | 10.6% (35,092) |
| State: | 10.6% (97,294) |
Number of households with income $30k - 40k:| Mount Selman: | 10.8% (35,960) |
| State: | 10.8% (99,670) |
Number of households with income $40k - 50k:| Mount Selman: | 9.3% (30,857) |
| State: | 9.3% (85,548) |
Number of households with income $50k - 60k:| Mount Selman: | 9.0% (29,861) |
| Texas: | 9.0% (82,757) |
Number of households with income $60k - 75k:| Mount Selman: | 10.9% (36,217) |
| Texas: | 10.9% (100,326) |
Number of households with income $75k - 100k:| Mount Selman: | 14.0% (46,494) |
| State: | 14.0% (128,767) |
Number of households with income $100k - 125k:| Mount Selman: | 8.2% (27,168) |
| Texas: | 8.2% (75,218) |
Number of households with income $125k - 150k:| Mount Selman: | 4.8% (15,996) |
| Texas: | 4.8% (44,223) |
Number of households with income $150k - 200k:| Mount Selman: | 5.6% (18,554) |
| Texas: | 5.6% (51,376) |
Number of households with income > $200k:| Mount Selman: | 4.0% (13,155) |
| State: | 4.0% (36,393) |
Median per capita income in Mount Selman in 2022:| Mount Selman: | $17,734 |
| State: | $23,899 |
Change in median per capita income between 2000 and 2022:| Mount Selman, Texas: | +141.8% |
| Texas: | +135.2% |