Murrieta Hot Springs, California (CA) income map, earnings map, and wages data
The median household income in Murrieta Hot Springs, CA in 2022 was $55,242, which was 65.7% less than the median annual income of $91,551 across the entire state of California. Compared to the median income of $27,311 in 2000 this represents an increase of 50.6%. The per capita income in 2022 was $37,938, which means an increase of 47.3% compared to 2000 when it was $19,991.
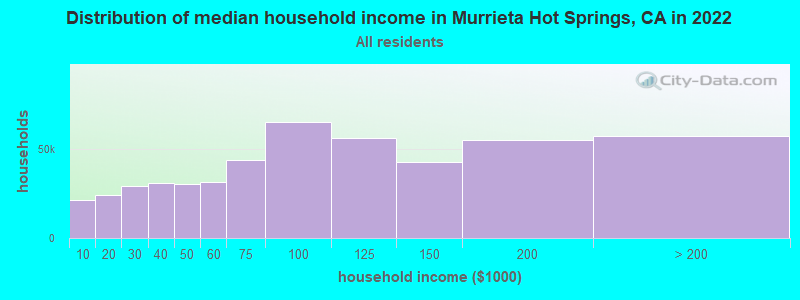
Income statistics for all residents
Median household income in Murrieta Hot Springs, CA in 2022:| Murrieta Hot Springs: | $55,242 |
| California: | $91,551 |
Change in median household income between 2000 and 2022:| Murrieta Hot Springs, California: | +102.3% |
| California: | +92.8% |
Number of households with income < $10k:| Murrieta Hot Springs: | 4.4% (21,440) |
| California: | 4.8% (654,370) |
Number of households with income $10k - 20k:| Murrieta Hot Springs: | 4.9% (24,247) |
| California: | 5.8% (789,493) |
Number of households with income $20k - 30k:| Murrieta Hot Springs: | 6.0% (29,264) |
| State: | 5.7% (778,318) |
Number of households with income $30k - 40k:| Murrieta Hot Springs: | 6.3% (31,095) |
| State: | 5.8% (783,170) |
Number of households with income $40k - 50k:| Murrieta Hot Springs: | 6.3% (30,711) |
| State: | 5.8% (781,352) |
Number of households with income $50k - 60k:| Murrieta Hot Springs: | 6.4% (31,583) |
| State: | 5.6% (760,175) |
Number of households with income $60k - 75k:| Murrieta Hot Springs: | 9.0% (44,222) |
| State: | 8.2% (1,104,699) |
Number of households with income $75k - 100k:| Murrieta Hot Springs: | 13.4% (65,440) |
| State: | 12.0% (1,627,633) |
Number of households with income $100k - 125k:| Murrieta Hot Springs: | 11.5% (56,317) |
| State: | 10.0% (1,358,619) |
Number of households with income $125k - 150k:| Murrieta Hot Springs: | 8.8% (43,073) |
| State: | 7.6% (1,027,455) |
Number of households with income $150k - 200k:| Murrieta Hot Springs: | 11.2% (55,033) |
| California: | 10.6% (1,439,811) |
Number of households with income > $200k:| Murrieta Hot Springs: | 11.8% (57,587) |
| State: | 18.0% (2,445,491) |
Aggregate household income in Murrieta Hot Springs in 2022: $2,161,020,202
Median family income in Murrieta Hot Springs in 2022:| Murrieta Hot Springs: | $70,033 |
| State: | $104,823 |
Median non-family income in Murrieta Hot Springs in 2022:| Murrieta Hot Springs: | $36,620 |
| State: | $59,348 |
Change in median non-family income between 2000 and 2022:| Murrieta Hot Springs, California: | +90.9% |
| State: | +85.3% |
Median per capita income in Murrieta Hot Springs in 2022:| Murrieta Hot Springs: | $37,939 |
| California: | $46,661 |
Change in median per capita income between 2000 and 2022:| Murrieta Hot Springs, California: | +89.8% |
| State: | +105.5% |
Income statistics for White residents
Median household income in Murrieta Hot Springs, CA in 2022:| Murrieta Hot Springs: | $53,964 |
| State: | $100,917 |
Change in median household income between 2000 and 2022:| Murrieta Hot Springs, California: | +101.4% |
| State: | +96.8% |
Number of households with income < $10k:| Murrieta Hot Springs: | 4.4% (9,283) |
| State: | 4.4% (284,109) |
Number of households with income $10k - 20k:| Murrieta Hot Springs: | 5.2% (11,130) |
| State: | 5.3% (340,330) |
Number of households with income $20k - 30k:| Murrieta Hot Springs: | 6.3% (13,449) |
| California: | 5.3% (343,145) |
Number of households with income $30k - 40k:| Murrieta Hot Springs: | 5.7% (12,222) |
| State: | 5.1% (330,146) |
Number of households with income $40k - 50k:| Murrieta Hot Springs: | 5.8% (12,340) |
| State: | 5.2% (335,310) |
Number of households with income $50k - 60k:| Murrieta Hot Springs: | 6.0% (12,902) |
| State: | 5.1% (326,299) |
Number of households with income $60k - 75k:| Murrieta Hot Springs: | 8.8% (18,747) |
| State: | 7.6% (487,640) |
Number of households with income $75k - 100k:| Murrieta Hot Springs: | 12.4% (26,559) |
| State: | 11.5% (736,578) |
Number of households with income $100k - 125k:| Murrieta Hot Springs: | 10.7% (22,860) |
| State: | 10.1% (648,782) |
Number of households with income $125k - 150k:| Murrieta Hot Springs: | 9.0% (19,226) |
| State: | 7.8% (499,671) |
Number of households with income $150k - 200k:| Murrieta Hot Springs: | 11.5% (24,527) |
| California: | 11.4% (729,603) |
Number of households with income > $200k:| Murrieta Hot Springs: | 14.1% (30,125) |
| California: | 21.2% (1,364,246) |
Aggregate household income in Murrieta Hot Springs in 2022: $970,985,250
Median family income in Murrieta Hot Springs in 2022:| Murrieta Hot Springs: | $70,914 |
| California: | $125,379 |
Number of families with income < $10k:| Murrieta Hot Springs: | 2.7% (15) |
| State: | 2.2% (87,079) |
Number of families with income $10k - 20k:| Murrieta Hot Springs: | 5.0% (29) |
| California: | 2.5% (97,716) |
Number of families with income $20k - 30k:| Murrieta Hot Springs: | 6.3% (36) |
| State: | 3.5% (137,295) |
Number of families with income $30k - 40k:| Murrieta Hot Springs: | 8.9% (51) |
| State: | 3.9% (152,947) |
Number of families with income $40k - 50k:| Murrieta Hot Springs: | 6.3% (36) |
| California: | 4.3% (169,197) |
Number of families with income $50k - 60k:| Murrieta Hot Springs: | 5.8% (33) |
| State: | 4.5% (176,192) |
Number of families with income $60k - 75k:| Murrieta Hot Springs: | 4.9% (28) |
| State: | 7.0% (274,752) |
Number of families with income $75k - 100k:| Murrieta Hot Springs: | 2.5% (14) |
| California: | 11.3% (445,632) |
Number of families with income $100k - 125k:| Murrieta Hot Springs: | 7.6% (44) |
| State: | 10.7% (423,630) |
Number of families with income $150k - 200k:| Murrieta Hot Springs: | 42.4% (244) |
| State: | 13.5% (532,693) |
Number of families with income > $200k:| Murrieta Hot Springs: | 7.7% (44) |
| California: | 27.6% (1,086,948) |
Median non-family income in Murrieta Hot Springs in 2022:| Murrieta Hot Springs: | $36,302 |
| State: | $62,819 |
Change in median non-family income between 2000 and 2022:| Murrieta Hot Springs, California: | +89.2% |
| California: | +84.4% |
Median per capita income in Murrieta Hot Springs in 2022:| Murrieta Hot Springs: | $42,296 |
| State: | $61,706 |
Change in median per capita income between 2000 and 2022:| Murrieta Hot Springs, California: | +114.2% |
| State: | +122.7% |
Income statistics for Black or African American residents
Median household income in Murrieta Hot Springs, CA in 2022:| Murrieta Hot Springs: | $84,253 |
| State: | $63,268 |
Change in median household income between 2000 and 2022:| Murrieta Hot Springs, California: | +106.7% |
| State: | +81.0% |
Number of households with income < $10k:| Murrieta Hot Springs: | 7.4% (4,224) |
| State: | 9.0% (73,219) |
Number of households with income $10k - 20k:| Murrieta Hot Springs: | 7.7% (4,394) |
| State: | 10.6% (86,666) |
Number of households with income $20k - 30k:| Murrieta Hot Springs: | 5.3% (3,038) |
| California: | 7.1% (57,719) |
Number of households with income $30k - 40k:| Murrieta Hot Springs: | 5.6% (3,217) |
| State: | 7.2% (58,714) |
Number of households with income $40k - 50k:| Murrieta Hot Springs: | 5.7% (3,267) |
| California: | 7.1% (58,075) |
Number of households with income $50k - 60k:| Murrieta Hot Springs: | 7.0% (3,998) |
| State: | 6.8% (55,229) |
Number of households with income $60k - 75k:| Murrieta Hot Springs: | 8.5% (4,899) |
| State: | 8.8% (71,895) |
Number of households with income $75k - 100k:| Murrieta Hot Springs: | 13.3% (7,632) |
| California: | 11.9% (96,893) |
Number of households with income $100k - 125k:| Murrieta Hot Springs: | 13.0% (7,444) |
| State: | 8.7% (70,729) |
Number of households with income $125k - 150k:| Murrieta Hot Springs: | 6.8% (3,911) |
| California: | 6.3% (51,211) |
Number of households with income $150k - 200k:| Murrieta Hot Springs: | 9.2% (5,272) |
| State: | 7.2% (58,687) |
Number of households with income > $200k:| Murrieta Hot Springs: | 10.6% (6,095) |
| State: | 9.3% (75,487) |
Aggregate household income in Murrieta Hot Springs in 2022: $3,629,233
Median family income in Murrieta Hot Springs in 2022:| Murrieta Hot Springs: | $63,668 |
| State: | $77,263 |
Number of families with income $20k - 30k:| Murrieta Hot Springs: | 17.4% (4) |
| State: | 5.6% (25,755) |
Number of families with income $30k - 40k:| Murrieta Hot Springs: | 19.9% (4) |
| California: | 6.8% (30,948) |
Number of families with income $40k - 50k:| Murrieta Hot Springs: | 62.7% (13) |
| State: | 8.3% (38,171) |
Median per capita income in Murrieta Hot Springs in 2022:| Murrieta Hot Springs: | $30,860 |
| State: | $36,708 |
Change in median per capita income between 2000 and 2022:| Murrieta Hot Springs, California: | +132.5% |
| State: | +110.4% |
Income statistics for Asian residents
Median household income in Murrieta Hot Springs, CA in 2022:| Murrieta Hot Springs: | $431,426 |
| State: | $119,861 |
Change in median household income between 2000 and 2022:| Murrieta Hot Springs, California: | +115.7% |
| State: | +116.5% |
Number of households with income < $10k:| Murrieta Hot Springs: | 4.6% (9,347) |
| State: | 5.1% (106,273) |
Number of households with income $10k - 20k:| Murrieta Hot Springs: | 2.9% (5,868) |
| California: | 4.9% (101,815) |
Number of households with income $20k - 30k:| Murrieta Hot Springs: | 6.1% (12,431) |
| State: | 4.6% (94,414) |
Number of households with income $30k - 40k:| Murrieta Hot Springs: | 4.8% (9,815) |
| California: | 4.1% (84,491) |
Number of households with income $40k - 50k:| Murrieta Hot Springs: | 6.5% (13,091) |
| State: | 4.0% (81,758) |
Number of households with income $50k - 60k:| Murrieta Hot Springs: | 4.1% (8,279) |
| California: | 3.9% (80,971) |
Number of households with income $60k - 75k:| Murrieta Hot Springs: | 7.3% (14,846) |
| State: | 6.0% (124,194) |
Number of households with income $75k - 100k:| Murrieta Hot Springs: | 8.9% (18,090) |
| California: | 9.7% (200,337) |
Number of households with income $100k - 125k:| Murrieta Hot Springs: | 12.8% (25,886) |
| California: | 9.4% (193,488) |
Number of households with income $125k - 150k:| Murrieta Hot Springs: | 11.9% (24,190) |
| State: | 7.7% (158,253) |
Number of households with income $150k - 200k:| Murrieta Hot Springs: | 13.9% (28,262) |
| California: | 12.2% (252,139) |
Number of households with income > $200k:| Murrieta Hot Springs: | 16.1% (32,642) |
| California: | 28.4% (586,641) |
Aggregate household income in Murrieta Hot Springs in 2022: $16,412,478
Median family income in Murrieta Hot Springs in 2022:| Murrieta Hot Springs: | $398,856 |
| California: | $136,040 |
Number of families with income $40k - 50k:| Murrieta Hot Springs: | 4.7% (9) |
| State: | 3.9% (58,471) |
Number of families with income > $200k:| Murrieta Hot Springs: | 95.3% (178) |
| State: | 32.5% (489,303) |
Median per capita income in Murrieta Hot Springs in 2022:| Murrieta Hot Springs: | $119,227 |
| State: | $58,824 |
Change in median per capita income between 2000 and 2022:| Murrieta Hot Springs, California: | +104.0% |
| California: | +166.8% |
Income statistics for Hispanic or Latino residents
Median household income in Murrieta Hot Springs, CA in 2022:| Murrieta Hot Springs: | $58,417 |
| State: | $75,698 |
Change in median household income between 2000 and 2022:| Murrieta Hot Springs, California: | +126.6% |
| California: | +107.2% |
Number of households with income < $10k:| Murrieta Hot Springs: | 3.7% (8,244) |
| California: | 4.3% (183,294) |
Number of households with income $10k - 20k:| Murrieta Hot Springs: | 4.5% (10,115) |
| California: | 6.0% (253,903) |
Number of households with income $20k - 30k:| Murrieta Hot Springs: | 5.7% (12,866) |
| California: | 6.8% (286,386) |
Number of households with income $30k - 40k:| Murrieta Hot Springs: | 7.3% (16,345) |
| State: | 7.4% (313,728) |
Number of households with income $40k - 50k:| Murrieta Hot Springs: | 6.5% (14,538) |
| State: | 7.4% (313,199) |
Number of households with income $50k - 60k:| Murrieta Hot Springs: | 7.3% (16,486) |
| State: | 7.2% (305,366) |
Number of households with income $60k - 75k:| Murrieta Hot Springs: | 9.4% (21,136) |
| State: | 10.3% (434,937) |
Number of households with income $75k - 100k:| Murrieta Hot Springs: | 15.8% (35,632) |
| State: | 14.4% (607,302) |
Number of households with income $100k - 125k:| Murrieta Hot Springs: | 12.5% (28,054) |
| California: | 10.6% (447,424) |
Number of households with income $125k - 150k:| Murrieta Hot Springs: | 9.0% (20,227) |
| State: | 7.5% (316,022) |
Number of households with income $150k - 200k:| Murrieta Hot Springs: | 11.0% (24,835) |
| State: | 9.2% (386,269) |
Number of households with income > $200k:| Murrieta Hot Springs: | 7.3% (16,330) |
| State: | 8.8% (372,651) |
Aggregate household income in Murrieta Hot Springs in 2022: $28,656,887
Median family income in Murrieta Hot Springs in 2022:| Murrieta Hot Springs: | $45,496 |
| State: | $77,589 |
Number of families with income < $10k:| Murrieta Hot Springs: | 3.4% (25) |
| State: | 3.9% (129,468) |
Number of families with income $10k - 20k:| Murrieta Hot Springs: | 7.5% (55) |
| State: | 4.6% (151,997) |
Number of families with income $20k - 30k:| Murrieta Hot Springs: | 10.7% (79) |
| State: | 6.6% (216,764) |
Number of families with income $30k - 40k:| Murrieta Hot Springs: | 13.8% (101) |
| State: | 7.6% (249,849) |
Number of families with income $40k - 50k:| Murrieta Hot Springs: | 8.1% (60) |
| State: | 7.7% (254,822) |
Number of families with income $50k - 60k:| Murrieta Hot Springs: | 7.3% (54) |
| State: | 7.4% (244,815) |
Number of families with income $60k - 75k:| Murrieta Hot Springs: | 4.7% (35) |
| State: | 10.5% (345,838) |
Number of families with income $75k - 100k:| Murrieta Hot Springs: | 3.0% (22) |
| State: | 14.9% (491,589) |
Number of families with income $100k - 125k:| Murrieta Hot Springs: | 8.0% (58) |
| California: | 10.7% (355,400) |
Number of families with income $150k - 200k:| Murrieta Hot Springs: | 30.5% (224) |
| State: | 9.3% (306,566) |
Number of families with income > $200k:| Murrieta Hot Springs: | 3.0% (22) |
| State: | 9.1% (299,984) |
Median non-family income in Murrieta Hot Springs in 2022:| Murrieta Hot Springs: | $135,409 |
| State: | $49,746 |
Change in median non-family income between 2000 and 2022:| Murrieta Hot Springs, California: | +97.0% |
| California: | +100.7% |
Median per capita income in Murrieta Hot Springs in 2022:| Murrieta Hot Springs: | $28,372 |
| State: | $27,240 |
Change in median per capita income between 2000 and 2022:| Murrieta Hot Springs, California: | +141.6% |
| State: | +133.3% |
Income statistics for American Indian and Alaska Native residents
Median household income in Murrieta Hot Springs, CA in 2022:| Murrieta Hot Springs: | $113,390 |
| State: | $76,752 |
Change in median household income between 2000 and 2022:| Murrieta Hot Springs, California: | +101.6% |
| State: | +110.0% |
Number of households with income < $10k:| Murrieta Hot Springs: | 8.5% (1,398) |
| State: | 5.4% (8,471) |
Number of households with income $10k - 20k:| Murrieta Hot Springs: | 4.5% (735) |
| State: | 6.0% (9,381) |
Number of households with income $20k - 30k:| Murrieta Hot Springs: | 2.2% (360) |
| State: | 5.5% (8,668) |
Number of households with income $30k - 40k:| Murrieta Hot Springs: | 5.6% (918) |
| State: | 8.3% (13,030) |
Number of households with income $40k - 50k:| Murrieta Hot Springs: | 5.8% (953) |
| California: | 6.9% (10,908) |
Number of households with income $50k - 60k:| Murrieta Hot Springs: | 13.0% (2,137) |
| California: | 7.1% (11,198) |
Number of households with income $60k - 75k:| Murrieta Hot Springs: | 9.1% (1,485) |
| State: | 9.6% (15,190) |
Number of households with income $75k - 100k:| Murrieta Hot Springs: | 15.5% (2,540) |
| California: | 14.1% (22,274) |
Number of households with income $100k - 125k:| Murrieta Hot Springs: | 9.6% (1,581) |
| State: | 11.2% (17,643) |
Number of households with income $125k - 150k:| Murrieta Hot Springs: | 6.0% (989) |
| State: | 8.3% (13,117) |
Number of households with income $150k - 200k:| Murrieta Hot Springs: | 10.1% (1,654) |
| State: | 8.8% (13,853) |
Number of households with income > $200k:| Murrieta Hot Springs: | 10.1% (1,653) |
| State: | 8.8% (13,925) |
Aggregate household income in Murrieta Hot Springs in 2022: $1,974,558
Median family income in Murrieta Hot Springs in 2022:| Murrieta Hot Springs: | $113,703 |
| California: | $81,108 |
Number of families with income $50k - 60k:| Murrieta Hot Springs: | 100.0% (24) |
| State: | 6.9% (7,834) |
Median per capita income in Murrieta Hot Springs in 2022:| Murrieta Hot Springs: | $58,524 |
| State: | $30,289 |
Change in median per capita income between 2000 and 2022:| Murrieta Hot Springs, California: | +133.6% |
| State: | +98.9% |
Income statistics for Multirace residents
Median household income in Murrieta Hot Springs, CA in 2022:| Murrieta Hot Springs: | $362,247 |
| State: | $83,153 |
Change in median household income between 2000 and 2022:| Murrieta Hot Springs, California: | +104.2% |
| California: | +106.0% |
Number of households with income < $10k:| Murrieta Hot Springs: | 4.2% (25,219) |
| State: | 4.2% (85,299) |
Number of households with income $10k - 20k:| Murrieta Hot Springs: | 4.7% (28,448) |
| State: | 6.1% (122,966) |
Number of households with income $20k - 30k:| Murrieta Hot Springs: | 5.5% (33,553) |
| California: | 6.4% (129,328) |
Number of households with income $30k - 40k:| Murrieta Hot Springs: | 7.8% (47,143) |
| State: | 6.4% (130,070) |
Number of households with income $40k - 50k:| Murrieta Hot Springs: | 7.2% (43,588) |
| California: | 6.5% (131,254) |
Number of households with income $50k - 60k:| Murrieta Hot Springs: | 7.3% (44,012) |
| State: | 6.5% (132,382) |
Number of households with income $60k - 75k:| Murrieta Hot Springs: | 8.9% (54,060) |
| State: | 9.4% (191,472) |
Number of households with income $75k - 100k:| Murrieta Hot Springs: | 15.1% (91,391) |
| California: | 13.3% (269,691) |
Number of households with income $100k - 125k:| Murrieta Hot Springs: | 10.7% (64,707) |
| State: | 10.2% (207,286) |
Number of households with income $125k - 150k:| Murrieta Hot Springs: | 8.9% (53,900) |
| California: | 7.8% (158,259) |
Number of households with income $150k - 200k:| Murrieta Hot Springs: | 10.2% (62,072) |
| State: | 10.3% (209,227) |
Number of households with income > $200k:| Murrieta Hot Springs: | 9.7% (58,964) |
| State: | 13.0% (263,210) |
Aggregate household income in Murrieta Hot Springs in 2022: $30,336,939
Median family income in Murrieta Hot Springs in 2022:| Murrieta Hot Springs: | $372,685 |
| State: | $87,642 |
Number of families with income $150k - 200k:| Murrieta Hot Springs: | 100.0% (623) |
| State: | 10.9% (161,643) |
Median per capita income in Murrieta Hot Springs in 2022:| Murrieta Hot Springs: | $48,481 |
| State: | $32,124 |
Change in median per capita income between 2000 and 2022:| Murrieta Hot Springs, California: | +142.3% |
| State: | +120.4% |
Income statistics for other residents
Number of households with income < $10k:| Murrieta Hot Springs: | 3.0% (327) |
| California: | 4.6% (93,035) |
Number of households with income $10k - 20k:| Murrieta Hot Springs: | 4.4% (471) |
| California: | 6.3% (126,222) |
Number of households with income $20k - 30k:| Murrieta Hot Springs: | 6.1% (654) |
| State: | 7.1% (142,656) |
Number of households with income $30k - 40k:| Murrieta Hot Springs: | 7.3% (791) |
| State: | 8.2% (165,018) |
Number of households with income $40k - 50k:| Murrieta Hot Springs: | 6.8% (735) |
| California: | 8.0% (161,732) |
Number of households with income $50k - 60k:| Murrieta Hot Springs: | 6.8% (736) |
| California: | 7.6% (152,152) |
Number of households with income $60k - 75k:| Murrieta Hot Springs: | 10.3% (1,110) |
| California: | 10.4% (209,951) |
Number of households with income $75k - 100k:| Murrieta Hot Springs: | 15.3% (1,644) |
| State: | 14.7% (296,102) |
Number of households with income $100k - 125k:| Murrieta Hot Springs: | 13.1% (1,413) |
| California: | 10.7% (214,281) |
Number of households with income $125k - 150k:| Murrieta Hot Springs: | 8.2% (885) |
| California: | 7.1% (143,092) |
Number of households with income $150k - 200k:| Murrieta Hot Springs: | 11.5% (1,239) |
| State: | 8.6% (172,215) |
Number of households with income > $200k:| Murrieta Hot Springs: | 7.2% (771) |
| State: | 6.7% (134,102) |
Median family income in Murrieta Hot Springs in 2022:| Murrieta Hot Springs: | $5,869 |
| State: | $72,756 |
Number of families with income < $10k:| Murrieta Hot Springs: | 100.0% (12) |
| California: | 4.3% (69,090) |
Median per capita income in Murrieta Hot Springs in 2022:| Murrieta Hot Springs: | $12,117 |
| State: | $25,164 |
Change in median per capita income between 2000 and 2022:| Murrieta Hot Springs, California: | +141.4% |
| State: | +137.9% |