The median household income in New Hope, VA in 2022 was $85,490, which was about the same as the median annual income of $85,873 across the entire state of Virginia. Compared to the median income of $43,045 in 2000 this represents an increase of 49.6%. The per capita income in 2022 was $35,956, which means an increase of 45.1% compared to 2000 when it was $19,744.
Whole page based on the data from 2000 / 2022 when the population of New Hope, Virginia was 797 / 935
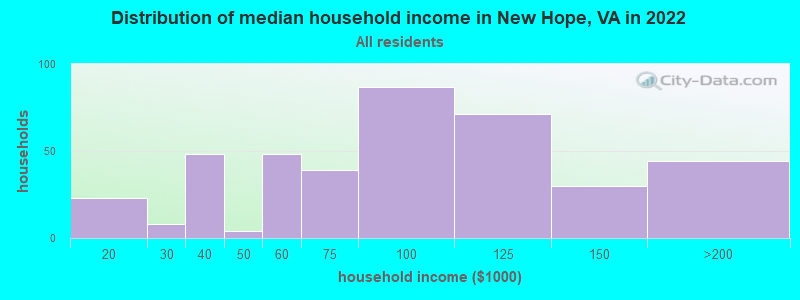
Income statistics for all residents
Median household income in New Hope, VA in 2022:
New Hope:
$85,491
State:
$85,873
Change in median household income between 2000 and 2022:
New Hope, Virginia:
+98.6%
State:
+84.0%
Number of households with income < $10k:
New Hope:
0.0% (0)
Virginia:
4.9% (165,315)
Number of households with income $10k - 20k:
New Hope:
5.7% (23)
Virginia:
5.9% (199,380)
Number of households with income $20k - 30k:
New Hope:
2.0% (8)
Virginia:
6.0% (202,243)
Number of households with income $30k - 40k:
New Hope:
11.9% (48)
Virginia:
6.1% (205,967)
Number of households with income $40k - 50k:
New Hope:
1.0% (4)
Virginia:
6.4% (215,648)
Number of households with income $50k - 60k:
New Hope:
11.9% (48)
State:
6.2% (210,516)
Number of households with income $60k - 75k:
New Hope:
9.7% (39)
State:
8.6% (292,112)
Number of households with income $75k - 100k:
New Hope:
21.6% (87)
State:
12.2% (412,198)
Number of households with income $100k - 125k:
New Hope:
17.7% (71)
Virginia:
10.3% (348,998)
Number of households with income $125k - 150k:
New Hope:
7.5% (30)
State:
7.7% (261,236)
Number of households with income $150k - 200k:
New Hope:
10.9% (44)
State:
10.3% (347,282)
Number of households with income > $200k:
New Hope:
0.0% (0)
Virginia:
15.4% (519,712)
Aggregate household income in New Hope in 2022: $33,160,799
Median family income in New Hope in 2022:
New Hope:
$81,482
Virginia:
$107,101
Number of families with income $30k - 40k:
New Hope:
19.9% (48)
State:
4.7% (103,002)
Number of families with income $40k - 50k:
New Hope:
1.6% (4)
Virginia:
5.4% (118,579)
Number of families with income $50k - 60k:
New Hope:
4.2% (10)
Virginia:
5.5% (120,924)
Number of families with income $75k - 100k:
New Hope:
30.2% (73)
State:
12.6% (277,221)
Number of families with income $100k - 125k:
New Hope:
14.4% (35)
State:
11.3% (248,485)
Number of families with income $125k - 150k:
New Hope:
10.5% (25)
State:
9.0% (197,999)
Number of families with income $150k - 200k:
New Hope:
19.3% (47)
Virginia:
12.7% (278,323)
Median income for 3 person families:
New Hope:
$102,534
State:
$112,281
Median income for families with 0 earners:
New Hope:
$0
State:
$56,573
Median income for families with 1 earner:
New Hope:
$0
State:
$72,761
Median income for families with 2 earners:
New Hope:
$76,320
State:
$135,708
Median income for families with 3+ earners:
New Hope:
$0
State:
$161,746
Median non-family income in New Hope in 2022:
New Hope:
$67,885
State:
$51,436
Median per capita income in New Hope in 2022:
New Hope:
$35,957
Virginia:
$47,199
Change in median per capita income between 2000 and 2022:
New Hope, Virginia:
+82.1%
State:
+96.9%
Income statistics for White residents
Median household income in New Hope, VA in 2022:
New Hope:
$81,698
Virginia:
$91,924
Change in median household income between 2000 and 2022:
New Hope, Virginia:
+88.0%
State:
+81.9%
Number of households with income < $10k:
New Hope:
0.0% (0)
State:
4.1% (90,549)
Number of households with income $10k - 20k:
New Hope:
5.6% (22)
State:
5.2% (114,324)
Number of households with income $20k - 30k:
New Hope:
2.1% (8)
State:
5.7% (125,676)
Number of households with income $30k - 40k:
New Hope:
12.6% (49)
State:
5.5% (121,220)
Number of households with income $40k - 50k:
New Hope:
1.0% (4)
Virginia:
6.0% (133,011)
Number of households with income $50k - 60k:
New Hope:
11.8% (46)
Virginia:
6.2% (136,856)
Number of households with income $60k - 75k:
New Hope:
10.3% (40)
State:
8.4% (186,094)
Number of households with income $75k - 100k:
New Hope:
20.3% (79)
Virginia:
12.5% (277,077)
Number of households with income $100k - 125k:
New Hope:
17.2% (67)
Virginia:
10.8% (237,562)
Number of households with income $125k - 150k:
New Hope:
7.7% (30)
Virginia:
8.0% (177,532)
Number of households with income $150k - 200k:
New Hope:
11.5% (45)
State:
11.0% (242,106)
Number of households with income > $200k:
New Hope:
0.0% (0)
Virginia:
16.6% (366,064)
Aggregate household income in New Hope in 2022: $32,568,433
Median family income in New Hope in 2022:
New Hope:
$81,512
State:
$114,708
Number of families with income $30k - 40k:
New Hope:
21.8% (52)
State:
3.8% (53,514)
Number of families with income $40k - 50k:
New Hope:
1.7% (4)
Virginia:
4.7% (66,206)
Number of families with income $50k - 60k:
New Hope:
4.3% (10)
Virginia:
5.2% (74,438)
Number of families with income $75k - 100k:
New Hope:
28.1% (66)
State:
12.9% (183,581)
Number of families with income $100k - 125k:
New Hope:
13.7% (32)
Virginia:
11.9% (168,950)
Number of families with income $125k - 150k:
New Hope:
10.5% (25)
State:
9.5% (134,452)
Number of families with income $150k - 200k:
New Hope:
19.9% (47)
State:
13.8% (195,800)
Median non-family income in New Hope in 2022:
New Hope:
$65,727
State:
$53,785
Median per capita income in New Hope in 2022:
New Hope:
$36,335
State:
$53,456
Change in median per capita income between 2000 and 2022:
New Hope, Virginia:
+81.3%
State:
+99.2%
Income statistics for Hispanic or Latino residents
Median per capita income in New Hope in 2022:
New Hope:
$32,519
State:
$32,277
Change in median per capita income between 2000 and 2022:
New Hope, Virginia:
+120.2%
Virginia:
+104.6%
Income statistics for Multirace residents
Median per capita income in New Hope in 2022:
New Hope:
$22,847
State:
$34,385
Change in median per capita income between 2000 and 2022:
New Hope, Virginia:
+99.1%
Virginia:
+130.2%
Discuss New Hope, Virginia (VA) on our hugely popular Virginia forum.