New Salem-Buffington, Pennsylvania (PA) income map, earnings map, and wages data
The median household income in New Salem-Buffington, PA in 2022 was $54,461, which was 31.8% less than the median annual income of $71,798 across the entire state of Pennsylvania. Compared to the median income of $28,875 in 2000 this represents an increase of 47.0%. The per capita income in 2022 was $27,862, which means an increase of 51.5% compared to 2000 when it was $13,508.
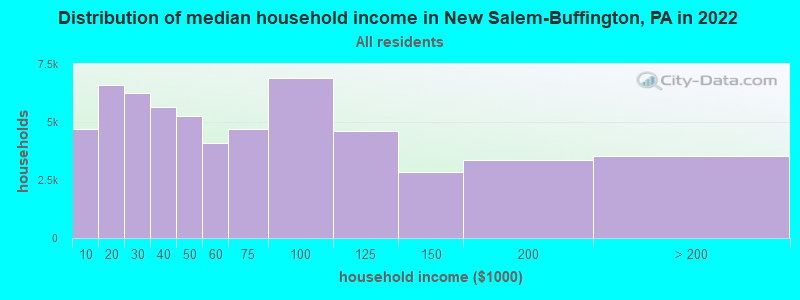
Income statistics for all residents
Median household income in New Salem-Buffington, PA in 2022:| New Salem-Buffington: | $54,462 |
| Pennsylvania: | $71,798 |
Change in median household income between 2000 and 2022:| New Salem-Buffington, Pennsylvania: | +88.6% |
| State: | +79.0% |
Number of households with income < $10k:| New Salem-Buffington: | 8.0% (4,698) |
| State: | 5.5% (291,562) |
Number of households with income $10k - 20k:| New Salem-Buffington: | 11.3% (6,613) |
| State: | 7.3% (384,726) |
Number of households with income $20k - 30k:| New Salem-Buffington: | 10.7% (6,255) |
| State: | 7.4% (389,464) |
Number of households with income $30k - 40k:| New Salem-Buffington: | 9.7% (5,668) |
| Pennsylvania: | 7.6% (402,138) |
Number of households with income $40k - 50k:| New Salem-Buffington: | 9.0% (5,256) |
| State: | 7.3% (387,945) |
Number of households with income $50k - 60k:| New Salem-Buffington: | 7.0% (4,080) |
| Pennsylvania: | 7.0% (372,468) |
Number of households with income $60k - 75k:| New Salem-Buffington: | 8.0% (4,706) |
| Pennsylvania: | 9.9% (524,786) |
Number of households with income $75k - 100k:| New Salem-Buffington: | 11.8% (6,899) |
| Pennsylvania: | 12.6% (666,253) |
Number of households with income $100k - 125k:| New Salem-Buffington: | 7.9% (4,620) |
| State: | 9.9% (526,402) |
Number of households with income $125k - 150k:| New Salem-Buffington: | 4.9% (2,857) |
| State: | 6.9% (362,702) |
Number of households with income $150k - 200k:| New Salem-Buffington: | 5.8% (3,367) |
| Pennsylvania: | 8.3% (440,827) |
Number of households with income > $200k:| New Salem-Buffington: | 6.0% (3,526) |
| Pennsylvania: | 10.3% (544,792) |
Aggregate household income in New Salem-Buffington in 2022: $20,768,141
Median family income in New Salem-Buffington in 2022:| New Salem-Buffington: | $72,418 |
| State: | $93,029 |
Median non-family income in New Salem-Buffington in 2022:| New Salem-Buffington: | $36,013 |
| State: | $42,203 |
Change in median non-family income between 2000 and 2022:| New Salem-Buffington, Pennsylvania: | +100.4% |
| Pennsylvania: | +90.1% |
Median per capita income in New Salem-Buffington in 2022:| New Salem-Buffington: | $27,862 |
| State: | $41,489 |
Change in median per capita income between 2000 and 2022:| New Salem-Buffington, Pennsylvania: | +106.3% |
| Pennsylvania: | +98.7% |
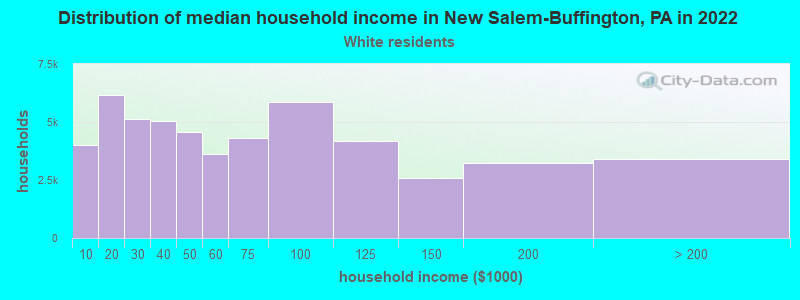
Income statistics for White residents
Median household income in New Salem-Buffington, PA in 2022:| New Salem-Buffington: | $54,889 |
| Pennsylvania: | $76,765 |
Change in median household income between 2000 and 2022:| New Salem-Buffington, Pennsylvania: | +89.3% |
| State: | +84.3% |
Number of households with income < $10k:| New Salem-Buffington: | 7.7% (4,007) |
| State: | 4.3% (179,792) |
Number of households with income $10k - 20k:| New Salem-Buffington: | 11.8% (6,168) |
| State: | 6.5% (268,738) |
Number of households with income $20k - 30k:| New Salem-Buffington: | 9.9% (5,142) |
| State: | 7.0% (288,138) |
Number of households with income $30k - 40k:| New Salem-Buffington: | 9.7% (5,054) |
| State: | 7.2% (300,208) |
Number of households with income $40k - 50k:| New Salem-Buffington: | 8.8% (4,566) |
| Pennsylvania: | 7.2% (298,756) |
Number of households with income $50k - 60k:| New Salem-Buffington: | 6.9% (3,616) |
| Pennsylvania: | 6.8% (283,251) |
Number of households with income $60k - 75k:| New Salem-Buffington: | 8.3% (4,303) |
| State: | 9.9% (408,159) |
Number of households with income $75k - 100k:| New Salem-Buffington: | 11.3% (5,880) |
| Pennsylvania: | 13.2% (547,809) |
Number of households with income $100k - 125k:| New Salem-Buffington: | 8.0% (4,184) |
| Pennsylvania: | 10.5% (436,652) |
Number of households with income $125k - 150k:| New Salem-Buffington: | 4.9% (2,567) |
| State: | 7.3% (304,132) |
Number of households with income $150k - 200k:| New Salem-Buffington: | 6.2% (3,220) |
| State: | 9.0% (374,658) |
Number of households with income > $200k:| New Salem-Buffington: | 6.5% (3,391) |
| State: | 10.9% (452,618) |
Aggregate household income in New Salem-Buffington in 2022: $18,471,942
Median family income in New Salem-Buffington in 2022:| New Salem-Buffington: | $72,731 |
| State: | $99,396 |
Number of families with income < $10k:| New Salem-Buffington: | 4.9% (7) |
| State: | 2.2% (56,136) |
Number of families with income $10k - 20k:| New Salem-Buffington: | 5.6% (8) |
| Pennsylvania: | 2.7% (69,032) |
Number of families with income $20k - 30k:| New Salem-Buffington: | 8.9% (12) |
| State: | 3.9% (100,065) |
Number of families with income $30k - 40k:| New Salem-Buffington: | 20.2% (27) |
| State: | 5.2% (134,367) |
Number of families with income $40k - 50k:| New Salem-Buffington: | 12.1% (16) |
| State: | 6.0% (154,327) |
Number of families with income $50k - 60k:| New Salem-Buffington: | 2.6% (3) |
| State: | 6.1% (157,983) |
Number of families with income $60k - 75k:| New Salem-Buffington: | 14.0% (19) |
| Pennsylvania: | 9.6% (249,292) |
Number of families with income $75k - 100k:| New Salem-Buffington: | 16.1% (22) |
| State: | 14.7% (379,316) |
Number of families with income $100k - 125k:| New Salem-Buffington: | 15.4% (21) |
| State: | 12.9% (333,626) |
Median non-family income in New Salem-Buffington in 2022:| New Salem-Buffington: | $34,565 |
| State: | $44,251 |
Change in median non-family income between 2000 and 2022:| New Salem-Buffington, Pennsylvania: | +92.4% |
| Pennsylvania: | +94.2% |
Median per capita income in New Salem-Buffington in 2022:| New Salem-Buffington: | $29,057 |
| Pennsylvania: | $45,306 |
Change in median per capita income between 2000 and 2022:| New Salem-Buffington, Pennsylvania: | +114.0% |
| State: | +105.4% |
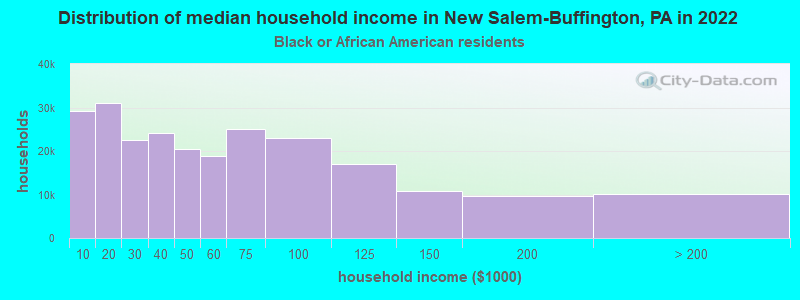
Income statistics for Black or African American residents
Median household income in New Salem-Buffington, PA in 2022:| New Salem-Buffington: | $40,680 |
| State: | $46,564 |
Change in median household income between 2000 and 2022:| New Salem-Buffington, Pennsylvania: | +64.4% |
| Pennsylvania: | +69.8% |
Number of households with income < $10k:| New Salem-Buffington: | 12.0% (29,114) |
| Pennsylvania: | 12.0% (64,705) |
Number of households with income $10k - 20k:| New Salem-Buffington: | 12.8% (30,941) |
| State: | 12.7% (68,459) |
Number of households with income $20k - 30k:| New Salem-Buffington: | 9.3% (22,510) |
| Pennsylvania: | 9.3% (49,778) |
Number of households with income $30k - 40k:| New Salem-Buffington: | 10.0% (24,204) |
| State: | 10.0% (53,629) |
Number of households with income $40k - 50k:| New Salem-Buffington: | 8.5% (20,447) |
| State: | 8.5% (45,601) |
Number of households with income $50k - 60k:| New Salem-Buffington: | 7.8% (18,867) |
| Pennsylvania: | 7.8% (41,725) |
Number of households with income $60k - 75k:| New Salem-Buffington: | 10.4% (25,062) |
| State: | 10.4% (55,653) |
Number of households with income $75k - 100k:| New Salem-Buffington: | 9.5% (23,006) |
| Pennsylvania: | 9.5% (51,281) |
Number of households with income $100k - 125k:| New Salem-Buffington: | 7.0% (16,998) |
| State: | 7.1% (38,125) |
Number of households with income $125k - 150k:| New Salem-Buffington: | 4.5% (10,794) |
| State: | 4.5% (24,172) |
Number of households with income $150k - 200k:| New Salem-Buffington: | 4.0% (9,682) |
| State: | 4.0% (21,749) |
Number of households with income > $200k:| New Salem-Buffington: | 4.2% (10,128) |
| State: | 4.2% (22,562) |
Aggregate household income in New Salem-Buffington in 2022: $119,824
Median family income in New Salem-Buffington in 2022:| New Salem-Buffington: | $45,077 |
| State: | $61,391 |
Median per capita income in New Salem-Buffington in 2022:| New Salem-Buffington: | $13,724 |
| State: | $28,010 |
Change in median per capita income between 2000 and 2022:| New Salem-Buffington, Pennsylvania: | +18.9% |
| State: | +101.5% |