New Territory, Texas (TX) income map, earnings map, and wages data
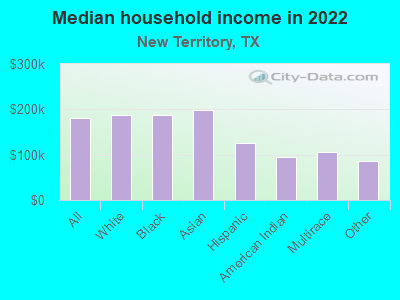
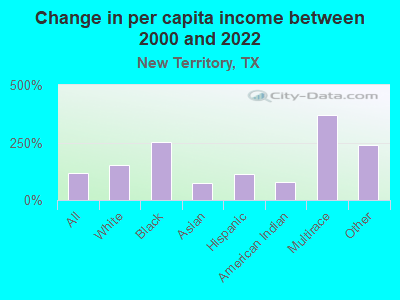
The median household income in New Territory, TX in 2022 was $181,447, which was 60.2% greater than the median annual income of $72,284 across the entire state of Texas. Compared to the median income of $93,972 in 2000 this represents an increase of 48.2%. The per capita income in 2022 was $63,594, which means an increase of 53.9% compared to 2000 when it was $29,341.
Whole page based on the data from 2000 / 2022 when the population of New Territory, Texas was 13,861 / 18,257
Income statistics for all residents
Median household income in New Territory, TX in 2022:| New Territory: | $181,447 |
| State: | $72,284 |
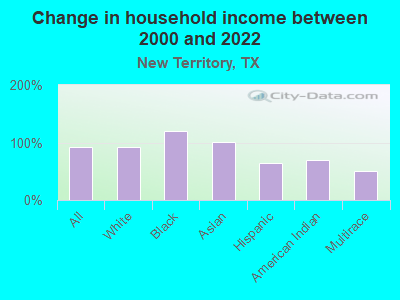
Change in median household income between 2000 and 2022:| New Territory, Texas: | +93.1% |
| Texas: | +81.0% |
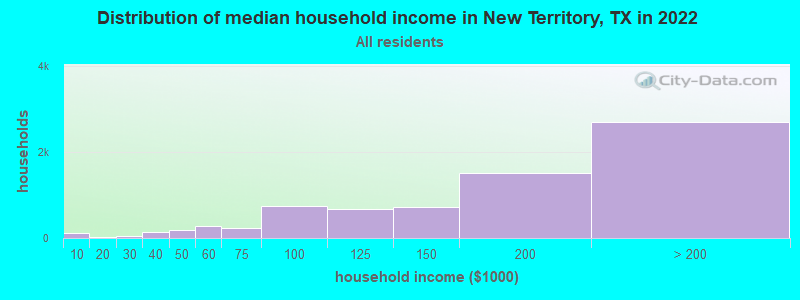
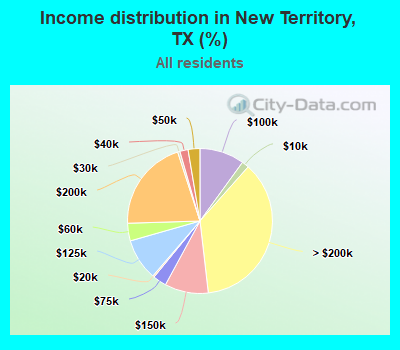
Number of households with income < $10k:| New Territory: | 1.6% (118) |
| Texas: | 5.5% (611,011) |
Number of households with income $10k - 20k:| New Territory: | 0.4% (27) |
| State: | 6.7% (743,157) |
Number of households with income $20k - 30k:| New Territory: | 0.5% (38) |
| State: | 7.2% (803,381) |
Number of households with income $30k - 40k:| New Territory: | 1.8% (135) |
| State: | 7.8% (866,080) |
Number of households with income $40k - 50k:| New Territory: | 2.6% (194) |
| State: | 7.3% (810,440) |
Number of households with income $50k - 60k:| New Territory: | 3.9% (291) |
| State: | 7.2% (799,783) |
Number of households with income $60k - 75k:| New Territory: | 3.0% (223) |
| State: | 9.9% (1,095,384) |
Number of households with income $75k - 100k:| New Territory: | 10.0% (738) |
| Texas: | 12.8% (1,419,057) |
Number of households with income $100k - 125k:| New Territory: | 9.3% (685) |
| State: | 9.5% (1,054,577) |
Number of households with income $125k - 150k:| New Territory: | 9.7% (720) |
| State: | 6.7% (741,518) |
Number of households with income $150k - 200k:| New Territory: | 20.5% (1,515) |
| Texas: | 8.7% (961,776) |
Number of households with income > $200k:| New Territory: | 36.6% (2,701) |
| State: | 10.7% (1,181,544) |
Aggregate household income in New Territory in 2022: $1,175,280,953
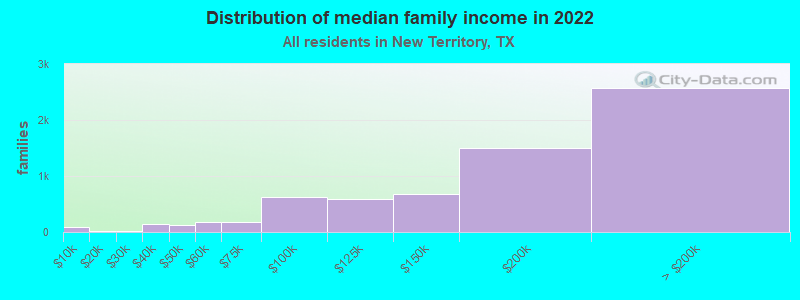
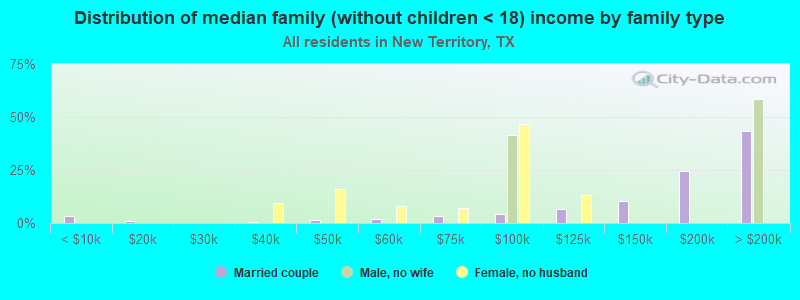
Median family income in New Territory in 2022:| New Territory: | $190,626 |
| State: | $86,267 |
Number of families with income < $10k:| New Territory: | 1.4% (91) |
| Texas: | 4.0% (297,884) |
Number of families with income $10k - 20k:| New Territory: | 0.3% (20) |
| Texas: | 4.3% (324,514) |
Number of families with income $20k - 30k:| New Territory: | 0.3% (20) |
| State: | 5.8% (430,949) |
Number of families with income $30k - 40k:| New Territory: | 2.0% (135) |
| Texas: | 6.6% (493,535) |
Number of families with income $40k - 50k:| New Territory: | 1.8% (122) |
| Texas: | 6.7% (499,663) |
Number of families with income $50k - 60k:| New Territory: | 2.7% (183) |
| State: | 6.6% (492,203) |
Number of families with income $60k - 75k:| New Territory: | 2.7% (181) |
| State: | 9.5% (710,229) |
Number of families with income $75k - 100k:| New Territory: | 9.3% (625) |
| Texas: | 13.6% (1,015,480) |
Number of families with income $100k - 125k:| New Territory: | 8.7% (584) |
| Texas: | 10.7% (797,961) |
Number of families with income $125k - 150k:| New Territory: | 10.1% (681) |
| State: | 8.1% (602,985) |
Number of families with income $150k - 200k:| New Territory: | 22.4% (1,504) |
| Texas: | 10.7% (804,459) |
Number of families with income > $200k:| New Territory: | 38.3% (2,580) |
| State: | 13.5% (1,013,514) |
Median non-family income in New Territory in 2022:| New Territory: | $70,469 |
| Texas: | $45,999 |
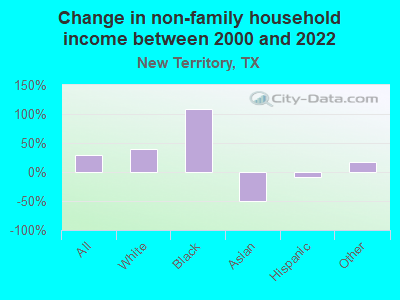
Change in median non-family income between 2000 and 2022:| New Territory, Texas: | +29.0% |
| State: | +79.5% |
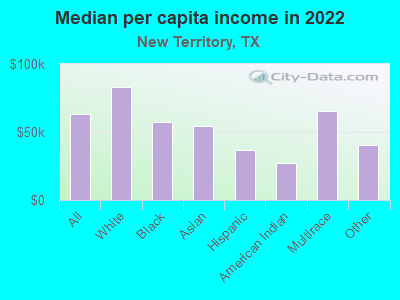
Median per capita income in New Territory in 2022:| New Territory: | $63,594 |
| State: | $38,123 |
Change in median per capita income between 2000 and 2022:| New Territory, Texas: | +116.7% |
| State: | +94.3% |
Income statistics for White residents
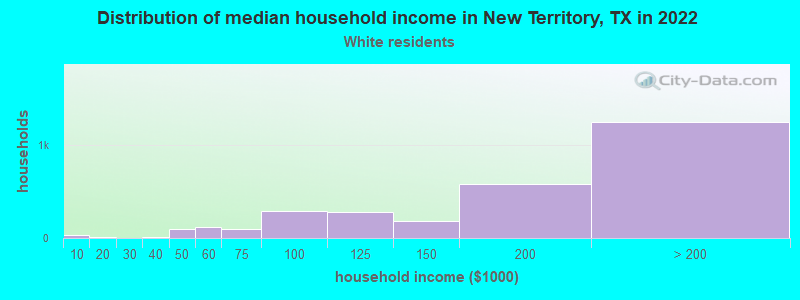
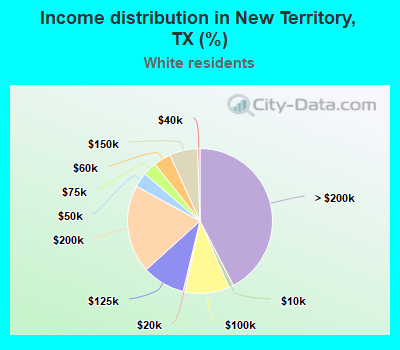
Median household income in New Territory, TX in 2022:| New Territory: | $187,690 |
| State: | $82,032 |
Change in median household income between 2000 and 2022:| New Territory, Texas: | +92.6% |
| State: | +91.0% |
Number of households with income < $10k:| New Territory: | 1.1% (32) |
| State: | 4.7% (273,716) |
Number of households with income $10k - 20k:| New Territory: | 0.4% (12) |
| Texas: | 5.5% (322,702) |
Number of households with income $20k - 30k:| New Territory: | 0.0% (0) |
| State: | 6.2% (363,947) |
Number of households with income $30k - 40k:| New Territory: | 0.5% (15) |
| State: | 6.8% (399,275) |
Number of households with income $40k - 50k:| New Territory: | 3.3% (97) |
| State: | 6.5% (383,417) |
Number of households with income $50k - 60k:| New Territory: | 3.9% (115) |
| Texas: | 6.6% (388,535) |
Number of households with income $60k - 75k:| New Territory: | 3.1% (92) |
| State: | 9.7% (566,295) |
Number of households with income $75k - 100k:| New Territory: | 9.9% (292) |
| State: | 13.0% (760,276) |
Number of households with income $100k - 125k:| New Territory: | 9.5% (282) |
| Texas: | 10.2% (597,596) |
Number of households with income $125k - 150k:| New Territory: | 6.3% (185) |
| State: | 7.4% (436,830) |
Number of households with income $150k - 200k:| New Territory: | 19.7% (582) |
| State: | 9.9% (583,067) |
Number of households with income > $200k:| New Territory: | 42.4% (1,254) |
| State: | 13.5% (792,647) |
Aggregate household income in New Territory in 2022: $520,443,313
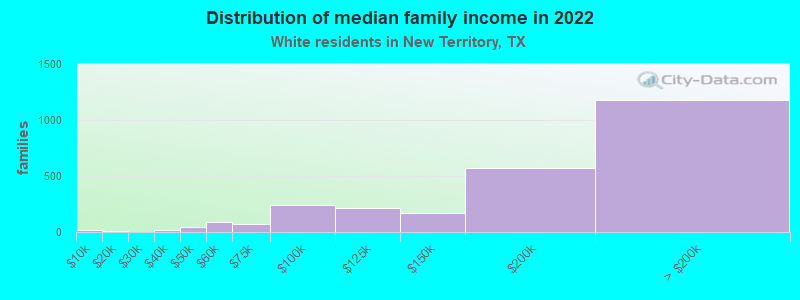
Median family income in New Territory in 2022:| New Territory: | $201,431 |
| State: | $101,788 |
Number of families with income < $10k:| New Territory: | 0.7% (19) |
| Texas: | 2.8% (108,142) |
Number of families with income $10k - 20k:| New Territory: | 0.4% (10) |
| State: | 2.9% (113,421) |
Number of families with income $30k - 40k:| New Territory: | 0.5% (14) |
| State: | 5.2% (198,847) |
Number of families with income $40k - 50k:| New Territory: | 1.7% (46) |
| State: | 5.6% (216,490) |
Number of families with income $50k - 60k:| New Territory: | 3.5% (91) |
| State: | 5.7% (220,689) |
Number of families with income $60k - 75k:| New Territory: | 2.7% (70) |
| State: | 9.0% (346,106) |
Number of families with income $75k - 100k:| New Territory: | 9.0% (237) |
| State: | 13.7% (527,363) |
Number of families with income $100k - 125k:| New Territory: | 8.3% (218) |
| State: | 11.6% (448,411) |
Number of families with income $125k - 150k:| New Territory: | 6.5% (171) |
| Texas: | 9.2% (355,798) |
Number of families with income $150k - 200k:| New Territory: | 21.8% (571) |
| State: | 12.5% (480,185) |
Number of families with income > $200k:| New Territory: | 44.9% (1,177) |
| State: | 17.6% (677,490) |
Median non-family income in New Territory in 2022:| New Territory: | $77,726 |
| State: | $50,587 |
Change in median non-family income between 2000 and 2022:| New Territory, Texas: | +39.5% |
| State: | +87.7% |
Median per capita income in New Territory in 2022:| New Territory: | $83,314 |
| Texas: | $47,740 |
Income statistics for Black or African American residents
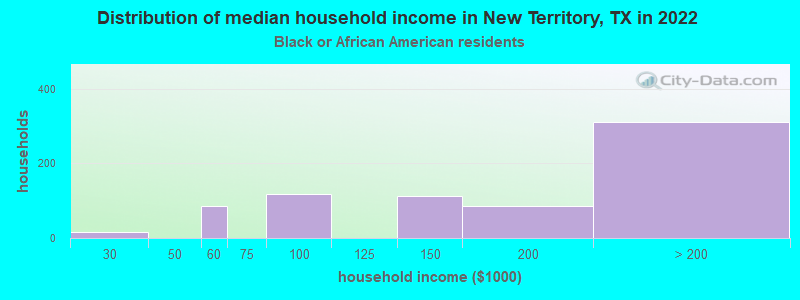
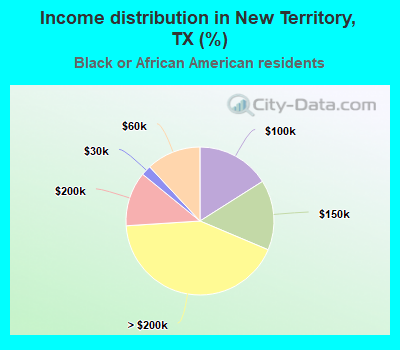
Median household income in New Territory, TX in 2022:| New Territory: | $187,282 |
| State: | $55,759 |
Change in median household income between 2000 and 2022:| New Territory, Texas: | +120.3% |
| State: | +90.3% |
Number of households with income < $10k:| New Territory: | 0.0% (0) |
| State: | 8.9% (126,378) |
Number of households with income $10k - 20k:| New Territory: | 0.0% (0) |
| Texas: | 9.9% (140,369) |
Number of households with income $20k - 30k:| New Territory: | 2.2% (16) |
| Texas: | 8.5% (120,639) |
Number of households with income $30k - 40k:| New Territory: | 0.0% (0) |
| Texas: | 9.7% (137,517) |
Number of households with income $40k - 50k:| New Territory: | 0.0% (0) |
| State: | 8.0% (112,973) |
Number of households with income $50k - 60k:| New Territory: | 11.9% (87) |
| Texas: | 8.3% (117,156) |
Number of households with income $60k - 75k:| New Territory: | 0.0% (0) |
| State: | 10.4% (147,462) |
Number of households with income $75k - 100k:| New Territory: | 16.0% (117) |
| State: | 11.5% (162,718) |
Number of households with income $100k - 125k:| New Territory: | 0.0% (0) |
| State: | 8.2% (115,829) |
Number of households with income $125k - 150k:| New Territory: | 15.3% (112) |
| State: | 4.9% (69,556) |
Number of households with income $150k - 200k:| New Territory: | 11.9% (87) |
| State: | 6.4% (90,701) |
Number of households with income > $200k:| New Territory: | 42.6% (311) |
| State: | 5.5% (77,988) |
Aggregate household income in New Territory in 2022: $97,891,520
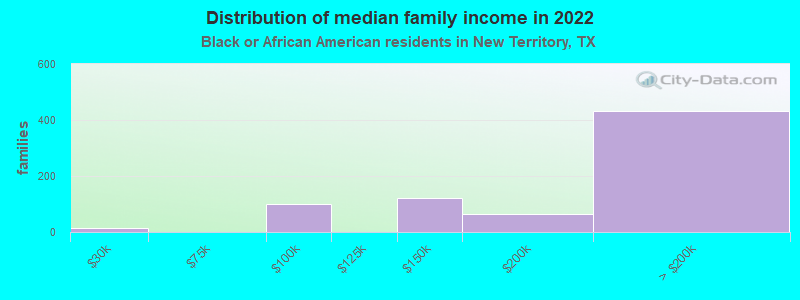
Median family income in New Territory in 2022:| New Territory: | $207,404 |
| State: | $69,134 |
Number of families with income $20k - 30k:| New Territory: | 2.2% (16) |
| State: | 7.1% (57,877) |
Number of families with income $75k - 100k:| New Territory: | 13.5% (99) |
| Texas: | 12.7% (103,723) |
Number of families with income $125k - 150k:| New Territory: | 16.6% (121) |
| State: | 6.8% (55,615) |
Number of families with income $150k - 200k:| New Territory: | 8.9% (65) |
| State: | 9.4% (76,146) |
Number of families with income > $200k:| New Territory: | 58.8% (431) |
| Texas: | 7.9% (64,439) |
Median non-family income in New Territory in 2022:| New Territory: | $87,077 |
| State: | $40,133 |
Change in median non-family income between 2000 and 2022:| New Territory, Texas: | +107.7% |
| Texas: | +102.2% |
Median per capita income in New Territory in 2022:| New Territory: | $57,198 |
| State: | $30,490 |
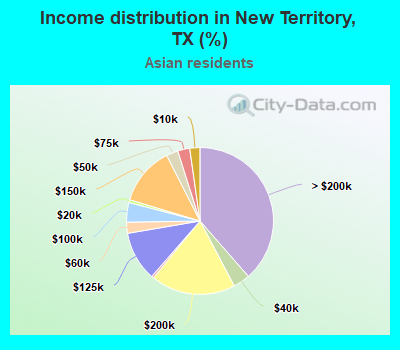
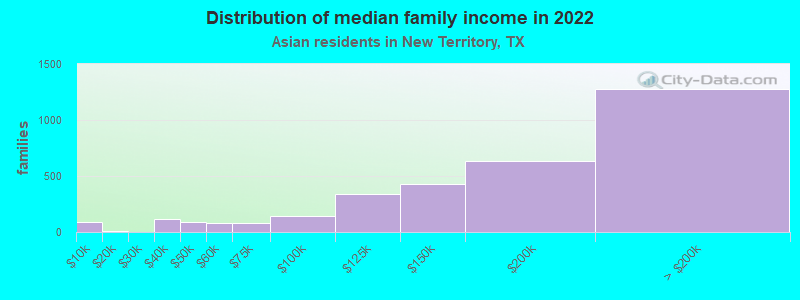
Income statistics for Asian residents
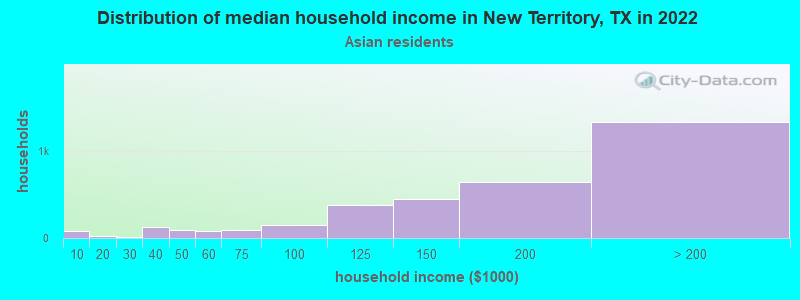
Median household income in New Territory, TX in 2022:| New Territory: | $199,394 |
| State: | $107,673 |
Change in median household income between 2000 and 2022:| New Territory, Texas: | +101.2% |
| Texas: | +115.1% |
Number of households with income < $10k:| New Territory: | 2.2% (77) |
| State: | 5.2% (29,885) |
Number of households with income $10k - 20k:| New Territory: | 0.6% (21) |
| Texas: | 4.7% (27,044) |
Number of households with income $20k - 30k:| New Territory: | 0.5% (17) |
| State: | 4.1% (23,363) |
Number of households with income $30k - 40k:| New Territory: | 3.7% (128) |
| State: | 4.1% (23,309) |
Number of households with income $40k - 50k:| New Territory: | 2.6% (90) |
| State: | 5.2% (29,826) |
Number of households with income $50k - 60k:| New Territory: | 2.4% (84) |
| State: | 4.7% (26,512) |
Number of households with income $60k - 75k:| New Territory: | 2.6% (91) |
| Texas: | 6.5% (36,905) |
Number of households with income $75k - 100k:| New Territory: | 4.3% (149) |
| Texas: | 11.3% (64,350) |
Number of households with income $100k - 125k:| New Territory: | 10.9% (376) |
| State: | 11.4% (64,714) |
Number of households with income $125k - 150k:| New Territory: | 12.8% (443) |
| State: | 9.3% (52,719) |
Number of households with income $150k - 200k:| New Territory: | 18.6% (643) |
| State: | 12.5% (70,953) |
Number of households with income > $200k:| New Territory: | 38.6% (1,331) |
| Texas: | 21.1% (120,260) |
Aggregate household income in New Territory in 2022: $566,115,410
Median family income in New Territory in 2022:| New Territory: | $197,032 |
| State: | $123,328 |
Number of families with income < $10k:| New Territory: | 2.7% (90) |
| State: | 3.1% (13,567) |
Number of families with income $10k - 20k:| New Territory: | 0.3% (10) |
| State: | 3.0% (13,043) |
Number of families with income $30k - 40k:| New Territory: | 3.6% (119) |
| Texas: | 3.4% (15,033) |
Number of families with income $40k - 50k:| New Territory: | 2.7% (89) |
| Texas: | 4.9% (21,622) |
Number of families with income $50k - 60k:| New Territory: | 2.5% (82) |
| State: | 4.7% (20,568) |
Number of families with income $60k - 75k:| New Territory: | 2.5% (83) |
| State: | 6.1% (26,637) |
Number of families with income $75k - 100k:| New Territory: | 4.2% (139) |
| Texas: | 10.7% (46,626) |
Number of families with income $100k - 125k:| New Territory: | 10.3% (340) |
| State: | 11.3% (49,585) |
Number of families with income $125k - 150k:| New Territory: | 13.1% (432) |
| State: | 9.8% (43,043) |
Number of families with income $150k - 200k:| New Territory: | 19.2% (631) |
| State: | 14.7% (64,203) |
Number of families with income > $200k:| New Territory: | 38.7% (1,274) |
| Texas: | 24.8% (108,511) |
Median non-family income in New Territory in 2022:| New Territory: | $13,761 |
| State: | $64,320 |
Median per capita income in New Territory in 2022:| New Territory: | $54,139 |
| State: | $48,626 |
Change in median per capita income between 2000 and 2022:| New Territory, Texas: | +76.5% |
| Texas: | +132.0% |
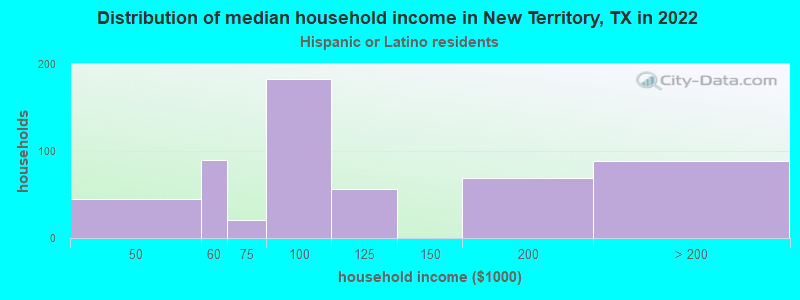
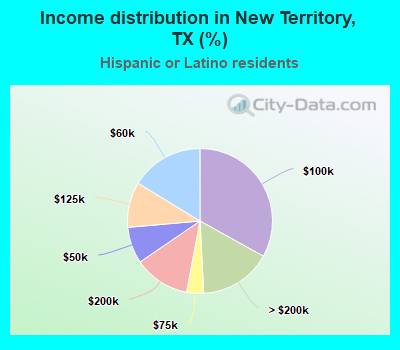
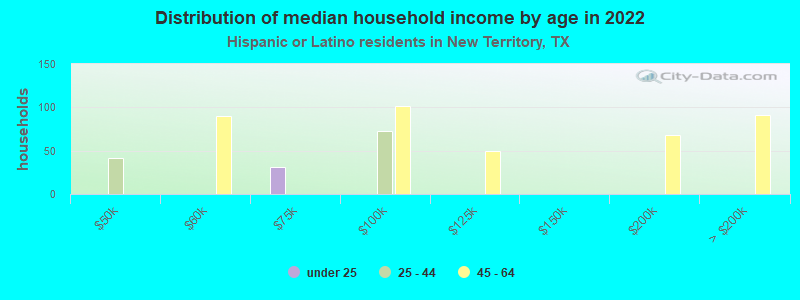
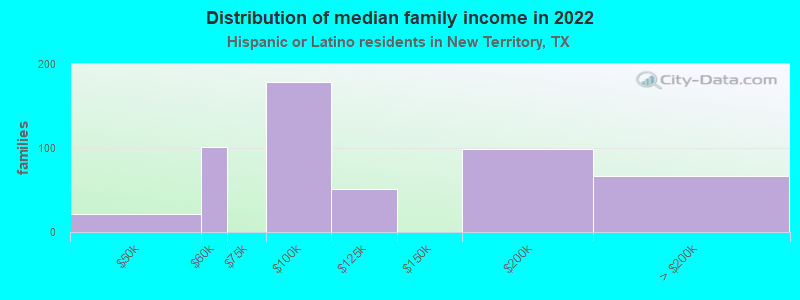
Income statistics for Hispanic or Latino residents
Median household income in New Territory, TX in 2022:| New Territory: | $125,603 |
| State: | $60,504 |
Change in median household income between 2000 and 2022:| New Territory, Texas: | +64.2% |
| Texas: | +102.5% |
Number of households with income < $10k:| New Territory: | 0.0% (0) |
| State: | 5.8% (213,953) |
Number of households with income $10k - 20k:| New Territory: | 0.0% (0) |
| State: | 8.0% (297,456) |
Number of households with income $20k - 30k:| New Territory: | 0.0% (0) |
| Texas: | 9.2% (340,166) |
Number of households with income $30k - 40k:| New Territory: | 0.0% (0) |
| Texas: | 9.5% (354,336) |
Number of households with income $40k - 50k:| New Territory: | 8.1% (45) |
| State: | 8.8% (327,013) |
Number of households with income $50k - 60k:| New Territory: | 16.3% (90) |
| Texas: | 8.3% (308,818) |
Number of households with income $60k - 75k:| New Territory: | 3.8% (21) |
| State: | 10.9% (405,109) |
Number of households with income $75k - 100k:| New Territory: | 33.1% (183) |
| State: | 13.8% (511,639) |
Number of households with income $100k - 125k:| New Territory: | 10.1% (56) |
| State: | 8.6% (319,728) |
Number of households with income $125k - 150k:| New Territory: | 0.0% (0) |
| State: | 5.7% (210,932) |
Number of households with income $150k - 200k:| New Territory: | 12.5% (69) |
| State: | 6.4% (236,055) |
Number of households with income > $200k:| New Territory: | 16.1% (89) |
| Texas: | 5.1% (189,259) |
Aggregate household income in New Territory in 2022: $53,377,661
Median family income in New Territory in 2022:| New Territory: | $115,706 |
| Texas: | $65,080 |
Number of families with income $40k - 50k:| New Territory: | 4.0% (21) |
| State: | 8.6% (240,188) |
Number of families with income $50k - 60k:| New Territory: | 19.6% (101) |
| State: | 8.0% (223,566) |
Number of families with income $75k - 100k:| New Territory: | 34.4% (178) |
| Texas: | 14.3% (398,554) |
Number of families with income $100k - 125k:| New Territory: | 9.8% (51) |
| Texas: | 9.5% (264,007) |
Number of families with income $150k - 200k:| New Territory: | 19.2% (99) |
| State: | 7.3% (202,259) |
Number of families with income > $200k:| New Territory: | 13.0% (67) |
| State: | 5.9% (165,129) |
Median non-family income in New Territory in 2022:| New Territory: | $19,456 |
| Texas: | $39,934 |
Median per capita income in New Territory in 2022:| New Territory: | $36,484 |
| State: | $24,862 |
Change in median per capita income between 2000 and 2022:| New Territory, Texas: | +115.1% |
| State: | +130.8% |
Income statistics for American Indian and Alaska Native residents
Median household income in New Territory, TX in 2022:| New Territory: | $95,201 |
| State: | $65,765 |
Change in median household income between 2000 and 2022:| New Territory, Texas: | +69.5% |
| State: | +88.3% |
Aggregate household income in New Territory in 2022: $10,255,646
Median family income in New Territory in 2022:| New Territory: | $85,070 |
| State: | $72,369 |
Median per capita income in New Territory in 2022:| New Territory: | $26,917 |
| State: | $28,166 |
Change in median per capita income between 2000 and 2022:| New Territory, Texas: | +78.2% |
| Texas: | +77.2% |
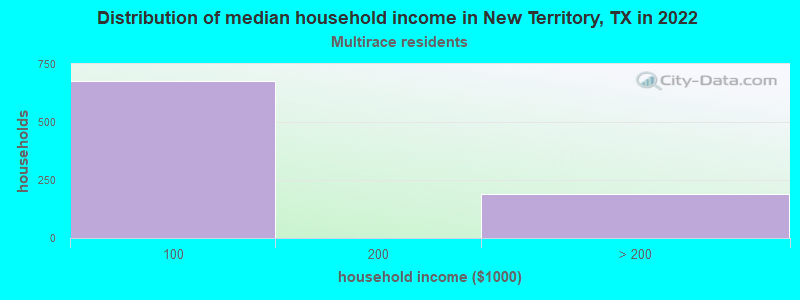
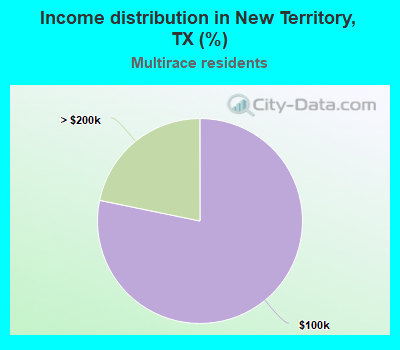
Income statistics for Multirace residents
Median household income in New Territory, TX in 2022:| New Territory: | $106,794 |
| Texas: | $62,748 |
Change in median household income between 2000 and 2022:| New Territory, Texas: | +50.3% |
| Texas: | +92.3% |
Number of households with income < $10k:| New Territory: | 0.0% (0) |
| State: | 5.5% (122,324) |
Number of households with income $10k - 20k:| New Territory: | 0.0% (0) |
| State: | 8.2% (182,232) |
Number of households with income $20k - 30k:| New Territory: | 0.0% (0) |
| State: | 8.5% (189,456) |
Number of households with income $30k - 40k:| New Territory: | 0.0% (0) |
| State: | 8.9% (197,499) |
Number of households with income $40k - 50k:| New Territory: | 0.0% (0) |
| Texas: | 8.7% (191,735) |
Number of households with income $50k - 60k:| New Territory: | 0.0% (0) |
| Texas: | 8.0% (177,535) |
Number of households with income $60k - 75k:| New Territory: | 0.0% (0) |
| State: | 10.5% (232,479) |
Number of households with income $75k - 100k:| New Territory: | 78.2% (676) |
| State: | 13.1% (290,448) |
Number of households with income $100k - 125k:| New Territory: | 0.0% (0) |
| Texas: | 8.6% (191,595) |
Number of households with income $125k - 150k:| New Territory: | 0.0% (0) |
| State: | 6.0% (133,361) |
Number of households with income $150k - 200k:| New Territory: | 0.0% (0) |
| Texas: | 7.2% (159,195) |
Number of households with income > $200k:| New Territory: | 21.8% (188) |
| Texas: | 6.7% (148,064) |
Aggregate household income in New Territory in 2022: $81,088,907
Median family income in New Territory in 2022:| New Territory: | $108,157 |
| State: | $69,780 |
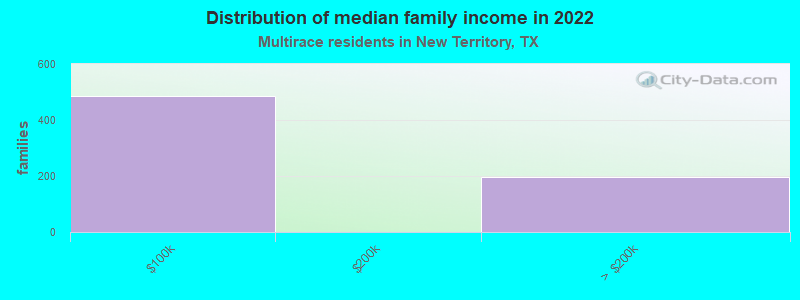
Number of families with income $75k - 100k:| New Territory: | 71.2% (485) |
| Texas: | 14.0% (226,284) |
Number of families with income > $200k:| New Territory: | 28.8% (196) |
| State: | 7.9% (127,299) |
Median per capita income in New Territory in 2022:| New Territory: | $65,529 |
| State: | $26,785 |
Income statistics for other residents
Median household income in New Territory, TX in 2022:| New Territory: | $85,070 |
| State: | $57,114 |
Aggregate household income in New Territory in 2022: $29,271,183
Median family income in New Territory in 2022:| New Territory: | $85,330 |
| State: | $60,064 |
Median non-family income in New Territory in 2022:| New Territory: | $24,853 |
| State: | $38,690 |
Change in median non-family income between 2000 and 2022:| New Territory, Texas: | +17.0% |
| State: | +90.2% |
Median per capita income in New Territory in 2022:| New Territory: | $40,540 |
| State: | $23,899 |