Newtown district, Virginia (VA) income map, earnings map, and wages data
The median household income in Newtown district, VA in 2022 was $57,678, which was 48.9% less than the median annual income of $85,873 across the entire state of Virginia. Compared to the median income of $31,701 in 2000 this represents an increase of 45.0%. The per capita income in 2022 was $28,632, which means an increase of 49.1% compared to 2000 when it was $14,566.
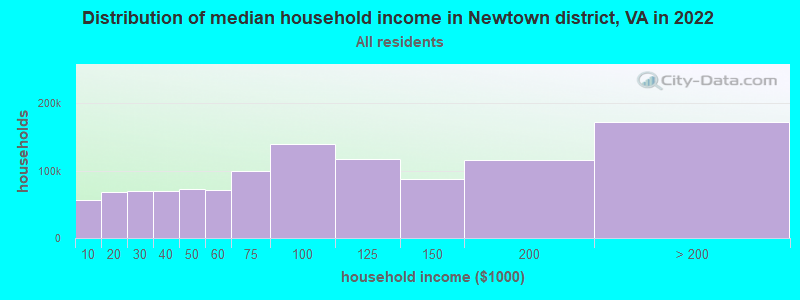
Income statistics for all residents
Median household income in Newtown district, VA in 2022:| Newtown district: | $57,678 |
| State: | $85,873 |
Change in median household income between 2000 and 2022:| Newtown district, Virginia: | +81.9% |
| State: | +84.0% |
Number of households with income < $10k:| Newtown district: | 4.9% (55,825) |
| State: | 4.9% (165,315) |
Number of households with income $10k - 20k:| Newtown district: | 6.0% (68,147) |
| Virginia: | 5.9% (199,380) |
Number of households with income $20k - 30k:| Newtown district: | 6.1% (69,454) |
| State: | 6.0% (202,243) |
Number of households with income $30k - 40k:| Newtown district: | 6.2% (70,394) |
| State: | 6.1% (205,967) |
Number of households with income $40k - 50k:| Newtown district: | 6.4% (73,114) |
| State: | 6.4% (215,648) |
Number of households with income $50k - 60k:| Newtown district: | 6.3% (71,271) |
| State: | 6.2% (210,516) |
Number of households with income $60k - 75k:| Newtown district: | 8.7% (98,905) |
| State: | 8.6% (292,112) |
Number of households with income $75k - 100k:| Newtown district: | 12.2% (139,026) |
| State: | 12.2% (412,198) |
Number of households with income $100k - 125k:| Newtown district: | 10.3% (117,594) |
| State: | 10.3% (348,998) |
Number of households with income $125k - 150k:| Newtown district: | 7.7% (87,418) |
| State: | 7.7% (261,236) |
Number of households with income $150k - 200k:| Newtown district: | 10.2% (115,801) |
| State: | 10.3% (347,282) |
Number of households with income > $200k:| Newtown district: | 15.1% (172,112) |
| State: | 15.4% (519,712) |
Aggregate household income in Newtown district in 2022: $1,941,491,937
Median family income in Newtown district in 2022:| Newtown district: | $67,570 |
| State: | $107,101 |
Median non-family income in Newtown district in 2022:| Newtown district: | $27,130 |
| Virginia: | $51,436 |
Change in median non-family income between 2000 and 2022:| Newtown district, Virginia: | +73.6% |
| State: | +73.5% |
Median per capita income in Newtown district in 2022:| Newtown district: | $28,632 |
| State: | $47,199 |
Change in median per capita income between 2000 and 2022:| Newtown district, Virginia: | +96.6% |
| State: | +96.9% |
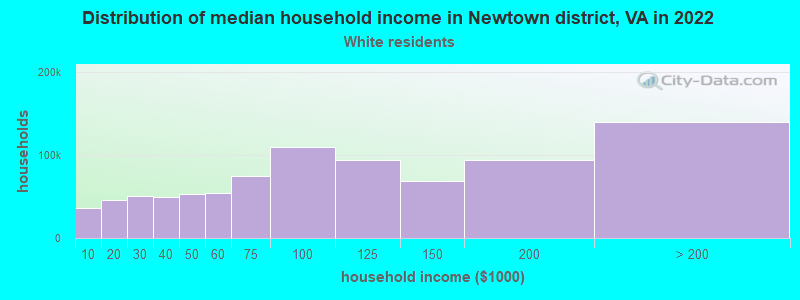
Income statistics for White residents
Median household income in Newtown district, VA in 2022:| Newtown district: | $71,920 |
| State: | $91,924 |
Change in median household income between 2000 and 2022:| Newtown district, Virginia: | +82.7% |
| Virginia: | +81.9% |
Number of households with income < $10k:| Newtown district: | 4.1% (36,023) |
| State: | 4.1% (90,549) |
Number of households with income $10k - 20k:| Newtown district: | 5.3% (46,136) |
| State: | 5.2% (114,324) |
Number of households with income $20k - 30k:| Newtown district: | 5.9% (50,953) |
| State: | 5.7% (125,676) |
Number of households with income $30k - 40k:| Newtown district: | 5.6% (48,977) |
| State: | 5.5% (121,220) |
Number of households with income $40k - 50k:| Newtown district: | 6.1% (53,147) |
| Virginia: | 6.0% (133,011) |
Number of households with income $50k - 60k:| Newtown district: | 6.3% (54,450) |
| State: | 6.2% (136,856) |
Number of households with income $60k - 75k:| Newtown district: | 8.5% (74,221) |
| State: | 8.4% (186,094) |
Number of households with income $75k - 100k:| Newtown district: | 12.6% (109,367) |
| State: | 12.5% (277,077) |
Number of households with income $100k - 125k:| Newtown district: | 10.8% (93,503) |
| State: | 10.8% (237,562) |
Number of households with income $125k - 150k:| Newtown district: | 7.9% (68,996) |
| Virginia: | 8.0% (177,532) |
Number of households with income $150k - 200k:| Newtown district: | 10.8% (93,622) |
| Virginia: | 11.0% (242,106) |
Number of households with income > $200k:| Newtown district: | 16.1% (139,936) |
| State: | 16.6% (366,064) |
Aggregate household income in Newtown district in 2022: $820,263,133
Median family income in Newtown district in 2022:| Newtown district: | $83,376 |
| Virginia: | $114,708 |
Number of families with income $10k - 20k:| Newtown district: | 5.7% (8) |
| Virginia: | 2.5% (35,529) |
Number of families with income $20k - 30k:| Newtown district: | 5.5% (8) |
| State: | 3.5% (49,027) |
Number of families with income $30k - 40k:| Newtown district: | 10.2% (15) |
| Virginia: | 3.8% (53,514) |
Number of families with income $40k - 50k:| Newtown district: | 8.7% (13) |
| Virginia: | 4.7% (66,206) |
Number of families with income $50k - 60k:| Newtown district: | 2.2% (3) |
| State: | 5.2% (74,438) |
Number of families with income $60k - 75k:| Newtown district: | 11.0% (16) |
| State: | 8.2% (116,265) |
Number of families with income $75k - 100k:| Newtown district: | 9.7% (14) |
| State: | 12.9% (183,581) |
Number of families with income $100k - 125k:| Newtown district: | 19.4% (29) |
| Virginia: | 11.9% (168,950) |
Number of families with income > $200k:| Newtown district: | 27.7% (41) |
| Virginia: | 22.1% (313,072) |
Median non-family income in Newtown district in 2022:| Newtown district: | $62,756 |
| State: | $53,785 |
Change in median non-family income between 2000 and 2022:| Newtown district, Virginia: | +73.6% |
| State: | +70.5% |
Median per capita income in Newtown district in 2022:| Newtown district: | $39,273 |
| State: | $53,456 |
Change in median per capita income between 2000 and 2022:| Newtown district, Virginia: | +99.5% |
| Virginia: | +99.2% |
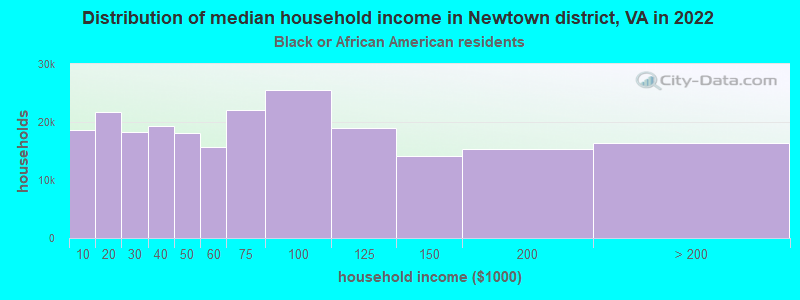
Income statistics for Black or African American residents
Median household income in Newtown district, VA in 2022:| Newtown district: | $39,481 |
| State: | $60,526 |
Change in median household income between 2000 and 2022:| Newtown district, Virginia: | +72.1% |
| Virginia: | +87.6% |
Number of households with income < $10k:| Newtown district: | 8.3% (18,675) |
| State: | 8.3% (52,649) |
Number of households with income $10k - 20k:| Newtown district: | 9.7% (21,651) |
| State: | 9.6% (60,583) |
Number of households with income $20k - 30k:| Newtown district: | 8.2% (18,275) |
| State: | 8.1% (51,220) |
Number of households with income $30k - 40k:| Newtown district: | 8.6% (19,302) |
| State: | 8.6% (54,185) |
Number of households with income $40k - 50k:| Newtown district: | 8.1% (18,099) |
| State: | 8.1% (51,156) |
Number of households with income $50k - 60k:| Newtown district: | 7.0% (15,714) |
| Virginia: | 7.0% (44,637) |
Number of households with income $60k - 75k:| Newtown district: | 9.8% (21,988) |
| State: | 9.8% (62,332) |
Number of households with income $75k - 100k:| Newtown district: | 11.4% (25,491) |
| State: | 11.4% (72,479) |
Number of households with income $100k - 125k:| Newtown district: | 8.5% (18,961) |
| State: | 8.5% (53,997) |
Number of households with income $125k - 150k:| Newtown district: | 6.3% (14,111) |
| Virginia: | 6.3% (40,032) |
Number of households with income $150k - 200k:| Newtown district: | 6.8% (15,275) |
| Virginia: | 6.9% (43,513) |
Number of households with income > $200k:| Newtown district: | 7.3% (16,413) |
| Virginia: | 7.4% (46,851) |
Aggregate household income in Newtown district in 2022: $91,245,435
Median family income in Newtown district in 2022:| Newtown district: | $55,079 |
| State: | $74,125 |
Number of families with income < $10k:| Newtown district: | 7.9% (10) |
| Virginia: | 5.7% (21,574) |
Number of families with income $10k - 20k:| Newtown district: | 11.8% (16) |
| State: | 5.9% (22,226) |
Number of families with income $20k - 30k:| Newtown district: | 12.3% (16) |
| State: | 6.6% (24,902) |
Number of families with income $30k - 40k:| Newtown district: | 12.2% (16) |
| State: | 7.9% (29,738) |
Number of families with income $40k - 50k:| Newtown district: | 11.2% (15) |
| State: | 7.9% (29,836) |
Number of families with income $50k - 60k:| Newtown district: | 3.3% (4) |
| Virginia: | 6.9% (26,158) |
Number of families with income $60k - 75k:| Newtown district: | 10.3% (14) |
| Virginia: | 9.6% (36,311) |
Number of families with income $75k - 100k:| Newtown district: | 19.9% (26) |
| State: | 13.0% (49,024) |
Number of families with income $100k - 125k:| Newtown district: | 11.3% (15) |
| State: | 9.9% (37,339) |
Median non-family income in Newtown district in 2022:| Newtown district: | $18,181 |
| State: | $40,425 |
Change in median non-family income between 2000 and 2022:| Newtown district, Virginia: | +82.7% |
| Virginia: | +91.0% |
Median per capita income in Newtown district in 2022:| Newtown district: | $22,771 |
| State: | $34,599 |
Change in median per capita income between 2000 and 2022:| Newtown district, Virginia: | +108.1% |
| State: | +119.8% |
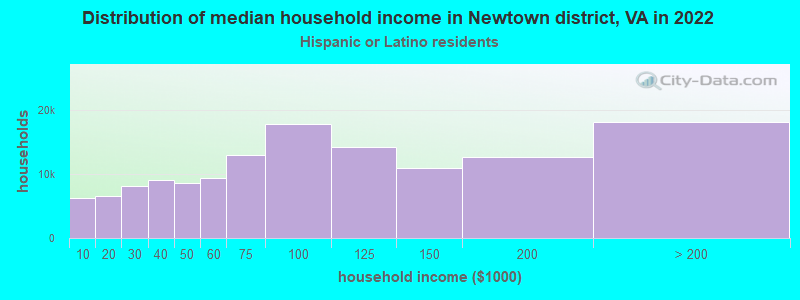
Income statistics for Hispanic or Latino residents
Median household income in Newtown district, VA in 2022:| Newtown district: | $95,423 |
| State: | $84,525 |
Change in median household income between 2000 and 2022:| Newtown district, Virginia: | +95.7% |
| Virginia: | +82.6% |
Number of households with income < $10k:| Newtown district: | 4.6% (6,200) |
| Virginia: | 4.6% (11,664) |
Number of households with income $10k - 20k:| Newtown district: | 4.9% (6,596) |
| State: | 4.9% (12,443) |
Number of households with income $20k - 30k:| Newtown district: | 6.0% (8,044) |
| State: | 5.9% (14,859) |
Number of households with income $30k - 40k:| Newtown district: | 6.8% (9,088) |
| State: | 6.8% (17,059) |
Number of households with income $40k - 50k:| Newtown district: | 6.4% (8,627) |
| State: | 6.4% (16,261) |
Number of households with income $50k - 60k:| Newtown district: | 7.0% (9,344) |
| Virginia: | 6.9% (17,468) |
Number of households with income $60k - 75k:| Newtown district: | 9.6% (12,894) |
| Virginia: | 9.6% (24,193) |
Number of households with income $75k - 100k:| Newtown district: | 13.2% (17,715) |
| State: | 13.2% (33,405) |
Number of households with income $100k - 125k:| Newtown district: | 10.5% (14,137) |
| Virginia: | 10.5% (26,356) |
Number of households with income $125k - 150k:| Newtown district: | 8.1% (10,863) |
| State: | 8.1% (20,494) |
Number of households with income $150k - 200k:| Newtown district: | 9.4% (12,671) |
| Virginia: | 9.5% (23,943) |
Number of households with income > $200k:| Newtown district: | 13.5% (18,074) |
| State: | 13.5% (33,987) |
Aggregate household income in Newtown district in 2022: $3,968,864
Median family income in Newtown district in 2022:| Newtown district: | $102,775 |
| Virginia: | $88,590 |
Number of families with income $10k - 20k:| Newtown district: | 12.8% (2) |
| Virginia: | 5.2% (9,926) |
Number of families with income $20k - 30k:| Newtown district: | 9.2% (2) |
| Virginia: | 5.3% (10,120) |
Number of families with income $30k - 40k:| Newtown district: | 17.2% (3) |
| State: | 6.3% (11,966) |
Number of families with income $40k - 50k:| Newtown district: | 11.6% (2) |
| State: | 7.0% (13,232) |
Number of families with income $50k - 60k:| Newtown district: | 2.7% (0) |
| State: | 7.0% (13,269) |
Number of families with income $60k - 75k:| Newtown district: | 9.8% (2) |
| Virginia: | 8.5% (16,211) |
Number of families with income $75k - 100k:| Newtown district: | 7.1% (1) |
| State: | 12.3% (23,386) |
Number of families with income $100k - 125k:| Newtown district: | 13.7% (2) |
| State: | 10.9% (20,753) |
Number of families with income > $200k:| Newtown district: | 15.9% (3) |
| Virginia: | 14.5% (27,548) |
Median per capita income in Newtown district in 2022:| Newtown district: | $31,724 |
| Virginia: | $32,277 |
Change in median per capita income between 2000 and 2022:| Newtown district, Virginia: | +116.6% |
| State: | +104.6% |
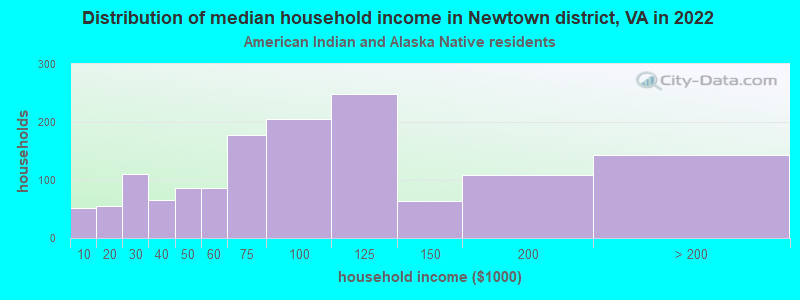
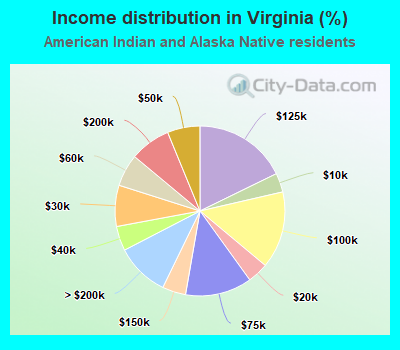
Income statistics for American Indian and Alaska Native residents
Median household income in Newtown district, VA in 2022:| Newtown district: | $13,858 |
| Virginia: | $81,872 |
Change in median household income between 2000 and 2022:| Newtown district, Virginia: | +105.3% |
| State: | +91.9% |
Number of households with income < $10k:| Newtown district: | 3.6% (51) |
| State: | 3.6% (321) |
Number of households with income $10k - 20k:| Newtown district: | 4.0% (56) |
| Virginia: | 4.0% (353) |
Number of households with income $20k - 30k:| Newtown district: | 7.8% (110) |
| State: | 7.8% (693) |
Number of households with income $30k - 40k:| Newtown district: | 4.6% (65) |
| State: | 4.7% (414) |
Number of households with income $40k - 50k:| Newtown district: | 6.2% (87) |
| State: | 6.2% (548) |
Number of households with income $50k - 60k:| Newtown district: | 6.1% (86) |
| Virginia: | 6.1% (544) |
Number of households with income $60k - 75k:| Newtown district: | 12.7% (178) |
| Virginia: | 12.7% (1,122) |
Number of households with income $75k - 100k:| Newtown district: | 14.7% (206) |
| Virginia: | 14.7% (1,299) |
Number of households with income $100k - 125k:| Newtown district: | 17.7% (249) |
| Virginia: | 17.8% (1,573) |
Number of households with income $125k - 150k:| Newtown district: | 4.5% (63) |
| State: | 4.5% (396) |
Number of households with income $150k - 200k:| Newtown district: | 7.8% (109) |
| State: | 7.8% (687) |
Number of households with income > $200k:| Newtown district: | 10.2% (143) |
| Virginia: | 10.2% (901) |
Aggregate household income in Newtown district in 2022: $664,115
Median family income in Newtown district in 2022:| Newtown district: | $78,529 |
| Virginia: | $87,109 |
Median non-family income in Newtown district in 2022:| Newtown district: | $7,692 |
| State: | $53,240 |
Change in median non-family income between 2000 and 2022:| Newtown district, Virginia: | +60.5% |
| State: | +88.3% |
Median per capita income in Newtown district in 2022:| Newtown district: | $14,023 |
| State: | $34,188 |
Change in median per capita income between 2000 and 2022:| Newtown district, Virginia: | +73.2% |
| State: | +70.3% |
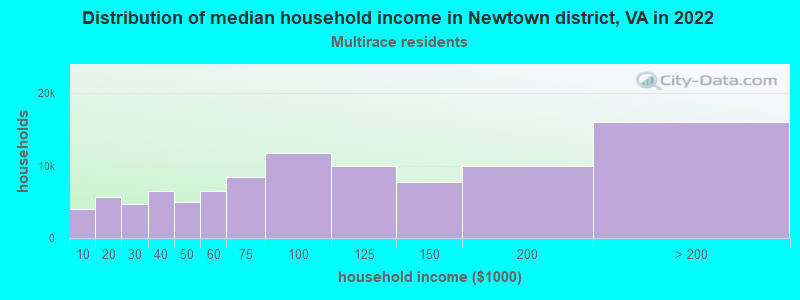
Income statistics for Multirace residents
Median household income in Newtown district, VA in 2022:| Newtown district: | $83,014 |
| State: | $90,841 |
Change in median household income between 2000 and 2022:| Newtown district, Virginia: | +129.0% |
| Virginia: | +117.5% |
Number of households with income < $10k:| Newtown district: | 4.1% (3,977) |
| Virginia: | 4.1% (9,125) |
Number of households with income $10k - 20k:| Newtown district: | 5.9% (5,676) |
| Virginia: | 5.9% (12,969) |
Number of households with income $20k - 30k:| Newtown district: | 4.9% (4,762) |
| State: | 4.8% (10,563) |
Number of households with income $30k - 40k:| Newtown district: | 6.7% (6,506) |
| State: | 6.6% (14,553) |
Number of households with income $40k - 50k:| Newtown district: | 5.2% (4,995) |
| State: | 5.2% (11,391) |
Number of households with income $50k - 60k:| Newtown district: | 6.8% (6,529) |
| State: | 6.8% (14,994) |
Number of households with income $60k - 75k:| Newtown district: | 8.7% (8,429) |
| State: | 8.8% (19,323) |
Number of households with income $75k - 100k:| Newtown district: | 12.2% (11,751) |
| State: | 12.1% (26,729) |
Number of households with income $100k - 125k:| Newtown district: | 10.4% (9,987) |
| Virginia: | 10.4% (22,807) |
Number of households with income $125k - 150k:| Newtown district: | 8.1% (7,779) |
| State: | 8.1% (17,881) |
Number of households with income $150k - 200k:| Newtown district: | 10.4% (10,028) |
| Virginia: | 10.4% (22,979) |
Number of households with income > $200k:| Newtown district: | 16.6% (16,053) |
| State: | 16.7% (36,748) |
Aggregate household income in Newtown district in 2022: $4,348,124
Median family income in Newtown district in 2022:| Newtown district: | $87,098 |
| State: | $103,849 |
Number of families with income $30k - 40k:| Newtown district: | 100.0% (23) |
| Virginia: | 5.4% (8,214) |
Median per capita income in Newtown district in 2022:| Newtown district: | $11,023 |
| Virginia: | $34,385 |
Change in median per capita income between 2000 and 2022:| Newtown district, Virginia: | +137.8% |
| State: | +130.2% |