North Antelope Valley, California (CA) income map, earnings map, and wages data
The median household income in North Antelope Valley, CA in 2022 was $80,646, which was 13.5% less than the median annual income of $91,551 across the entire state of California. Compared to the median income of $41,233 in 2000 this represents an increase of 48.9%. The per capita income in 2022 was $35,869, which means an increase of 52.1% compared to 2000 when it was $17,185.
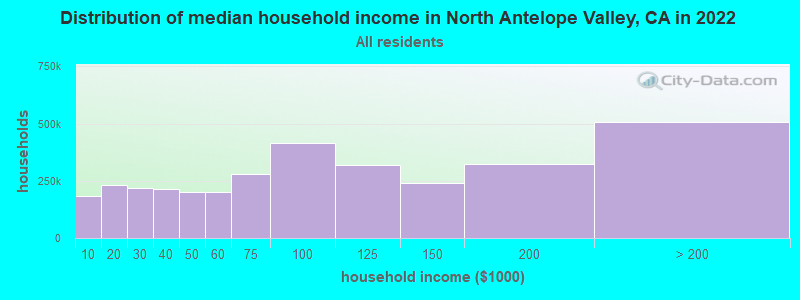
Income statistics for all residents
Median household income in North Antelope Valley, CA in 2022:| North Antelope Valley: | $80,646 |
| California: | $91,551 |
Change in median household income between 2000 and 2022:| North Antelope Valley, California: | +95.6% |
| California: | +92.8% |
Number of households with income < $10k:| North Antelope Valley: | 5.5% (183,774) |
| State: | 4.8% (654,370) |
Number of households with income $10k - 20k:| North Antelope Valley: | 6.9% (231,667) |
| State: | 5.8% (789,493) |
Number of households with income $20k - 30k:| North Antelope Valley: | 6.5% (217,357) |
| State: | 5.7% (778,318) |
Number of households with income $30k - 40k:| North Antelope Valley: | 6.4% (214,497) |
| State: | 5.8% (783,170) |
Number of households with income $40k - 50k:| North Antelope Valley: | 6.1% (202,803) |
| State: | 5.8% (781,352) |
Number of households with income $50k - 60k:| North Antelope Valley: | 6.1% (202,965) |
| State: | 5.6% (760,175) |
Number of households with income $60k - 75k:| North Antelope Valley: | 8.4% (279,582) |
| State: | 8.2% (1,104,699) |
Number of households with income $75k - 100k:| North Antelope Valley: | 12.4% (412,670) |
| State: | 12.0% (1,627,633) |
Number of households with income $100k - 125k:| North Antelope Valley: | 9.6% (320,602) |
| State: | 10.0% (1,358,619) |
Number of households with income $125k - 150k:| North Antelope Valley: | 7.2% (241,858) |
| State: | 7.6% (1,027,455) |
Number of households with income $150k - 200k:| North Antelope Valley: | 9.7% (323,992) |
| State: | 10.6% (1,439,811) |
Number of households with income > $200k:| North Antelope Valley: | 15.2% (506,557) |
| California: | 18.0% (2,445,491) |
Aggregate household income in North Antelope Valley in 2022: $410,815,007,900
Median family income in North Antelope Valley in 2022:| North Antelope Valley: | $90,393 |
| California: | $104,823 |
Median non-family income in North Antelope Valley in 2022:| North Antelope Valley: | $47,960 |
| State: | $59,348 |
Change in median non-family income between 2000 and 2022:| North Antelope Valley, California: | +81.8% |
| California: | +85.3% |
Median per capita income in North Antelope Valley in 2022:| North Antelope Valley: | $35,870 |
| California: | $46,661 |
Change in median per capita income between 2000 and 2022:| North Antelope Valley, California: | +108.7% |
| State: | +105.5% |
Income statistics for White residents
Median household income in North Antelope Valley, CA in 2022:| North Antelope Valley: | $90,657 |
| State: | $100,917 |
Change in median household income between 2000 and 2022:| North Antelope Valley, California: | +107.4% |
| California: | +96.8% |
Number of households with income < $10k:| North Antelope Valley: | 4.9% (54,744) |
| State: | 4.4% (284,109) |
Number of households with income $10k - 20k:| North Antelope Valley: | 5.7% (64,347) |
| State: | 5.3% (340,330) |
Number of households with income $20k - 30k:| North Antelope Valley: | 5.6% (63,155) |
| California: | 5.3% (343,145) |
Number of households with income $30k - 40k:| North Antelope Valley: | 5.2% (58,090) |
| State: | 5.1% (330,146) |
Number of households with income $40k - 50k:| North Antelope Valley: | 4.9% (54,952) |
| State: | 5.2% (335,310) |
Number of households with income $50k - 60k:| North Antelope Valley: | 5.1% (57,898) |
| State: | 5.1% (326,299) |
Number of households with income $60k - 75k:| North Antelope Valley: | 6.9% (78,012) |
| California: | 7.6% (487,640) |
Number of households with income $75k - 100k:| North Antelope Valley: | 11.3% (127,154) |
| State: | 11.5% (736,578) |
Number of households with income $100k - 125k:| North Antelope Valley: | 9.8% (109,891) |
| State: | 10.1% (648,782) |
Number of households with income $125k - 150k:| North Antelope Valley: | 7.4% (83,534) |
| California: | 7.8% (499,671) |
Number of households with income $150k - 200k:| North Antelope Valley: | 11.0% (123,937) |
| State: | 11.4% (729,603) |
Number of households with income > $200k:| North Antelope Valley: | 22.3% (250,843) |
| State: | 21.2% (1,364,246) |
Aggregate household income in North Antelope Valley in 2022: $169,854,740,359
Median family income in North Antelope Valley in 2022:| North Antelope Valley: | $115,360 |
| California: | $125,379 |
Number of families with income < $10k:| North Antelope Valley: | 4.1% (462) |
| California: | 2.2% (87,079) |
Number of families with income $10k - 20k:| North Antelope Valley: | 3.5% (388) |
| State: | 2.5% (97,716) |
Number of families with income $20k - 30k:| North Antelope Valley: | 5.8% (649) |
| California: | 3.5% (137,295) |
Number of families with income $30k - 40k:| North Antelope Valley: | 7.2% (805) |
| California: | 3.9% (152,947) |
Number of families with income $40k - 50k:| North Antelope Valley: | 6.8% (763) |
| California: | 4.3% (169,197) |
Number of families with income $50k - 60k:| North Antelope Valley: | 7.5% (838) |
| California: | 4.5% (176,192) |
Number of families with income $60k - 75k:| North Antelope Valley: | 10.7% (1,202) |
| State: | 7.0% (274,752) |
Number of families with income $75k - 100k:| North Antelope Valley: | 15.0% (1,690) |
| State: | 11.3% (445,632) |
Number of families with income $100k - 125k:| North Antelope Valley: | 11.2% (1,261) |
| State: | 10.7% (423,630) |
Number of families with income $125k - 150k:| North Antelope Valley: | 10.2% (1,144) |
| State: | 9.1% (357,408) |
Number of families with income $150k - 200k:| North Antelope Valley: | 7.6% (858) |
| California: | 13.5% (532,693) |
Number of families with income > $200k:| North Antelope Valley: | 10.5% (1,182) |
| California: | 27.6% (1,086,948) |
Median non-family income in North Antelope Valley in 2022:| North Antelope Valley: | $52,968 |
| State: | $62,819 |
Change in median non-family income between 2000 and 2022:| North Antelope Valley, California: | +96.2% |
| California: | +84.4% |
Median per capita income in North Antelope Valley in 2022:| North Antelope Valley: | $48,037 |
| California: | $61,706 |
Change in median per capita income between 2000 and 2022:| North Antelope Valley, California: | +142.5% |
| California: | +122.7% |
Income statistics for Black or African American residents
Median household income in North Antelope Valley, CA in 2022:| North Antelope Valley: | $55,688 |
| State: | $63,268 |
Change in median household income between 2000 and 2022:| North Antelope Valley, California: | +83.6% |
| State: | +81.0% |
Number of households with income < $10k:| North Antelope Valley: | 10.3% (30,477) |
| California: | 9.0% (73,219) |
Number of households with income $10k - 20k:| North Antelope Valley: | 11.6% (34,334) |
| State: | 10.6% (86,666) |
Number of households with income $20k - 30k:| North Antelope Valley: | 7.3% (21,520) |
| State: | 7.1% (57,719) |
Number of households with income $30k - 40k:| North Antelope Valley: | 7.8% (23,221) |
| State: | 7.2% (58,714) |
Number of households with income $40k - 50k:| North Antelope Valley: | 7.1% (21,063) |
| State: | 7.1% (58,075) |
Number of households with income $50k - 60k:| North Antelope Valley: | 6.4% (19,080) |
| California: | 6.8% (55,229) |
Number of households with income $60k - 75k:| North Antelope Valley: | 8.9% (26,261) |
| California: | 8.8% (71,895) |
Number of households with income $75k - 100k:| North Antelope Valley: | 11.2% (33,348) |
| State: | 11.9% (96,893) |
Number of households with income $100k - 125k:| North Antelope Valley: | 8.1% (24,131) |
| State: | 8.7% (70,729) |
Number of households with income $125k - 150k:| North Antelope Valley: | 6.4% (18,836) |
| State: | 6.3% (51,211) |
Number of households with income $150k - 200k:| North Antelope Valley: | 6.5% (19,394) |
| State: | 7.2% (58,687) |
Number of households with income > $200k:| North Antelope Valley: | 8.4% (24,837) |
| State: | 9.3% (75,487) |
Aggregate household income in North Antelope Valley in 2022: $2,851,454,359
Median family income in North Antelope Valley in 2022:| North Antelope Valley: | $59,347 |
| State: | $77,263 |
Number of families with income < $10k:| North Antelope Valley: | 9.9% (271) |
| California: | 5.9% (27,037) |
Number of families with income $10k - 20k:| North Antelope Valley: | 11.4% (313) |
| State: | 6.4% (29,505) |
Number of families with income $20k - 30k:| North Antelope Valley: | 7.9% (218) |
| State: | 5.6% (25,755) |
Number of families with income $30k - 40k:| North Antelope Valley: | 7.8% (215) |
| California: | 6.8% (30,948) |
Number of families with income $40k - 50k:| North Antelope Valley: | 9.6% (263) |
| State: | 8.3% (38,171) |
Number of families with income $50k - 60k:| North Antelope Valley: | 10.8% (298) |
| State: | 7.0% (31,860) |
Number of families with income $60k - 75k:| North Antelope Valley: | 7.3% (201) |
| California: | 8.7% (40,021) |
Number of families with income $75k - 100k:| North Antelope Valley: | 17.0% (467) |
| California: | 12.4% (56,846) |
Number of families with income $100k - 125k:| North Antelope Valley: | 6.5% (177) |
| State: | 9.8% (44,911) |
Number of families with income $125k - 150k:| North Antelope Valley: | 6.1% (169) |
| California: | 7.5% (34,434) |
Number of families with income > $200k:| North Antelope Valley: | 5.7% (156) |
| California: | 12.2% (56,093) |
Median non-family income in North Antelope Valley in 2022:| North Antelope Valley: | $49,157 |
| State: | $41,942 |
Change in median non-family income between 2000 and 2022:| North Antelope Valley, California: | +73.5% |
| State: | +72.0% |
Median per capita income in North Antelope Valley in 2022:| North Antelope Valley: | $27,303 |
| California: | $36,708 |
Change in median per capita income between 2000 and 2022:| North Antelope Valley, California: | +117.9% |
| California: | +110.4% |
Income statistics for Asian residents
Median household income in North Antelope Valley, CA in 2022:| North Antelope Valley: | $104,401 |
| State: | $119,861 |
Change in median household income between 2000 and 2022:| North Antelope Valley, California: | +101.1% |
| California: | +116.5% |
Number of households with income < $10k:| North Antelope Valley: | 6.3% (36,973) |
| State: | 5.1% (106,273) |
Number of households with income $10k - 20k:| North Antelope Valley: | 6.6% (38,776) |
| State: | 4.9% (101,815) |
Number of households with income $20k - 30k:| North Antelope Valley: | 5.6% (32,803) |
| State: | 4.6% (94,414) |
Number of households with income $30k - 40k:| North Antelope Valley: | 5.2% (30,348) |
| California: | 4.1% (84,491) |
Number of households with income $40k - 50k:| North Antelope Valley: | 4.7% (27,405) |
| State: | 4.0% (81,758) |
Number of households with income $50k - 60k:| North Antelope Valley: | 4.7% (27,235) |
| California: | 3.9% (80,971) |
Number of households with income $60k - 75k:| North Antelope Valley: | 7.8% (45,589) |
| State: | 6.0% (124,194) |
Number of households with income $75k - 100k:| North Antelope Valley: | 10.8% (62,756) |
| State: | 9.7% (200,337) |
Number of households with income $100k - 125k:| North Antelope Valley: | 9.9% (57,882) |
| California: | 9.4% (193,488) |
Number of households with income $125k - 150k:| North Antelope Valley: | 7.6% (44,232) |
| California: | 7.7% (158,253) |
Number of households with income $150k - 200k:| North Antelope Valley: | 11.2% (65,387) |
| State: | 12.2% (252,139) |
Number of households with income > $200k:| North Antelope Valley: | 19.6% (114,240) |
| California: | 28.4% (586,641) |
Aggregate household income in North Antelope Valley in 2022: $3,154,813,504
Median family income in North Antelope Valley in 2022:| North Antelope Valley: | $113,148 |
| State: | $136,040 |
Number of families with income < $10k:| North Antelope Valley: | 3.3% (51) |
| State: | 2.8% (42,046) |
Number of families with income $10k - 20k:| North Antelope Valley: | 5.0% (79) |
| State: | 3.1% (46,821) |
Number of families with income $20k - 30k:| North Antelope Valley: | 5.6% (89) |
| State: | 4.1% (61,519) |
Number of families with income $30k - 40k:| North Antelope Valley: | 3.7% (58) |
| State: | 3.7% (55,234) |
Number of families with income $40k - 50k:| North Antelope Valley: | 3.7% (59) |
| State: | 3.9% (58,471) |
Number of families with income $50k - 60k:| North Antelope Valley: | 7.2% (113) |
| California: | 3.9% (58,911) |
Number of families with income $60k - 75k:| North Antelope Valley: | 7.1% (112) |
| State: | 5.9% (88,675) |
Number of families with income $75k - 100k:| North Antelope Valley: | 12.7% (199) |
| State: | 9.5% (143,103) |
Number of families with income $100k - 125k:| North Antelope Valley: | 11.8% (187) |
| State: | 9.4% (142,085) |
Number of families with income $125k - 150k:| North Antelope Valley: | 7.2% (114) |
| California: | 8.0% (120,635) |
Number of families with income $150k - 200k:| North Antelope Valley: | 17.5% (275) |
| State: | 13.2% (198,099) |
Number of families with income > $200k:| North Antelope Valley: | 15.2% (240) |
| State: | 32.5% (489,303) |
Median non-family income in North Antelope Valley in 2022:| North Antelope Valley: | $41,058 |
| California: | $74,216 |
Change in median non-family income between 2000 and 2022:| North Antelope Valley, California: | +131.1% |
| State: | +136.3% |
Median per capita income in North Antelope Valley in 2022:| North Antelope Valley: | $48,311 |
| State: | $58,824 |
Change in median per capita income between 2000 and 2022:| North Antelope Valley, California: | +148.4% |
| State: | +166.8% |
Income statistics for Hispanic or Latino residents
Median household income in North Antelope Valley, CA in 2022:| North Antelope Valley: | $74,882 |
| State: | $75,698 |
Change in median household income between 2000 and 2022:| North Antelope Valley, California: | +110.8% |
| California: | +107.2% |
Number of households with income < $10k:| North Antelope Valley: | 4.5% (63,184) |
| State: | 4.3% (183,294) |
Number of households with income $10k - 20k:| North Antelope Valley: | 7.1% (99,845) |
| State: | 6.0% (253,903) |
Number of households with income $20k - 30k:| North Antelope Valley: | 7.6% (106,862) |
| State: | 6.8% (286,386) |
Number of households with income $30k - 40k:| North Antelope Valley: | 7.9% (111,231) |
| State: | 7.4% (313,728) |
Number of households with income $40k - 50k:| North Antelope Valley: | 7.5% (105,385) |
| State: | 7.4% (313,199) |
Number of households with income $50k - 60k:| North Antelope Valley: | 7.6% (106,972) |
| State: | 7.2% (305,366) |
Number of households with income $60k - 75k:| North Antelope Valley: | 10.1% (142,250) |
| State: | 10.3% (434,937) |
Number of households with income $75k - 100k:| North Antelope Valley: | 14.6% (205,576) |
| California: | 14.4% (607,302) |
Number of households with income $100k - 125k:| North Antelope Valley: | 9.9% (138,878) |
| State: | 10.6% (447,424) |
Number of households with income $125k - 150k:| North Antelope Valley: | 7.2% (101,409) |
| State: | 7.5% (316,022) |
Number of households with income $150k - 200k:| North Antelope Valley: | 8.3% (116,082) |
| State: | 9.2% (386,269) |
Number of households with income > $200k:| North Antelope Valley: | 7.6% (107,322) |
| State: | 8.8% (372,651) |
Aggregate household income in North Antelope Valley in 2022: $20,311,322,273
Median family income in North Antelope Valley in 2022:| North Antelope Valley: | $75,807 |
| California: | $77,589 |
Number of families with income < $10k:| North Antelope Valley: | 6.6% (1,953) |
| State: | 3.9% (129,468) |
Number of families with income $10k - 20k:| North Antelope Valley: | 7.3% (2,150) |
| State: | 4.6% (151,997) |
Number of families with income $20k - 30k:| North Antelope Valley: | 10.5% (3,122) |
| State: | 6.6% (216,764) |
Number of families with income $30k - 40k:| North Antelope Valley: | 11.7% (3,457) |
| California: | 7.6% (249,849) |
Number of families with income $40k - 50k:| North Antelope Valley: | 10.9% (3,240) |
| California: | 7.7% (254,822) |
Number of families with income $50k - 60k:| North Antelope Valley: | 9.8% (2,915) |
| California: | 7.4% (244,815) |
Number of families with income $60k - 75k:| North Antelope Valley: | 12.2% (3,611) |
| State: | 10.5% (345,838) |
Number of families with income $75k - 100k:| North Antelope Valley: | 13.2% (3,921) |
| California: | 14.9% (491,589) |
Number of families with income $100k - 125k:| North Antelope Valley: | 7.7% (2,278) |
| State: | 10.7% (355,400) |
Number of families with income $125k - 150k:| North Antelope Valley: | 5.5% (1,623) |
| State: | 7.8% (259,317) |
Number of families with income $150k - 200k:| North Antelope Valley: | 3.0% (893) |
| State: | 9.3% (306,566) |
Number of families with income > $200k:| North Antelope Valley: | 1.6% (484) |
| State: | 9.1% (299,984) |
Median non-family income in North Antelope Valley in 2022:| North Antelope Valley: | $35,858 |
| State: | $49,746 |
Change in median non-family income between 2000 and 2022:| North Antelope Valley, California: | +107.5% |
| State: | +100.7% |
Median per capita income in North Antelope Valley in 2022:| North Antelope Valley: | $25,829 |
| State: | $27,240 |
Change in median per capita income between 2000 and 2022:| North Antelope Valley, California: | +138.1% |
| State: | +133.3% |
Income statistics for American Indian and Alaska Native residents
Median household income in North Antelope Valley, CA in 2022:| North Antelope Valley: | $64,402 |
| California: | $76,752 |
Change in median household income between 2000 and 2022:| North Antelope Valley, California: | +106.6% |
| State: | +110.0% |
Number of households with income < $10k:| North Antelope Valley: | 5.4% (1,999) |
| State: | 5.4% (8,471) |
Number of households with income $10k - 20k:| North Antelope Valley: | 6.4% (2,381) |
| California: | 6.0% (9,381) |
Number of households with income $20k - 30k:| North Antelope Valley: | 5.6% (2,099) |
| State: | 5.5% (8,668) |
Number of households with income $30k - 40k:| North Antelope Valley: | 8.3% (3,096) |
| California: | 8.3% (13,030) |
Number of households with income $40k - 50k:| North Antelope Valley: | 7.6% (2,826) |
| State: | 6.9% (10,908) |
Number of households with income $50k - 60k:| North Antelope Valley: | 6.4% (2,388) |
| State: | 7.1% (11,198) |
Number of households with income $60k - 75k:| North Antelope Valley: | 10.4% (3,876) |
| California: | 9.6% (15,190) |
Number of households with income $75k - 100k:| North Antelope Valley: | 14.9% (5,559) |
| State: | 14.1% (22,274) |
Number of households with income $100k - 125k:| North Antelope Valley: | 10.3% (3,822) |
| California: | 11.2% (17,643) |
Number of households with income $125k - 150k:| North Antelope Valley: | 8.5% (3,160) |
| State: | 8.3% (13,117) |
Number of households with income $150k - 200k:| North Antelope Valley: | 7.3% (2,714) |
| State: | 8.8% (13,853) |
Number of households with income > $200k:| North Antelope Valley: | 8.9% (3,329) |
| State: | 8.8% (13,925) |
Aggregate household income in North Antelope Valley in 2022: $112,371,565
Median family income in North Antelope Valley in 2022:| North Antelope Valley: | $68,516 |
| State: | $81,108 |
Number of families with income < $10k:| North Antelope Valley: | 2.9% (24) |
| California: | 5.0% (5,711) |
Number of families with income $10k - 20k:| North Antelope Valley: | 3.3% (28) |
| California: | 3.7% (4,148) |
Number of families with income $20k - 30k:| North Antelope Valley: | 4.6% (39) |
| State: | 4.3% (4,876) |
Number of families with income $30k - 40k:| North Antelope Valley: | 16.1% (136) |
| State: | 8.8% (9,994) |
Number of families with income $40k - 50k:| North Antelope Valley: | 7.0% (59) |
| State: | 7.8% (8,776) |
Number of families with income $50k - 60k:| North Antelope Valley: | 13.5% (114) |
| California: | 6.9% (7,834) |
Number of families with income $60k - 75k:| North Antelope Valley: | 1.6% (13) |
| State: | 9.1% (10,247) |
Number of families with income $75k - 100k:| North Antelope Valley: | 14.1% (119) |
| State: | 14.8% (16,731) |
Number of families with income $100k - 125k:| North Antelope Valley: | 14.6% (123) |
| State: | 12.0% (13,609) |
Number of families with income $150k - 200k:| North Antelope Valley: | 5.9% (49) |
| California: | 9.5% (10,721) |
Number of families with income > $200k:| North Antelope Valley: | 16.4% (138) |
| California: | 10.1% (11,409) |
Median non-family income in North Antelope Valley in 2022:| North Antelope Valley: | $44,286 |
| State: | $51,296 |
Change in median non-family income between 2000 and 2022:| North Antelope Valley, California: | +103.8% |
| State: | +114.0% |
Median per capita income in North Antelope Valley in 2022:| North Antelope Valley: | $34,039 |
| California: | $30,289 |
Change in median per capita income between 2000 and 2022:| North Antelope Valley, California: | +111.4% |
| State: | +98.9% |
Income statistics for Multirace residents
Median household income in North Antelope Valley, CA in 2022:| North Antelope Valley: | $71,485 |
| State: | $83,153 |
Change in median household income between 2000 and 2022:| North Antelope Valley, California: | +112.7% |
| State: | +106.0% |
Number of households with income < $10k:| North Antelope Valley: | 4.1% (21,636) |
| California: | 4.2% (85,299) |
Number of households with income $10k - 20k:| North Antelope Valley: | 6.9% (36,519) |
| State: | 6.1% (122,966) |
Number of households with income $20k - 30k:| North Antelope Valley: | 7.4% (39,469) |
| State: | 6.4% (129,328) |
Number of households with income $30k - 40k:| North Antelope Valley: | 7.0% (37,200) |
| State: | 6.4% (130,070) |
Number of households with income $40k - 50k:| North Antelope Valley: | 7.0% (37,449) |
| California: | 6.5% (131,254) |
Number of households with income $50k - 60k:| North Antelope Valley: | 7.0% (37,030) |
| State: | 6.5% (132,382) |
Number of households with income $60k - 75k:| North Antelope Valley: | 9.2% (48,796) |
| California: | 9.4% (191,472) |
Number of households with income $75k - 100k:| North Antelope Valley: | 13.8% (73,415) |
| State: | 13.3% (269,691) |
Number of households with income $100k - 125k:| North Antelope Valley: | 9.2% (48,802) |
| State: | 10.2% (207,286) |
Number of households with income $125k - 150k:| North Antelope Valley: | 7.4% (39,506) |
| California: | 7.8% (158,259) |
Number of households with income $150k - 200k:| North Antelope Valley: | 9.9% (52,857) |
| California: | 10.3% (209,227) |
Number of households with income > $200k:| North Antelope Valley: | 11.0% (58,631) |
| State: | 13.0% (263,210) |
Aggregate household income in North Antelope Valley in 2022: $2,233,176,604
Median family income in North Antelope Valley in 2022:| North Antelope Valley: | $77,001 |
| California: | $87,642 |
Number of families with income < $10k:| North Antelope Valley: | 3.2% (163) |
| State: | 3.2% (48,017) |
Number of families with income $10k - 20k:| North Antelope Valley: | 6.8% (342) |
| State: | 4.1% (60,419) |
Number of families with income $20k - 30k:| North Antelope Valley: | 8.4% (421) |
| State: | 6.1% (89,742) |
Number of families with income $30k - 40k:| North Antelope Valley: | 8.5% (429) |
| State: | 6.2% (91,415) |
Number of families with income $40k - 50k:| North Antelope Valley: | 12.8% (644) |
| State: | 6.8% (100,085) |
Number of families with income $50k - 60k:| North Antelope Valley: | 7.8% (389) |
| California: | 6.7% (98,298) |
Number of families with income $60k - 75k:| North Antelope Valley: | 8.7% (439) |
| California: | 9.5% (140,131) |
Number of families with income $75k - 100k:| North Antelope Valley: | 18.8% (942) |
| State: | 13.8% (203,439) |
Number of families with income $100k - 125k:| North Antelope Valley: | 10.8% (541) |
| State: | 10.4% (153,515) |
Number of families with income $125k - 150k:| North Antelope Valley: | 8.4% (424) |
| California: | 8.4% (124,115) |
Number of families with income > $200k:| North Antelope Valley: | 5.7% (286) |
| California: | 14.0% (207,317) |
Median non-family income in North Antelope Valley in 2022:| North Antelope Valley: | $49,995 |
| State: | $56,558 |
Change in median non-family income between 2000 and 2022:| North Antelope Valley, California: | +100.0% |
| State: | +100.2% |
Median per capita income in North Antelope Valley in 2022:| North Antelope Valley: | $22,456 |
| California: | $32,124 |
Change in median per capita income between 2000 and 2022:| North Antelope Valley, California: | +108.4% |
| State: | +120.4% |
Income statistics for other residents
Number of households with income < $10k:| North Antelope Valley: | 5.1% (2,529) |
| State: | 4.6% (93,035) |
Number of households with income $10k - 20k:| North Antelope Valley: | 7.4% (3,713) |
| State: | 6.3% (126,222) |
Number of households with income $20k - 30k:| North Antelope Valley: | 7.8% (3,902) |
| State: | 7.1% (142,656) |
Number of households with income $30k - 40k:| North Antelope Valley: | 8.5% (4,261) |
| State: | 8.2% (165,018) |
Number of households with income $40k - 50k:| North Antelope Valley: | 7.9% (3,976) |
| State: | 8.0% (161,732) |
Number of households with income $50k - 60k:| North Antelope Valley: | 8.0% (4,008) |
| State: | 7.6% (152,152) |
Number of households with income $60k - 75k:| North Antelope Valley: | 10.4% (5,232) |
| California: | 10.4% (209,951) |
Number of households with income $75k - 100k:| North Antelope Valley: | 14.7% (7,351) |
| California: | 14.7% (296,102) |
Number of households with income $100k - 125k:| North Antelope Valley: | 10.0% (5,004) |
| California: | 10.7% (214,281) |
Number of households with income $125k - 150k:| North Antelope Valley: | 6.9% (3,437) |
| State: | 7.1% (143,092) |
Number of households with income $150k - 200k:| North Antelope Valley: | 7.5% (3,747) |
| State: | 8.6% (172,215) |
Number of households with income > $200k:| North Antelope Valley: | 5.8% (2,908) |
| State: | 6.7% (134,102) |
Aggregate household income in North Antelope Valley in 2022: $4,204,301,131
Median family income in North Antelope Valley in 2022:| North Antelope Valley: | $72,598 |
| State: | $72,756 |
Number of families with income < $10k:| North Antelope Valley: | 3.8% (136) |
| California: | 4.3% (69,090) |
Number of families with income $10k - 20k:| North Antelope Valley: | 5.0% (182) |
| California: | 5.1% (82,116) |
Number of families with income $20k - 30k:| North Antelope Valley: | 8.7% (315) |
| State: | 7.0% (112,854) |
Number of families with income $30k - 40k:| North Antelope Valley: | 9.6% (349) |
| State: | 8.4% (135,938) |
Number of families with income $40k - 50k:| North Antelope Valley: | 11.8% (426) |
| California: | 8.4% (135,353) |
Number of families with income $50k - 60k:| North Antelope Valley: | 7.6% (276) |
| State: | 7.7% (124,826) |
Number of families with income $60k - 75k:| North Antelope Valley: | 13.0% (469) |
| California: | 10.7% (173,628) |
Number of families with income $75k - 100k:| North Antelope Valley: | 15.5% (563) |
| California: | 15.2% (245,724) |
Number of families with income $100k - 125k:| North Antelope Valley: | 11.3% (409) |
| State: | 10.9% (176,716) |
Number of families with income $125k - 150k:| North Antelope Valley: | 6.7% (242) |
| California: | 7.4% (119,985) |
Number of families with income > $200k:| North Antelope Valley: | 7.0% (253) |
| State: | 6.6% (106,346) |
Median non-family income in North Antelope Valley in 2022:| North Antelope Valley: | $30,050 |
| State: | $43,881 |
Change in median non-family income between 2000 and 2022:| North Antelope Valley, California: | +84.3% |
| State: | +84.6% |
Median per capita income in North Antelope Valley in 2022:| North Antelope Valley: | $24,536 |
| State: | $25,164 |
Change in median per capita income between 2000 and 2022:| North Antelope Valley, California: | +144.3% |
| State: | +137.9% |