North Coast, California (CA) income map, earnings map, and wages data
The median household income in North Coast, CA in 2022 was $108,583, which was 15.7% greater than the median annual income of $91,551 across the entire state of California. Compared to the median income of $60,135 in 2000 this represents an increase of 44.6%. The per capita income in 2022 was $55,112, which means an increase of 49.7% compared to 2000 when it was $27,722.
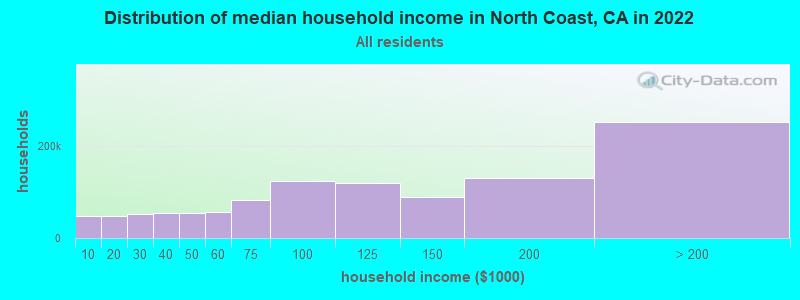
Income statistics for all residents
Median household income in North Coast, CA in 2022:| North Coast: | $108,583 |
| California: | $91,551 |
Change in median household income between 2000 and 2022:| North Coast, California: | +80.6% |
| State: | +92.8% |
Number of households with income < $10k:| North Coast: | 4.3% (47,347) |
| California: | 4.8% (654,370) |
Number of households with income $10k - 20k:| North Coast: | 4.4% (48,594) |
| State: | 5.8% (789,493) |
Number of households with income $20k - 30k:| North Coast: | 4.8% (52,787) |
| State: | 5.7% (778,318) |
Number of households with income $30k - 40k:| North Coast: | 4.8% (53,602) |
| California: | 5.8% (783,170) |
Number of households with income $40k - 50k:| North Coast: | 4.8% (53,303) |
| State: | 5.8% (781,352) |
Number of households with income $50k - 60k:| North Coast: | 5.1% (56,386) |
| State: | 5.6% (760,175) |
Number of households with income $60k - 75k:| North Coast: | 7.4% (81,843) |
| State: | 8.2% (1,104,699) |
Number of households with income $75k - 100k:| North Coast: | 11.2% (124,143) |
| State: | 12.0% (1,627,633) |
Number of households with income $100k - 125k:| North Coast: | 10.8% (120,141) |
| State: | 10.0% (1,358,619) |
Number of households with income $125k - 150k:| North Coast: | 8.1% (89,743) |
| California: | 7.6% (1,027,455) |
Number of households with income $150k - 200k:| North Coast: | 11.8% (130,400) |
| California: | 10.6% (1,439,811) |
Number of households with income > $200k:| North Coast: | 22.6% (251,197) |
| State: | 18.0% (2,445,491) |
Aggregate household income in North Coast in 2022: $159,567,360,600
Median family income in North Coast in 2022:| North Coast: | $128,735 |
| California: | $104,823 |
Median non-family income in North Coast in 2022:| North Coast: | $67,392 |
| California: | $59,348 |
Change in median non-family income between 2000 and 2022:| North Coast, California: | +68.3% |
| State: | +85.3% |
Median per capita income in North Coast in 2022:| North Coast: | $55,112 |
| State: | $46,661 |
Change in median per capita income between 2000 and 2022:| North Coast, California: | +98.8% |
| California: | +105.5% |
Income statistics for White residents
Median household income in North Coast, CA in 2022:| North Coast: | $115,674 |
| State: | $100,917 |
Change in median household income between 2000 and 2022:| North Coast, California: | +87.0% |
| State: | +96.8% |
Number of households with income < $10k:| North Coast: | 3.9% (21,169) |
| State: | 4.4% (284,109) |
Number of households with income $10k - 20k:| North Coast: | 3.9% (21,304) |
| State: | 5.3% (340,330) |
Number of households with income $20k - 30k:| North Coast: | 4.3% (23,708) |
| State: | 5.3% (343,145) |
Number of households with income $30k - 40k:| North Coast: | 4.5% (24,458) |
| California: | 5.1% (330,146) |
Number of households with income $40k - 50k:| North Coast: | 4.6% (25,075) |
| State: | 5.2% (335,310) |
Number of households with income $50k - 60k:| North Coast: | 4.8% (26,438) |
| State: | 5.1% (326,299) |
Number of households with income $60k - 75k:| North Coast: | 6.7% (36,647) |
| State: | 7.6% (487,640) |
Number of households with income $75k - 100k:| North Coast: | 10.4% (57,211) |
| State: | 11.5% (736,578) |
Number of households with income $100k - 125k:| North Coast: | 10.5% (57,933) |
| State: | 10.1% (648,782) |
Number of households with income $125k - 150k:| North Coast: | 8.0% (44,152) |
| State: | 7.8% (499,671) |
Number of households with income $150k - 200k:| North Coast: | 12.1% (66,357) |
| State: | 11.4% (729,603) |
Number of households with income > $200k:| North Coast: | 26.4% (145,102) |
| State: | 21.2% (1,364,246) |
Aggregate household income in North Coast in 2022: $89,082,228,600
Median family income in North Coast in 2022:| North Coast: | $148,450 |
| State: | $125,379 |
Number of families with income < $10k:| North Coast: | 1.8% (842) |
| State: | 2.2% (87,079) |
Number of families with income $10k - 20k:| North Coast: | 1.9% (910) |
| California: | 2.5% (97,716) |
Number of families with income $20k - 30k:| North Coast: | 2.3% (1,083) |
| State: | 3.5% (137,295) |
Number of families with income $30k - 40k:| North Coast: | 2.9% (1,339) |
| California: | 3.9% (152,947) |
Number of families with income $40k - 50k:| North Coast: | 3.7% (1,741) |
| State: | 4.3% (169,197) |
Number of families with income $50k - 60k:| North Coast: | 5.0% (2,340) |
| State: | 4.5% (176,192) |
Number of families with income $60k - 75k:| North Coast: | 6.1% (2,849) |
| State: | 7.0% (274,752) |
Number of families with income $75k - 100k:| North Coast: | 10.5% (4,908) |
| State: | 11.3% (445,632) |
Number of families with income $100k - 125k:| North Coast: | 12.5% (5,845) |
| California: | 10.7% (423,630) |
Number of families with income $125k - 150k:| North Coast: | 11.2% (5,235) |
| State: | 9.1% (357,408) |
Number of families with income $150k - 200k:| North Coast: | 14.3% (6,700) |
| State: | 13.5% (532,693) |
Number of families with income > $200k:| North Coast: | 27.8% (13,000) |
| State: | 27.6% (1,086,948) |
Median non-family income in North Coast in 2022:| North Coast: | $68,540 |
| California: | $62,819 |
Change in median non-family income between 2000 and 2022:| North Coast, California: | +71.6% |
| State: | +84.4% |
Median per capita income in North Coast in 2022:| North Coast: | $69,696 |
| California: | $61,706 |
Change in median per capita income between 2000 and 2022:| North Coast, California: | +117.3% |
| State: | +122.7% |
Income statistics for Black or African American residents
Median household income in North Coast, CA in 2022:| North Coast: | $80,150 |
| State: | $63,268 |
Change in median household income between 2000 and 2022:| North Coast, California: | +61.1% |
| State: | +81.0% |
Number of households with income < $10k:| North Coast: | 7.8% (1,454) |
| State: | 9.0% (73,219) |
Number of households with income $10k - 20k:| North Coast: | 4.0% (752) |
| State: | 10.6% (86,666) |
Number of households with income $20k - 30k:| North Coast: | 5.1% (953) |
| California: | 7.1% (57,719) |
Number of households with income $30k - 40k:| North Coast: | 11.1% (2,088) |
| State: | 7.2% (58,714) |
Number of households with income $40k - 50k:| North Coast: | 6.7% (1,255) |
| California: | 7.1% (58,075) |
Number of households with income $50k - 60k:| North Coast: | 6.0% (1,129) |
| State: | 6.8% (55,229) |
Number of households with income $60k - 75k:| North Coast: | 5.9% (1,112) |
| State: | 8.8% (71,895) |
Number of households with income $75k - 100k:| North Coast: | 9.5% (1,779) |
| State: | 11.9% (96,893) |
Number of households with income $100k - 125k:| North Coast: | 7.9% (1,479) |
| California: | 8.7% (70,729) |
Number of households with income $125k - 150k:| North Coast: | 9.0% (1,684) |
| State: | 6.3% (51,211) |
Number of households with income $150k - 200k:| North Coast: | 15.0% (2,814) |
| State: | 7.2% (58,687) |
Number of households with income > $200k:| North Coast: | 12.0% (2,247) |
| California: | 9.3% (75,487) |
Aggregate household income in North Coast in 2022: $149,864,046
Median family income in North Coast in 2022:| North Coast: | $90,429 |
| State: | $77,263 |
Number of families with income < $10k:| North Coast: | 6.7% (38) |
| State: | 5.9% (27,037) |
Number of families with income $10k - 20k:| North Coast: | 0.6% (3) |
| State: | 6.4% (29,505) |
Number of families with income $20k - 30k:| North Coast: | 6.9% (40) |
| State: | 5.6% (25,755) |
Number of families with income $30k - 40k:| North Coast: | 7.1% (40) |
| State: | 6.8% (30,948) |
Number of families with income $40k - 50k:| North Coast: | 5.2% (30) |
| State: | 8.3% (38,171) |
Number of families with income $50k - 60k:| North Coast: | 8.2% (47) |
| California: | 7.0% (31,860) |
Number of families with income $60k - 75k:| North Coast: | 6.1% (35) |
| California: | 8.7% (40,021) |
Number of families with income $75k - 100k:| North Coast: | 13.6% (78) |
| State: | 12.4% (56,846) |
Number of families with income $100k - 125k:| North Coast: | 12.4% (71) |
| State: | 9.8% (44,911) |
Number of families with income $125k - 150k:| North Coast: | 6.8% (39) |
| California: | 7.5% (34,434) |
Number of families with income $150k - 200k:| North Coast: | 3.3% (19) |
| State: | 9.3% (42,807) |
Number of families with income > $200k:| North Coast: | 23.1% (132) |
| California: | 12.2% (56,093) |
Median non-family income in North Coast in 2022:| North Coast: | $60,609 |
| State: | $41,942 |
Change in median non-family income between 2000 and 2022:| North Coast, California: | +63.0% |
| California: | +72.0% |
Median per capita income in North Coast in 2022:| North Coast: | $44,788 |
| State: | $36,708 |
Change in median per capita income between 2000 and 2022:| North Coast, California: | +86.3% |
| State: | +110.4% |
Income statistics for Asian residents
Median household income in North Coast, CA in 2022:| North Coast: | $107,034 |
| California: | $119,861 |
Change in median household income between 2000 and 2022:| North Coast, California: | +92.2% |
| State: | +116.5% |
Number of households with income < $10k:| North Coast: | 5.6% (12,694) |
| California: | 5.1% (106,273) |
Number of households with income $10k - 20k:| North Coast: | 5.0% (11,302) |
| State: | 4.9% (101,815) |
Number of households with income $20k - 30k:| North Coast: | 5.6% (12,658) |
| State: | 4.6% (94,414) |
Number of households with income $30k - 40k:| North Coast: | 4.2% (9,532) |
| California: | 4.1% (84,491) |
Number of households with income $40k - 50k:| North Coast: | 3.8% (8,692) |
| State: | 4.0% (81,758) |
Number of households with income $50k - 60k:| North Coast: | 4.2% (9,588) |
| State: | 3.9% (80,971) |
Number of households with income $60k - 75k:| North Coast: | 6.3% (14,311) |
| State: | 6.0% (124,194) |
Number of households with income $75k - 100k:| North Coast: | 9.3% (21,079) |
| State: | 9.7% (200,337) |
Number of households with income $100k - 125k:| North Coast: | 10.1% (22,739) |
| California: | 9.4% (193,488) |
Number of households with income $125k - 150k:| North Coast: | 7.9% (17,940) |
| California: | 7.7% (158,253) |
Number of households with income $150k - 200k:| North Coast: | 12.5% (28,186) |
| California: | 12.2% (252,139) |
Number of households with income > $200k:| North Coast: | 25.4% (57,331) |
| State: | 28.4% (586,641) |
Aggregate household income in North Coast in 2022: $22,323,728,661
Median family income in North Coast in 2022:| North Coast: | $118,015 |
| California: | $136,040 |
Number of families with income < $10k:| North Coast: | 3.6% (1,100) |
| California: | 2.8% (42,046) |
Number of families with income $10k - 20k:| North Coast: | 4.9% (1,503) |
| State: | 3.1% (46,821) |
Number of families with income $20k - 30k:| North Coast: | 5.9% (1,804) |
| California: | 4.1% (61,519) |
Number of families with income $30k - 40k:| North Coast: | 3.8% (1,145) |
| California: | 3.7% (55,234) |
Number of families with income $40k - 50k:| North Coast: | 4.2% (1,283) |
| State: | 3.9% (58,471) |
Number of families with income $50k - 60k:| North Coast: | 4.8% (1,459) |
| State: | 3.9% (58,911) |
Number of families with income $60k - 75k:| North Coast: | 5.8% (1,771) |
| State: | 5.9% (88,675) |
Number of families with income $75k - 100k:| North Coast: | 8.6% (2,622) |
| State: | 9.5% (143,103) |
Number of families with income $100k - 125k:| North Coast: | 9.8% (2,963) |
| State: | 9.4% (142,085) |
Number of families with income $125k - 150k:| North Coast: | 7.1% (2,159) |
| California: | 8.0% (120,635) |
Number of families with income $150k - 200k:| North Coast: | 14.8% (4,485) |
| California: | 13.2% (198,099) |
Number of families with income > $200k:| North Coast: | 26.6% (8,077) |
| State: | 32.5% (489,303) |
Median non-family income in North Coast in 2022:| North Coast: | $70,136 |
| State: | $74,216 |
Change in median non-family income between 2000 and 2022:| North Coast, California: | +85.5% |
| State: | +136.3% |
Median per capita income in North Coast in 2022:| North Coast: | $47,766 |
| State: | $58,824 |
Change in median per capita income between 2000 and 2022:| North Coast, California: | +144.1% |
| State: | +166.8% |
Income statistics for Hispanic or Latino residents
Median household income in North Coast, CA in 2022:| North Coast: | $101,956 |
| State: | $75,698 |
Change in median household income between 2000 and 2022:| North Coast, California: | +99.6% |
| State: | +107.2% |
Number of households with income < $10k:| North Coast: | 3.6% (11,253) |
| State: | 4.3% (183,294) |
Number of households with income $10k - 20k:| North Coast: | 4.0% (12,663) |
| State: | 6.0% (253,903) |
Number of households with income $20k - 30k:| North Coast: | 4.5% (14,079) |
| State: | 6.8% (286,386) |
Number of households with income $30k - 40k:| North Coast: | 6.2% (19,590) |
| State: | 7.4% (313,728) |
Number of households with income $40k - 50k:| North Coast: | 6.4% (20,023) |
| California: | 7.4% (313,199) |
Number of households with income $50k - 60k:| North Coast: | 6.6% (20,658) |
| California: | 7.2% (305,366) |
Number of households with income $60k - 75k:| North Coast: | 10.2% (32,138) |
| State: | 10.3% (434,937) |
Number of households with income $75k - 100k:| North Coast: | 15.0% (47,373) |
| California: | 14.4% (607,302) |
Number of households with income $100k - 125k:| North Coast: | 12.6% (39,790) |
| California: | 10.6% (447,424) |
Number of households with income $125k - 150k:| North Coast: | 8.3% (26,244) |
| State: | 7.5% (316,022) |
Number of households with income $150k - 200k:| North Coast: | 10.4% (32,648) |
| State: | 9.2% (386,269) |
Number of households with income > $200k:| North Coast: | 12.2% (38,495) |
| California: | 8.8% (372,651) |
Aggregate household income in North Coast in 2022: $12,402,957,531
Median family income in North Coast in 2022:| North Coast: | $103,180 |
| State: | $77,589 |
Number of families with income < $10k:| North Coast: | 3.8% (1,246) |
| State: | 3.9% (129,468) |
Number of families with income $10k - 20k:| North Coast: | 3.5% (1,142) |
| California: | 4.6% (151,997) |
Number of families with income $20k - 30k:| North Coast: | 4.7% (1,551) |
| State: | 6.6% (216,764) |
Number of families with income $30k - 40k:| North Coast: | 6.3% (2,082) |
| State: | 7.6% (249,849) |
Number of families with income $40k - 50k:| North Coast: | 8.1% (2,661) |
| State: | 7.7% (254,822) |
Number of families with income $50k - 60k:| North Coast: | 7.1% (2,329) |
| California: | 7.4% (244,815) |
Number of families with income $60k - 75k:| North Coast: | 11.0% (3,615) |
| State: | 10.5% (345,838) |
Number of families with income $75k - 100k:| North Coast: | 15.9% (5,251) |
| State: | 14.9% (491,589) |
Number of families with income $100k - 125k:| North Coast: | 12.9% (4,243) |
| California: | 10.7% (355,400) |
Number of families with income $125k - 150k:| North Coast: | 8.6% (2,849) |
| State: | 7.8% (259,317) |
Number of families with income $150k - 200k:| North Coast: | 9.2% (3,021) |
| State: | 9.3% (306,566) |
Number of families with income > $200k:| North Coast: | 9.0% (2,982) |
| California: | 9.1% (299,984) |
Median non-family income in North Coast in 2022:| North Coast: | $72,093 |
| California: | $49,746 |
Change in median non-family income between 2000 and 2022:| North Coast, California: | +78.5% |
| State: | +100.7% |
Median per capita income in North Coast in 2022:| North Coast: | $37,981 |
| California: | $27,240 |
Change in median per capita income between 2000 and 2022:| North Coast, California: | +146.0% |
| California: | +133.3% |
Income statistics for American Indian and Alaska Native residents
Median household income in North Coast, CA in 2022:| North Coast: | $99,149 |
| California: | $76,752 |
Change in median household income between 2000 and 2022:| North Coast, California: | +55.4% |
| California: | +110.0% |
Number of households with income < $10k:| North Coast: | 5.6% (633) |
| State: | 5.4% (8,471) |
Number of households with income $10k - 20k:| North Coast: | 4.0% (457) |
| State: | 6.0% (9,381) |
Number of households with income $20k - 30k:| North Coast: | 6.3% (712) |
| State: | 5.5% (8,668) |
Number of households with income $30k - 40k:| North Coast: | 12.4% (1,404) |
| State: | 8.3% (13,030) |
Number of households with income $40k - 50k:| North Coast: | 3.1% (346) |
| California: | 6.9% (10,908) |
Number of households with income $50k - 60k:| North Coast: | 5.8% (658) |
| California: | 7.1% (11,198) |
Number of households with income $60k - 75k:| North Coast: | 8.2% (932) |
| State: | 9.6% (15,190) |
Number of households with income $75k - 100k:| North Coast: | 19.8% (2,241) |
| California: | 14.1% (22,274) |
Number of households with income $100k - 125k:| North Coast: | 10.0% (1,129) |
| California: | 11.2% (17,643) |
Number of households with income $125k - 150k:| North Coast: | 6.8% (770) |
| California: | 8.3% (13,117) |
Number of households with income $150k - 200k:| North Coast: | 10.2% (1,150) |
| State: | 8.8% (13,853) |
Number of households with income > $200k:| North Coast: | 7.7% (876) |
| State: | 8.8% (13,925) |
Aggregate household income in North Coast in 2022: $144,937,326
Median family income in North Coast in 2022:| North Coast: | $94,400 |
| California: | $81,108 |
Number of families with income < $10k:| North Coast: | 1.9% (19) |
| State: | 5.0% (5,711) |
Number of families with income $10k - 20k:| North Coast: | 2.8% (28) |
| State: | 3.7% (4,148) |
Number of families with income $20k - 30k:| North Coast: | 5.3% (53) |
| State: | 4.3% (4,876) |
Number of families with income $30k - 40k:| North Coast: | 8.4% (84) |
| State: | 8.8% (9,994) |
Number of families with income $40k - 50k:| North Coast: | 5.6% (56) |
| California: | 7.8% (8,776) |
Number of families with income $50k - 60k:| North Coast: | 4.5% (45) |
| California: | 6.9% (7,834) |
Number of families with income $60k - 75k:| North Coast: | 10.8% (108) |
| State: | 9.1% (10,247) |
Number of families with income $75k - 100k:| North Coast: | 18.4% (184) |
| State: | 14.8% (16,731) |
Number of families with income $100k - 125k:| North Coast: | 11.7% (117) |
| State: | 12.0% (13,609) |
Number of families with income $150k - 200k:| North Coast: | 17.6% (176) |
| State: | 9.5% (10,721) |
Number of families with income > $200k:| North Coast: | 13.0% (130) |
| State: | 10.1% (11,409) |
Median non-family income in North Coast in 2022:| North Coast: | $75,202 |
| State: | $51,296 |
Change in median non-family income between 2000 and 2022:| North Coast, California: | +21.3% |
| California: | +114.0% |
Median per capita income in North Coast in 2022:| North Coast: | $46,145 |
| State: | $30,289 |
Change in median per capita income between 2000 and 2022:| North Coast, California: | +76.7% |
| State: | +98.9% |
Income statistics for Multirace residents
Median household income in North Coast, CA in 2022:| North Coast: | $103,345 |
| California: | $83,153 |
Change in median household income between 2000 and 2022:| North Coast, California: | +96.3% |
| State: | +106.0% |
Number of households with income < $10k:| North Coast: | 3.7% (5,861) |
| State: | 4.2% (85,299) |
Number of households with income $10k - 20k:| North Coast: | 4.7% (7,358) |
| California: | 6.1% (122,966) |
Number of households with income $20k - 30k:| North Coast: | 5.4% (8,577) |
| California: | 6.4% (129,328) |
Number of households with income $30k - 40k:| North Coast: | 5.0% (7,854) |
| State: | 6.4% (130,070) |
Number of households with income $40k - 50k:| North Coast: | 4.4% (7,017) |
| California: | 6.5% (131,254) |
Number of households with income $50k - 60k:| North Coast: | 5.7% (8,991) |
| California: | 6.5% (132,382) |
Number of households with income $60k - 75k:| North Coast: | 9.1% (14,467) |
| State: | 9.4% (191,472) |
Number of households with income $75k - 100k:| North Coast: | 13.3% (21,104) |
| State: | 13.3% (269,691) |
Number of households with income $100k - 125k:| North Coast: | 12.7% (20,152) |
| California: | 10.2% (207,286) |
Number of households with income $125k - 150k:| North Coast: | 8.0% (12,672) |
| California: | 7.8% (158,259) |
Number of households with income $150k - 200k:| North Coast: | 10.7% (16,974) |
| State: | 10.3% (209,227) |
Number of households with income > $200k:| North Coast: | 17.1% (27,093) |
| California: | 13.0% (263,210) |
Aggregate household income in North Coast in 2022: $2,661,622,547
Median family income in North Coast in 2022:| North Coast: | $110,537 |
| State: | $87,642 |
Number of families with income < $10k:| North Coast: | 1.8% (277) |
| State: | 3.2% (48,017) |
Number of families with income $10k - 20k:| North Coast: | 2.4% (372) |
| State: | 4.1% (60,419) |
Number of families with income $20k - 30k:| North Coast: | 3.8% (591) |
| California: | 6.1% (89,742) |
Number of families with income $30k - 40k:| North Coast: | 3.6% (555) |
| State: | 6.2% (91,415) |
Number of families with income $40k - 50k:| North Coast: | 3.9% (609) |
| California: | 6.8% (100,085) |
Number of families with income $50k - 60k:| North Coast: | 5.7% (891) |
| State: | 6.7% (98,298) |
Number of families with income $60k - 75k:| North Coast: | 9.4% (1,449) |
| State: | 9.5% (140,131) |
Number of families with income $75k - 100k:| North Coast: | 10.8% (1,677) |
| California: | 13.8% (203,439) |
Number of families with income $100k - 125k:| North Coast: | 11.1% (1,720) |
| California: | 10.4% (153,515) |
Number of families with income $125k - 150k:| North Coast: | 7.3% (1,124) |
| State: | 8.4% (124,115) |
Number of families with income $150k - 200k:| North Coast: | 13.7% (2,128) |
| California: | 10.9% (161,643) |
Number of families with income > $200k:| North Coast: | 26.4% (4,095) |
| State: | 14.0% (207,317) |
Median non-family income in North Coast in 2022:| North Coast: | $79,074 |
| State: | $56,558 |
Change in median non-family income between 2000 and 2022:| North Coast, California: | +88.1% |
| State: | +100.2% |
Median per capita income in North Coast in 2022:| North Coast: | $39,052 |
| State: | $32,124 |
Change in median per capita income between 2000 and 2022:| North Coast, California: | +113.1% |
| State: | +120.4% |
Income statistics for other residents
Number of households with income < $10k:| North Coast: | 3.4% (551) |
| State: | 4.6% (93,035) |
Number of households with income $10k - 20k:| North Coast: | 5.0% (803) |
| California: | 6.3% (126,222) |
Number of households with income $20k - 30k:| North Coast: | 3.9% (634) |
| State: | 7.1% (142,656) |
Number of households with income $30k - 40k:| North Coast: | 6.2% (997) |
| State: | 8.2% (165,018) |
Number of households with income $40k - 50k:| North Coast: | 8.3% (1,340) |
| State: | 8.0% (161,732) |
Number of households with income $50k - 60k:| North Coast: | 7.2% (1,151) |
| California: | 7.6% (152,152) |
Number of households with income $60k - 75k:| North Coast: | 10.9% (1,744) |
| State: | 10.4% (209,951) |
Number of households with income $75k - 100k:| North Coast: | 15.4% (2,473) |
| State: | 14.7% (296,102) |
Number of households with income $100k - 125k:| North Coast: | 11.6% (1,865) |
| California: | 10.7% (214,281) |
Number of households with income $125k - 150k:| North Coast: | 8.9% (1,426) |
| State: | 7.1% (143,092) |
Number of households with income $150k - 200k:| North Coast: | 10.0% (1,609) |
| State: | 8.6% (172,215) |
Number of households with income > $200k:| North Coast: | 9.2% (1,480) |
| State: | 6.7% (134,102) |
Aggregate household income in North Coast in 2022: $1,636,037,605
Median family income in North Coast in 2022:| North Coast: | $89,645 |
| State: | $72,756 |
Number of families with income < $10k:| North Coast: | 2.7% (201) |
| California: | 4.3% (69,090) |
Number of families with income $10k - 20k:| North Coast: | 3.2% (234) |
| State: | 5.1% (82,116) |
Number of families with income $20k - 30k:| North Coast: | 1.9% (142) |
| State: | 7.0% (112,854) |
Number of families with income $30k - 40k:| North Coast: | 4.5% (336) |
| State: | 8.4% (135,938) |
Number of families with income $40k - 50k:| North Coast: | 6.4% (474) |
| State: | 8.4% (135,353) |
Number of families with income $50k - 60k:| North Coast: | 6.1% (451) |
| State: | 7.7% (124,826) |
Number of families with income $60k - 75k:| North Coast: | 9.3% (688) |
| State: | 10.7% (173,628) |
Number of families with income $75k - 100k:| North Coast: | 14.1% (1,043) |
| State: | 15.2% (245,724) |
Number of families with income $100k - 125k:| North Coast: | 8.3% (616) |
| California: | 10.9% (176,716) |
Number of families with income $125k - 150k:| North Coast: | 14.6% (1,078) |
| State: | 7.4% (119,985) |
Number of families with income $150k - 200k:| North Coast: | 10.9% (806) |
| State: | 8.5% (137,332) |
Number of families with income > $200k:| North Coast: | 17.9% (1,326) |
| State: | 6.6% (106,346) |
Median non-family income in North Coast in 2022:| North Coast: | $74,187 |
| State: | $43,881 |
Change in median non-family income between 2000 and 2022:| North Coast, California: | +71.6% |
| California: | +84.6% |
Median per capita income in North Coast in 2022:| North Coast: | $31,623 |
| State: | $25,164 |
Change in median per capita income between 2000 and 2022:| North Coast, California: | +146.3% |
| State: | +137.9% |