North Davis, Utah (UT) income map, earnings map, and wages data
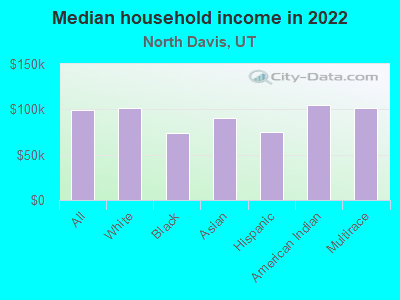
The median household income in North Davis, UT in 2022 was $99,524, which was 10.4% greater than the median annual income of $89,168 across the entire state of Utah. Compared to the median income of $51,631 in 2000 this represents an increase of 48.1%. The per capita income in 2022 was $36,138, which means an increase of 50.4% compared to 2000 when it was $17,907.
Income statistics for all residents
Median household income in North Davis, UT in 2022:| North Davis: | $99,525 |
| Utah: | $89,168 |
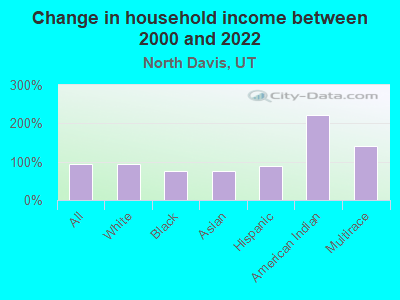
Change in median household income between 2000 and 2022:| North Davis, Utah: | +92.8% |
| State: | +95.0% |
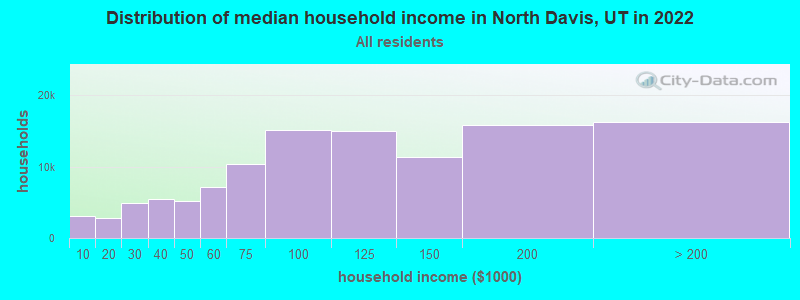
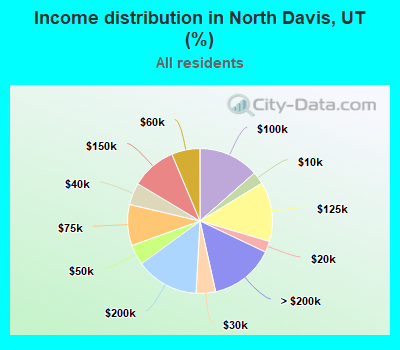
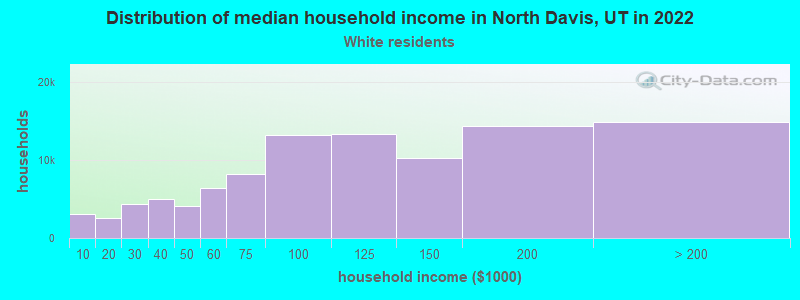
Number of households with income < $10k:| North Davis: | 2.8% (3,105) |
| State: | 3.0% (33,488) |
Number of households with income $10k - 20k:| North Davis: | 2.5% (2,815) |
| State: | 4.2% (47,659) |
Number of households with income $20k - 30k:| North Davis: | 4.3% (4,872) |
| Utah: | 5.0% (55,999) |
Number of households with income $30k - 40k:| North Davis: | 4.9% (5,491) |
| State: | 6.3% (71,296) |
Number of households with income $40k - 50k:| North Davis: | 4.6% (5,108) |
| State: | 6.0% (68,315) |
Number of households with income $50k - 60k:| North Davis: | 6.3% (7,093) |
| State: | 6.9% (77,538) |
Number of households with income $60k - 75k:| North Davis: | 9.2% (10,287) |
| Utah: | 10.1% (114,168) |
Number of households with income $75k - 100k:| North Davis: | 13.5% (15,152) |
| State: | 14.4% (163,156) |
Number of households with income $100k - 125k:| North Davis: | 13.3% (14,898) |
| Utah: | 12.0% (135,990) |
Number of households with income $125k - 150k:| North Davis: | 10.1% (11,319) |
| State: | 9.0% (101,240) |
Number of households with income $150k - 200k:| North Davis: | 14.1% (15,795) |
| State: | 11.2% (126,570) |
Number of households with income > $200k:| North Davis: | 14.5% (16,225) |
| State: | 11.9% (134,241) |
Aggregate household income in North Davis in 2022: $14,267,745,700
Median family income in North Davis in 2022:| North Davis: | $106,089 |
| State: | $102,177 |
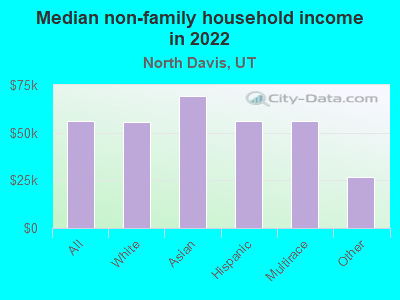
Median non-family income in North Davis in 2022:| North Davis: | $55,871 |
| Utah: | $51,496 |
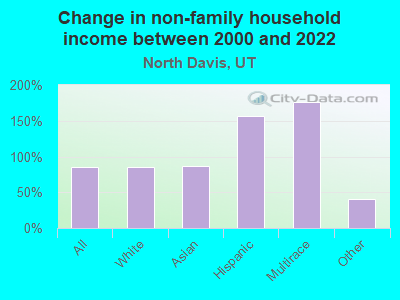
Change in median non-family income between 2000 and 2022:| North Davis, Utah: | +85.9% |
| State: | +95.0% |
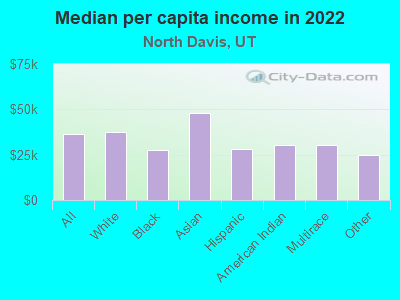
Median per capita income in North Davis in 2022:| North Davis: | $36,138 |
| State: | $38,514 |
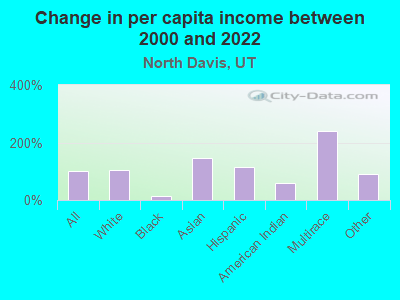
Change in median per capita income between 2000 and 2022:| North Davis, Utah: | +101.8% |
| Utah: | +111.8% |
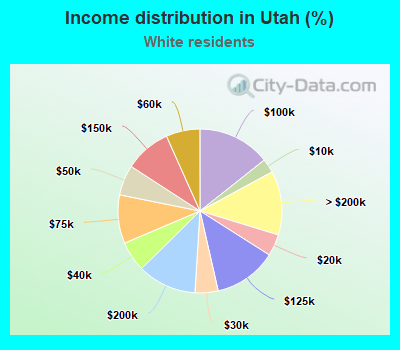
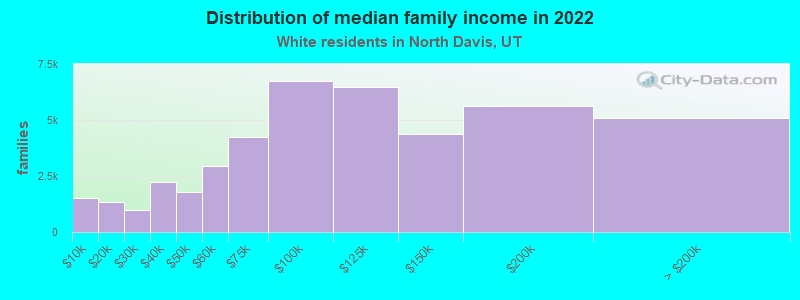
Income statistics for White residents
Median household income in North Davis, UT in 2022:| North Davis: | $101,075 |
| Utah: | $92,391 |
Change in median household income between 2000 and 2022:| North Davis, Utah: | +92.9% |
| Utah: | +98.1% |
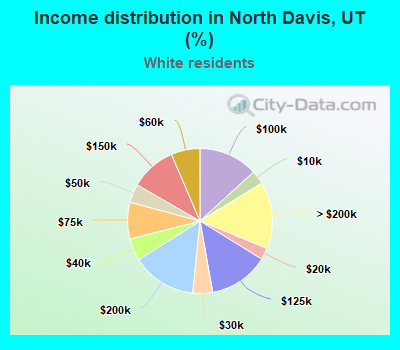
Number of households with income < $10k:| North Davis: | 3.0% (3,042) |
| State: | 2.8% (26,009) |
Number of households with income $10k - 20k:| North Davis: | 2.6% (2,621) |
| State: | 4.3% (40,322) |
Number of households with income $20k - 30k:| North Davis: | 4.4% (4,406) |
| Utah: | 4.6% (42,908) |
Number of households with income $30k - 40k:| North Davis: | 5.0% (4,961) |
| State: | 6.0% (56,214) |
Number of households with income $40k - 50k:| North Davis: | 4.1% (4,137) |
| Utah: | 6.0% (56,454) |
Number of households with income $50k - 60k:| North Davis: | 6.4% (6,433) |
| State: | 6.7% (63,011) |
Number of households with income $60k - 75k:| North Davis: | 8.2% (8,165) |
| Utah: | 9.6% (90,095) |
Number of households with income $75k - 100k:| North Davis: | 13.2% (13,193) |
| State: | 14.3% (135,141) |
Number of households with income $100k - 125k:| North Davis: | 13.4% (13,370) |
| State: | 12.4% (117,040) |
Number of households with income $125k - 150k:| North Davis: | 10.2% (10,225) |
| State: | 9.2% (86,215) |
Number of households with income $150k - 200k:| North Davis: | 14.4% (14,387) |
| State: | 11.6% (109,741) |
Number of households with income > $200k:| North Davis: | 14.9% (14,912) |
| State: | 12.6% (118,969) |
Aggregate household income in North Davis in 2022: $12,846,836,800
Median family income in North Davis in 2022:| North Davis: | $108,538 |
| State: | $106,188 |
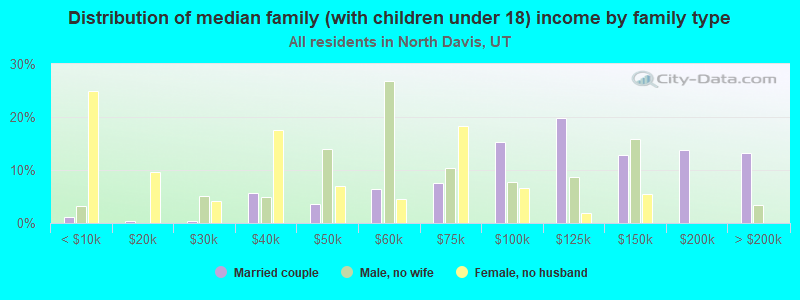
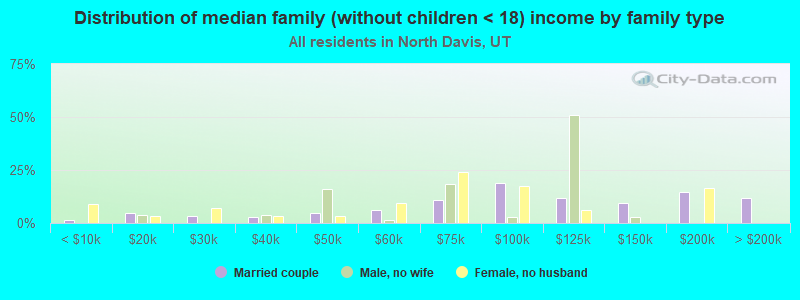
Number of families with income < $10k:| North Davis: | 3.5% (1,539) |
| State: | 1.7% (12,014) |
Number of families with income $10k - 20k:| North Davis: | 3.1% (1,336) |
| Utah: | 2.1% (14,402) |
Number of families with income $20k - 30k:| North Davis: | 2.2% (963) |
| State: | 2.8% (19,461) |
Number of families with income $30k - 40k:| North Davis: | 5.2% (2,239) |
| State: | 4.2% (28,654) |
Number of families with income $40k - 50k:| North Davis: | 4.2% (1,805) |
| State: | 4.8% (33,337) |
Number of families with income $50k - 60k:| North Davis: | 6.8% (2,948) |
| State: | 5.8% (40,104) |
Number of families with income $60k - 75k:| North Davis: | 9.8% (4,262) |
| State: | 9.3% (63,976) |
Number of families with income $75k - 100k:| North Davis: | 15.5% (6,739) |
| State: | 15.1% (103,561) |
Number of families with income $100k - 125k:| North Davis: | 14.9% (6,480) |
| State: | 14.3% (98,194) |
Number of families with income $125k - 150k:| North Davis: | 10.1% (4,396) |
| State: | 10.9% (75,223) |
Number of families with income $150k - 200k:| North Davis: | 12.9% (5,621) |
| State: | 13.8% (94,743) |
Number of families with income > $200k:| North Davis: | 11.7% (5,093) |
| State: | 15.2% (104,236) |
Median non-family income in North Davis in 2022:| North Davis: | $55,726 |
| State: | $52,493 |
Change in median non-family income between 2000 and 2022:| North Davis, Utah: | +84.6% |
| State: | +97.4% |
Median per capita income in North Davis in 2022:| North Davis: | $37,387 |
| Utah: | $41,454 |
Change in median per capita income between 2000 and 2022:| North Davis, Utah: | +105.5% |
| Utah: | +118.4% |
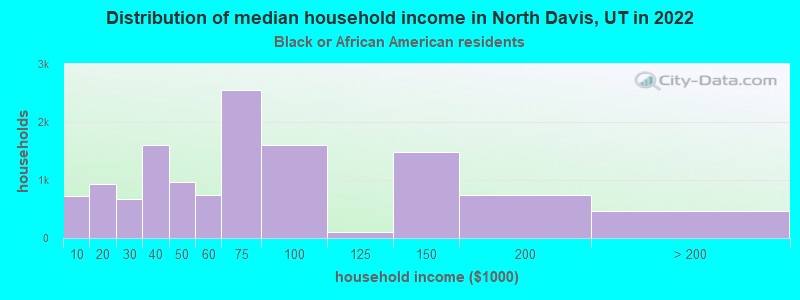
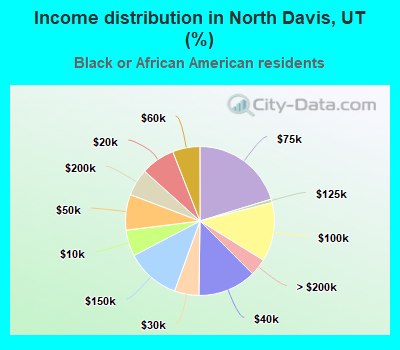
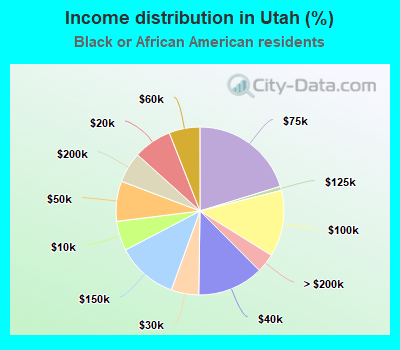
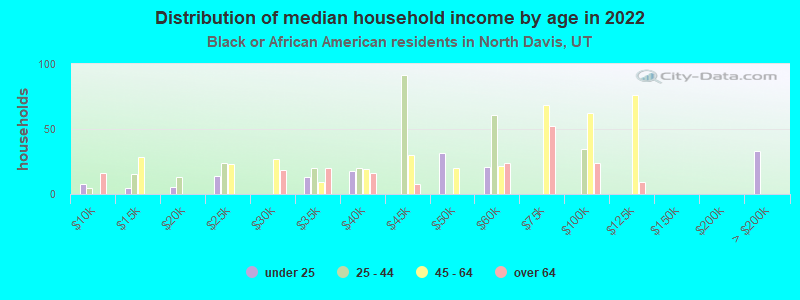
Income statistics for Black or African American residents
Median household income in North Davis, UT in 2022:| North Davis: | $74,232 |
| State: | $65,096 |
Change in median household income between 2000 and 2022:| North Davis, Utah: | +76.3% |
| Utah: | +86.3% |
Number of households with income < $10k:| North Davis: | 5.7% (717) |
| State: | 5.7% (595) |
Number of households with income $10k - 20k:| North Davis: | 7.4% (929) |
| Utah: | 7.4% (771) |
Number of households with income $20k - 30k:| North Davis: | 5.3% (668) |
| State: | 5.3% (554) |
Number of households with income $30k - 40k:| North Davis: | 12.7% (1,600) |
| State: | 12.7% (1,328) |
Number of households with income $40k - 50k:| North Davis: | 7.7% (973) |
| State: | 7.7% (807) |
Number of households with income $50k - 60k:| North Davis: | 5.9% (747) |
| State: | 5.9% (620) |
Number of households with income $60k - 75k:| North Davis: | 20.3% (2,550) |
| State: | 20.3% (2,116) |
Number of households with income $75k - 100k:| North Davis: | 12.8% (1,609) |
| State: | 12.8% (1,335) |
Number of households with income $100k - 125k:| North Davis: | 0.8% (96) |
| State: | 0.8% (80) |
Number of households with income $125k - 150k:| North Davis: | 11.8% (1,480) |
| Utah: | 11.8% (1,228) |
Number of households with income $150k - 200k:| North Davis: | 5.9% (742) |
| State: | 5.9% (616) |
Number of households with income > $200k:| North Davis: | 3.7% (463) |
| State: | 3.7% (384) |
Aggregate household income in North Davis in 2022: $128,965,974
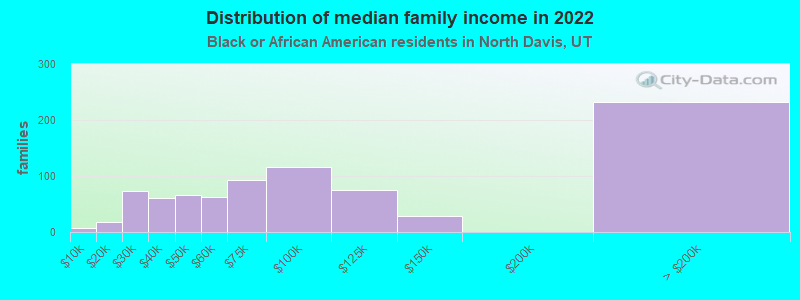
Median family income in North Davis in 2022:| North Davis: | $62,711 |
| State: | $67,622 |
Number of families with income < $10k:| North Davis: | 0.8% (7) |
| State: | 8.0% (555) |
Number of families with income $10k - 20k:| North Davis: | 2.2% (18) |
| State: | 5.2% (364) |
Number of families with income $20k - 30k:| North Davis: | 8.8% (73) |
| State: | 8.3% (579) |
Number of families with income $30k - 40k:| North Davis: | 7.4% (61) |
| Utah: | 8.9% (622) |
Number of families with income $40k - 50k:| North Davis: | 7.9% (66) |
| Utah: | 12.0% (836) |
Number of families with income $50k - 60k:| North Davis: | 7.6% (63) |
| State: | 5.0% (350) |
Number of families with income $60k - 75k:| North Davis: | 11.2% (93) |
| State: | 12.8% (890) |
Number of families with income $75k - 100k:| North Davis: | 14.0% (116) |
| State: | 11.8% (818) |
Number of families with income $100k - 125k:| North Davis: | 9.0% (75) |
| State: | 9.3% (648) |
Number of families with income $125k - 150k:| North Davis: | 3.3% (28) |
| State: | 8.7% (608) |
Number of families with income > $200k:| North Davis: | 27.9% (232) |
| Utah: | 4.5% (316) |
Median per capita income in North Davis in 2022:| North Davis: | $27,476 |
| State: | $24,132 |
Change in median per capita income between 2000 and 2022:| North Davis, Utah: | +14.3% |
| State: | +46.1% |
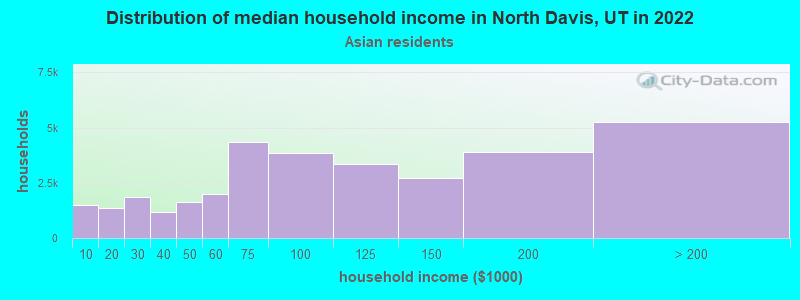
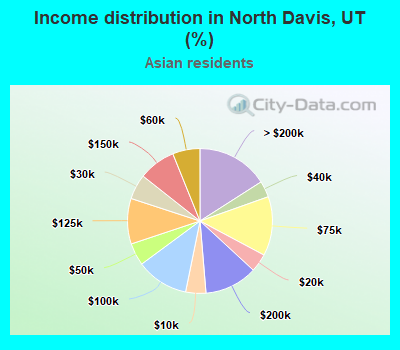
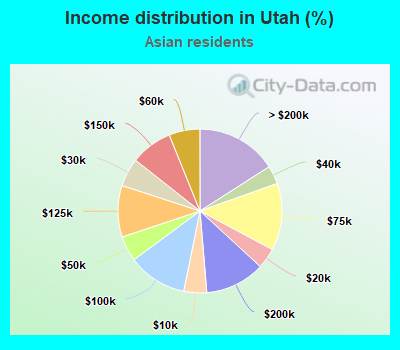
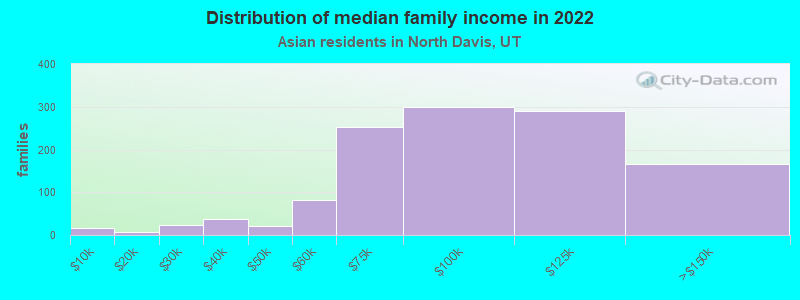
Income statistics for Asian residents
Median household income in North Davis, UT in 2022:| North Davis: | $90,891 |
| State: | $91,549 |
Change in median household income between 2000 and 2022:| North Davis, Utah: | +76.4% |
| State: | +116.8% |
Number of households with income < $10k:| North Davis: | 4.5% (1,489) |
| State: | 4.5% (1,220) |
Number of households with income $10k - 20k:| North Davis: | 4.1% (1,343) |
| Utah: | 4.1% (1,101) |
Number of households with income $20k - 30k:| North Davis: | 5.6% (1,843) |
| Utah: | 5.6% (1,510) |
Number of households with income $30k - 40k:| North Davis: | 3.6% (1,199) |
| Utah: | 3.6% (982) |
Number of households with income $40k - 50k:| North Davis: | 5.0% (1,648) |
| Utah: | 5.0% (1,350) |
Number of households with income $50k - 60k:| North Davis: | 6.1% (2,009) |
| State: | 6.1% (1,646) |
Number of households with income $60k - 75k:| North Davis: | 13.2% (4,358) |
| Utah: | 13.2% (3,571) |
Number of households with income $75k - 100k:| North Davis: | 11.7% (3,848) |
| State: | 11.7% (3,153) |
Number of households with income $100k - 125k:| North Davis: | 10.2% (3,348) |
| Utah: | 10.2% (2,743) |
Number of households with income $125k - 150k:| North Davis: | 8.3% (2,724) |
| State: | 8.3% (2,232) |
Number of households with income $150k - 200k:| North Davis: | 11.8% (3,887) |
| State: | 11.8% (3,185) |
Number of households with income > $200k:| North Davis: | 15.9% (5,251) |
| Utah: | 15.9% (4,302) |
Aggregate household income in North Davis in 2022: $185,286,722
Median family income in North Davis in 2022:| North Davis: | $116,978 |
| State: | $100,746 |
Number of families with income < $10k:| North Davis: | 1.4% (17) |
| State: | 3.0% (580) |
Number of families with income $10k - 20k:| North Davis: | 0.6% (7) |
| State: | 1.9% (373) |
Number of families with income $20k - 30k:| North Davis: | 1.9% (23) |
| Utah: | 3.9% (742) |
Number of families with income $30k - 40k:| North Davis: | 3.2% (38) |
| State: | 3.5% (662) |
Number of families with income $40k - 50k:| North Davis: | 1.7% (20) |
| Utah: | 2.2% (413) |
Number of families with income $50k - 60k:| North Davis: | 6.8% (82) |
| Utah: | 6.3% (1,206) |
Number of families with income $60k - 75k:| North Davis: | 21.1% (252) |
| Utah: | 14.3% (2,747) |
Number of families with income $75k - 100k:| North Davis: | 25.0% (299) |
| State: | 14.4% (2,765) |
Number of families with income $100k - 125k:| North Davis: | 24.2% (290) |
| Utah: | 11.3% (2,160) |
Number of families with income $125k - 150k:| North Davis: | 14.0% (167) |
| Utah: | 6.9% (1,321) |
Median non-family income in North Davis in 2022:| North Davis: | $69,356 |
| State: | $55,586 |
Change in median non-family income between 2000 and 2022:| North Davis, Utah: | +86.7% |
| Utah: | +124.9% |
Median per capita income in North Davis in 2022:| North Davis: | $48,028 |
| State: | $44,003 |
Change in median per capita income between 2000 and 2022:| North Davis, Utah: | +144.9% |
| State: | +170.0% |
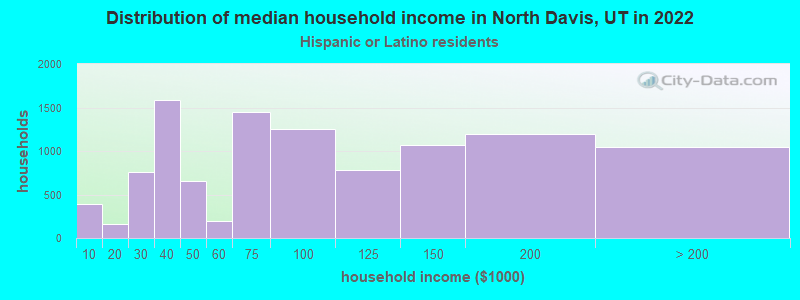
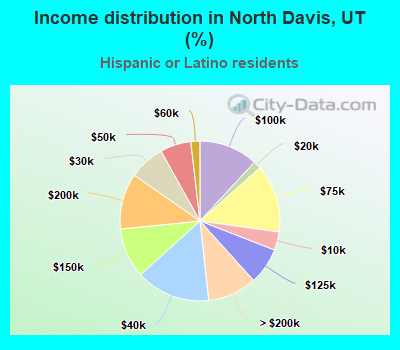
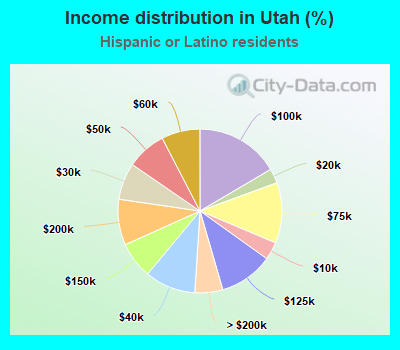
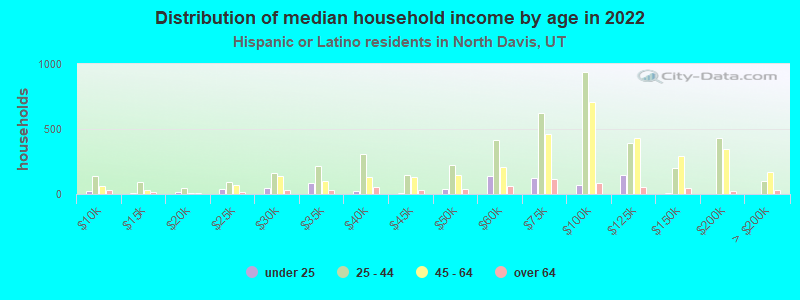
Income statistics for Hispanic or Latino residents
Median household income in North Davis, UT in 2022:| North Davis: | $74,453 |
| State: | $73,413 |
Change in median household income between 2000 and 2022:| North Davis, Utah: | +89.1% |
| State: | +104.0% |
Number of households with income < $10k:| North Davis: | 3.7% (393) |
| Utah: | 3.5% (4,767) |
Number of households with income $10k - 20k:| North Davis: | 1.6% (164) |
| Utah: | 2.9% (3,889) |
Number of households with income $20k - 30k:| North Davis: | 7.2% (762) |
| State: | 7.3% (9,868) |
Number of households with income $30k - 40k:| North Davis: | 15.0% (1,585) |
| State: | 10.0% (13,583) |
Number of households with income $40k - 50k:| North Davis: | 6.3% (659) |
| Utah: | 7.8% (10,555) |
Number of households with income $50k - 60k:| North Davis: | 1.8% (193) |
| Utah: | 7.6% (10,305) |
Number of households with income $60k - 75k:| North Davis: | 13.8% (1,450) |
| State: | 12.0% (16,184) |
Number of households with income $75k - 100k:| North Davis: | 11.9% (1,255) |
| State: | 16.5% (22,406) |
Number of households with income $100k - 125k:| North Davis: | 7.4% (779) |
| State: | 10.6% (14,387) |
Number of households with income $125k - 150k:| North Davis: | 10.1% (1,064) |
| State: | 7.2% (9,794) |
Number of households with income $150k - 200k:| North Davis: | 11.3% (1,191) |
| Utah: | 9.0% (12,222) |
Number of households with income > $200k:| North Davis: | 9.9% (1,048) |
| State: | 5.5% (7,452) |
Aggregate household income in North Davis in 2022: $866,765,603
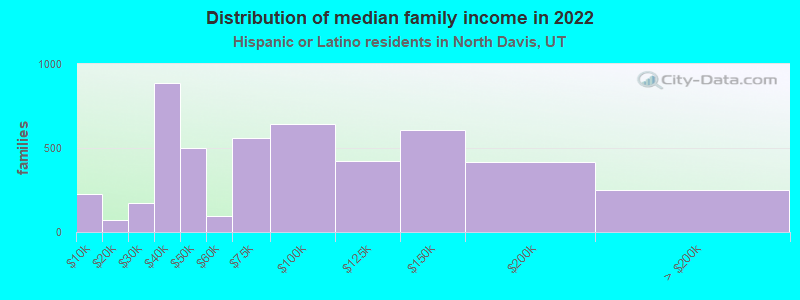
Median family income in North Davis in 2022:| North Davis: | $91,287 |
| State: | $78,462 |
Number of families with income < $10k:| North Davis: | 4.7% (226) |
| Utah: | 3.4% (3,542) |
Number of families with income $10k - 20k:| North Davis: | 1.5% (70) |
| State: | 2.4% (2,457) |
Number of families with income $20k - 30k:| North Davis: | 3.6% (172) |
| State: | 6.4% (6,619) |
Number of families with income $30k - 40k:| North Davis: | 18.3% (887) |
| Utah: | 8.5% (8,763) |
Number of families with income $40k - 50k:| North Davis: | 10.3% (500) |
| State: | 7.3% (7,476) |
Number of families with income $50k - 60k:| North Davis: | 2.0% (96) |
| State: | 7.8% (8,081) |
Number of families with income $60k - 75k:| North Davis: | 11.5% (557) |
| State: | 11.4% (11,705) |
Number of families with income $75k - 100k:| North Davis: | 13.3% (644) |
| State: | 17.5% (18,003) |
Number of families with income $100k - 125k:| North Davis: | 8.7% (422) |
| State: | 11.6% (11,927) |
Number of families with income $125k - 150k:| North Davis: | 12.6% (610) |
| Utah: | 8.6% (8,883) |
Number of families with income $150k - 200k:| North Davis: | 8.6% (416) |
| State: | 9.7% (10,034) |
Number of families with income > $200k:| North Davis: | 5.1% (248) |
| State: | 5.4% (5,596) |
Median non-family income in North Davis in 2022:| North Davis: | $55,981 |
| State: | $47,749 |
Median per capita income in North Davis in 2022:| North Davis: | $28,298 |
| State: | $24,209 |
Change in median per capita income between 2000 and 2022:| North Davis, Utah: | +116.2% |
| Utah: | +119.3% |
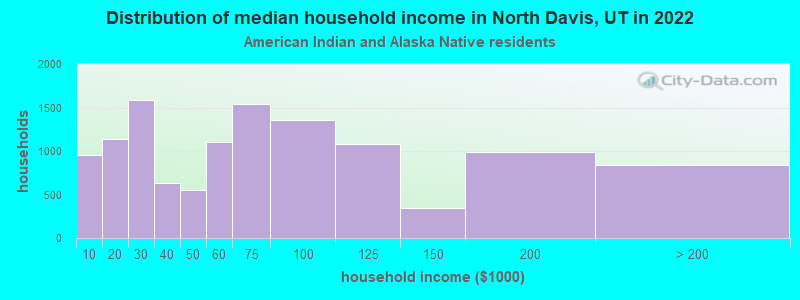
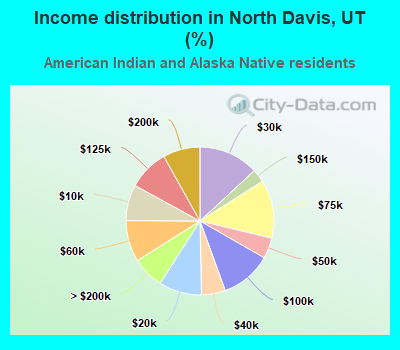
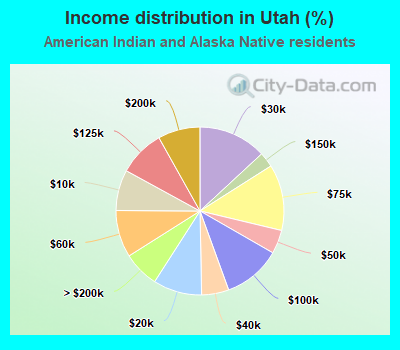
Income statistics for American Indian and Alaska Native residents
Median household income in North Davis, UT in 2022:| North Davis: | $104,275 |
| State: | $62,277 |
Number of households with income < $10k:| North Davis: | 7.9% (951) |
| State: | 7.9% (792) |
Number of households with income $10k - 20k:| North Davis: | 9.4% (1,138) |
| Utah: | 9.4% (947) |
Number of households with income $20k - 30k:| North Davis: | 13.1% (1,587) |
| State: | 13.1% (1,322) |
Number of households with income $30k - 40k:| North Davis: | 5.2% (633) |
| Utah: | 5.2% (527) |
Number of households with income $40k - 50k:| North Davis: | 4.6% (552) |
| State: | 4.6% (460) |
Number of households with income $50k - 60k:| North Davis: | 9.1% (1,099) |
| State: | 9.1% (915) |
Number of households with income $60k - 75k:| North Davis: | 12.7% (1,542) |
| Utah: | 12.7% (1,284) |
Number of households with income $75k - 100k:| North Davis: | 11.2% (1,351) |
| Utah: | 11.2% (1,125) |
Number of households with income $100k - 125k:| North Davis: | 8.9% (1,078) |
| State: | 8.9% (898) |
Number of households with income $125k - 150k:| North Davis: | 2.9% (349) |
| State: | 2.9% (291) |
Number of households with income $150k - 200k:| North Davis: | 8.1% (984) |
| State: | 8.1% (819) |
Number of households with income > $200k:| North Davis: | 6.9% (839) |
| Utah: | 6.9% (699) |
Aggregate household income in North Davis in 2022: $38,767,479
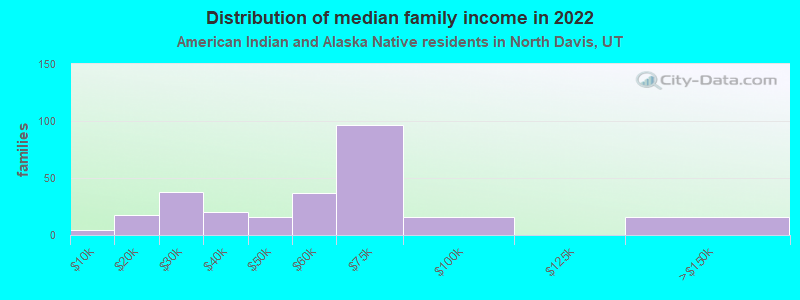
Median family income in North Davis in 2022:| North Davis: | $105,466 |
| State: | $64,962 |
Number of families with income < $10k:| North Davis: | 1.7% (4) |
| State: | 2.8% (195) |
Number of families with income $10k - 20k:| North Davis: | 6.7% (17) |
| State: | 7.3% (514) |
Number of families with income $20k - 30k:| North Davis: | 14.5% (38) |
| Utah: | 13.2% (929) |
Number of families with income $30k - 40k:| North Davis: | 7.7% (20) |
| State: | 8.2% (579) |
Number of families with income $40k - 50k:| North Davis: | 5.9% (15) |
| State: | 5.4% (377) |
Number of families with income $50k - 60k:| North Davis: | 14.1% (37) |
| Utah: | 9.2% (648) |
Number of families with income $60k - 75k:| North Davis: | 37.2% (97) |
| State: | 14.2% (1,001) |
Number of families with income $75k - 100k:| North Davis: | 6.1% (16) |
| State: | 7.5% (530) |
Number of families with income $125k - 150k:| North Davis: | 5.9% (15) |
| State: | 3.1% (216) |
Median per capita income in North Davis in 2022:| North Davis: | $30,307 |
| State: | $26,201 |
Change in median per capita income between 2000 and 2022:| North Davis, Utah: | +59.7% |
| Utah: | +155.3% |
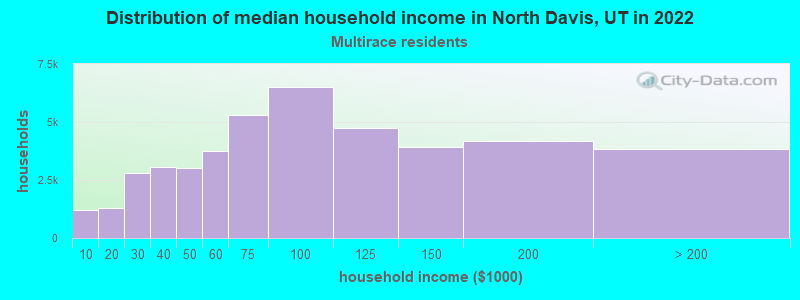
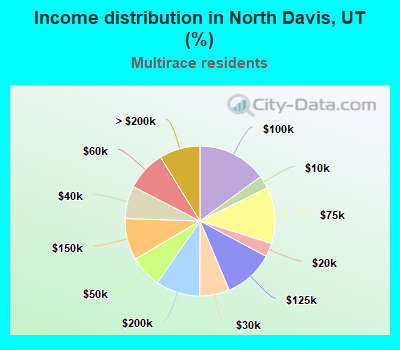
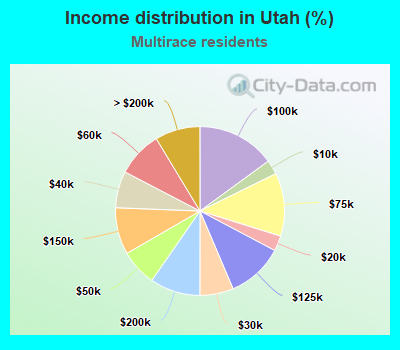
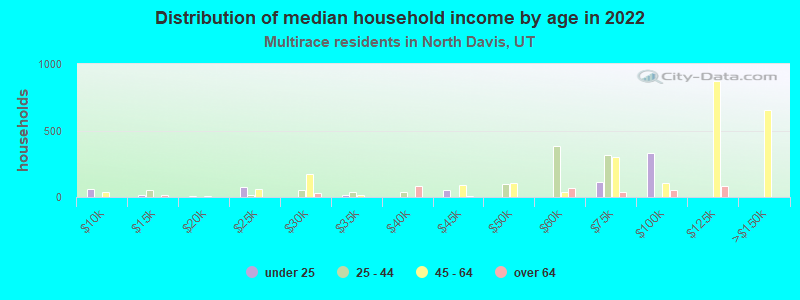
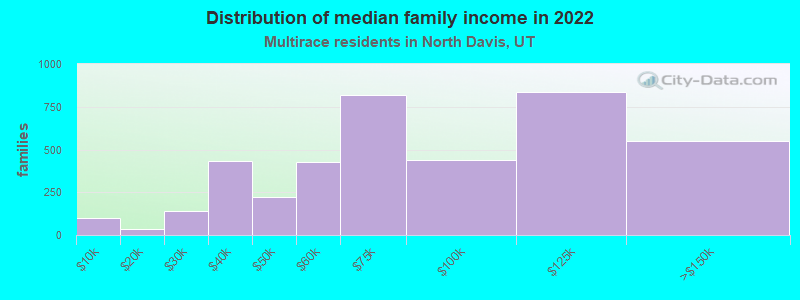
Income statistics for Multirace residents
Median household income in North Davis, UT in 2022:| North Davis: | $101,329 |
| State: | $78,966 |
Change in median household income between 2000 and 2022:| North Davis, Utah: | +139.6% |
| Utah: | +108.3% |
Number of households with income < $10k:| North Davis: | 2.7% (1,196) |
| State: | 2.8% (2,136) |
Number of households with income $10k - 20k:| North Davis: | 2.9% (1,282) |
| State: | 2.9% (2,270) |
Number of households with income $20k - 30k:| North Davis: | 6.4% (2,802) |
| Utah: | 6.4% (4,994) |
Number of households with income $30k - 40k:| North Davis: | 7.0% (3,065) |
| State: | 7.0% (5,443) |
Number of households with income $40k - 50k:| North Davis: | 6.9% (3,014) |
| Utah: | 7.0% (5,407) |
Number of households with income $50k - 60k:| North Davis: | 8.6% (3,765) |
| State: | 8.7% (6,751) |
Number of households with income $60k - 75k:| North Davis: | 12.2% (5,306) |
| Utah: | 12.1% (9,384) |
Number of households with income $75k - 100k:| North Davis: | 15.0% (6,530) |
| State: | 15.0% (11,608) |
Number of households with income $100k - 125k:| North Davis: | 10.8% (4,723) |
| Utah: | 10.8% (8,406) |
Number of households with income $125k - 150k:| North Davis: | 9.0% (3,925) |
| State: | 9.0% (6,968) |
Number of households with income $150k - 200k:| North Davis: | 9.6% (4,166) |
| State: | 9.6% (7,467) |
Number of households with income > $200k:| North Davis: | 8.8% (3,833) |
| State: | 8.6% (6,701) |
Aggregate household income in North Davis in 2022: $509,080,947
Median family income in North Davis in 2022:| North Davis: | $111,636 |
| State: | $84,093 |
Number of families with income < $10k:| North Davis: | 2.5% (100) |
| Utah: | 2.8% (1,575) |
Number of families with income $10k - 20k:| North Davis: | 0.8% (33) |
| State: | 2.8% (1,597) |
Number of families with income $20k - 30k:| North Davis: | 3.5% (141) |
| Utah: | 5.7% (3,278) |
Number of families with income $30k - 40k:| North Davis: | 10.8% (432) |
| State: | 5.5% (3,166) |
Number of families with income $40k - 50k:| North Davis: | 5.5% (220) |
| Utah: | 5.8% (3,292) |
Number of families with income $50k - 60k:| North Davis: | 10.7% (426) |
| State: | 9.4% (5,397) |
Number of families with income $60k - 75k:| North Davis: | 20.5% (819) |
| State: | 11.5% (6,594) |
Number of families with income $75k - 100k:| North Davis: | 11.0% (440) |
| State: | 14.5% (8,264) |
Number of families with income $100k - 125k:| North Davis: | 20.9% (837) |
| State: | 10.8% (6,171) |
Number of families with income $125k - 150k:| North Davis: | 13.7% (549) |
| State: | 10.0% (5,718) |
Median non-family income in North Davis in 2022:| North Davis: | $56,110 |
| State: | $55,945 |
Median per capita income in North Davis in 2022:| North Davis: | $30,347 |
| State: | $26,810 |
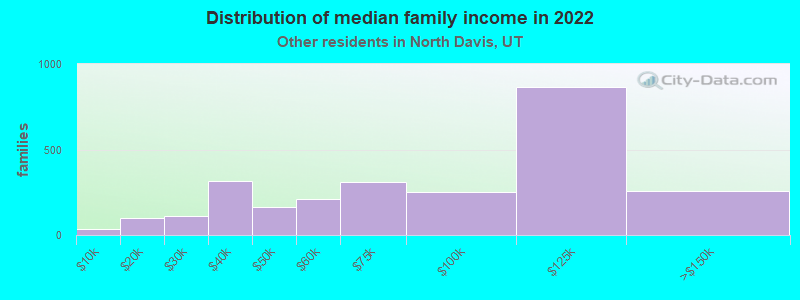
Income statistics for other residents
Number of households with income < $10k:| North Davis: | 4.9% (142) |
| Utah: | 4.9% (2,640) |
Number of households with income $10k - 20k:| North Davis: | 3.6% (105) |
| State: | 3.6% (1,953) |
Number of households with income $20k - 30k:| North Davis: | 7.5% (219) |
| State: | 7.5% (4,068) |
Number of households with income $30k - 40k:| North Davis: | 11.3% (328) |
| State: | 11.3% (6,097) |
Number of households with income $40k - 50k:| North Davis: | 6.5% (188) |
| State: | 6.5% (3,496) |
Number of households with income $50k - 60k:| North Davis: | 7.6% (221) |
| State: | 7.6% (4,115) |
Number of households with income $60k - 75k:| North Davis: | 12.0% (347) |
| Utah: | 12.0% (6,454) |
Number of households with income $75k - 100k:| North Davis: | 17.4% (505) |
| State: | 17.4% (9,392) |
Number of households with income $100k - 125k:| North Davis: | 10.5% (305) |
| State: | 10.5% (5,675) |
Number of households with income $125k - 150k:| North Davis: | 7.1% (207) |
| State: | 7.1% (3,847) |
Number of households with income $150k - 200k:| North Davis: | 7.8% (226) |
| Utah: | 7.8% (4,200) |
Number of households with income > $200k:| North Davis: | 3.8% (109) |
| Utah: | 3.8% (2,030) |
Aggregate household income in North Davis in 2022: $164,931,211
Median family income in North Davis in 2022:| North Davis: | $75,006 |
| State: | $72,797 |
Number of families with income < $10k:| North Davis: | 1.3% (33) |
| State: | 3.9% (1,710) |
Number of families with income $10k - 20k:| North Davis: | 3.8% (100) |
| Utah: | 3.2% (1,397) |
Number of families with income $20k - 30k:| North Davis: | 4.3% (113) |
| Utah: | 6.1% (2,688) |
Number of families with income $30k - 40k:| North Davis: | 12.0% (314) |
| Utah: | 10.1% (4,419) |
Number of families with income $40k - 50k:| North Davis: | 6.2% (161) |
| State: | 7.0% (3,079) |
Number of families with income $50k - 60k:| North Davis: | 8.1% (211) |
| Utah: | 8.8% (3,872) |
Number of families with income $60k - 75k:| North Davis: | 11.8% (309) |
| State: | 13.0% (5,696) |
Number of families with income $75k - 100k:| North Davis: | 9.7% (253) |
| State: | 17.3% (7,594) |
Number of families with income $100k - 125k:| North Davis: | 33.2% (868) |
| State: | 11.3% (4,965) |
Number of families with income $125k - 150k:| North Davis: | 9.8% (255) |
| State: | 8.5% (3,722) |
Median non-family income in North Davis in 2022:| North Davis: | $26,509 |
| Utah: | $35,466 |
Change in median non-family income between 2000 and 2022:| North Davis, Utah: | +41.4% |
| State: | +50.2% |
Median per capita income in North Davis in 2022:| North Davis: | $24,563 |
| State: | $22,765 |
Change in median per capita income between 2000 and 2022:| North Davis, Utah: | +91.5% |
| Utah: | +117.3% |