North Stonington, Connecticut (CT) income map, earnings map, and wages data
The median household income in North Stonington, CT in 2022 was $97,952, which was 9.7% greater than the median annual income of $88,429 across the entire state of Connecticut. Compared to the median income of $57,887 in 2000 this represents an increase of 40.9%. The per capita income in 2022 was $47,223, which means an increase of 45.3% compared to 2000 when it was $25,815.
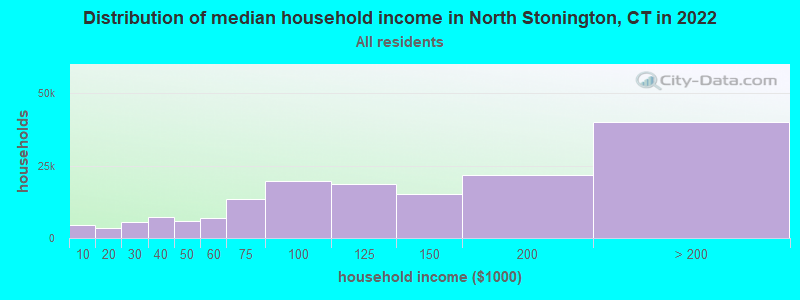
Income statistics for all residents
Median household income in North Stonington, CT in 2022:| North Stonington: | $97,953 |
| State: | $88,429 |
Change in median household income between 2000 and 2022:| North Stonington, Connecticut: | +69.2% |
| Connecticut: | +64.0% |
Number of households with income < $10k:| North Stonington: | 5.2% (39,898) |
| State: | 5.1% (72,746) |
Number of households with income $10k - 20k:| North Stonington: | 5.8% (44,991) |
| Connecticut: | 5.7% (81,643) |
Number of households with income $20k - 30k:| North Stonington: | 6.6% (50,925) |
| State: | 6.5% (92,844) |
Number of households with income $30k - 40k:| North Stonington: | 5.9% (45,702) |
| State: | 5.9% (83,934) |
Number of households with income $40k - 50k:| North Stonington: | 5.9% (45,410) |
| Connecticut: | 5.8% (83,025) |
Number of households with income $50k - 60k:| North Stonington: | 5.8% (44,527) |
| Connecticut: | 5.7% (81,788) |
Number of households with income $60k - 75k:| North Stonington: | 8.1% (62,387) |
| State: | 8.1% (115,651) |
Number of households with income $75k - 100k:| North Stonington: | 12.6% (97,435) |
| State: | 12.6% (180,173) |
Number of households with income $100k - 125k:| North Stonington: | 9.8% (75,852) |
| Connecticut: | 9.9% (141,231) |
Number of households with income $125k - 150k:| North Stonington: | 7.8% (60,575) |
| Connecticut: | 7.9% (112,826) |
Number of households with income $150k - 200k:| North Stonington: | 10.7% (82,862) |
| State: | 10.8% (154,641) |
Number of households with income > $200k:| North Stonington: | 16.0% (123,791) |
| State: | 16.3% (233,133) |
Aggregate household income in North Stonington in 2022: $5,434,889,931
Median family income in North Stonington in 2022:| North Stonington: | $110,255 |
| State: | $115,183 |
Median non-family income in North Stonington in 2022:| North Stonington: | $69,201 |
| State: | $50,964 |
Change in median non-family income between 2000 and 2022:| North Stonington, Connecticut: | +71.5% |
| State: | +65.1% |
Median per capita income in North Stonington in 2022:| North Stonington: | $47,223 |
| State: | $51,581 |
Change in median per capita income between 2000 and 2022:| North Stonington, Connecticut: | +82.9% |
| State: | +79.3% |
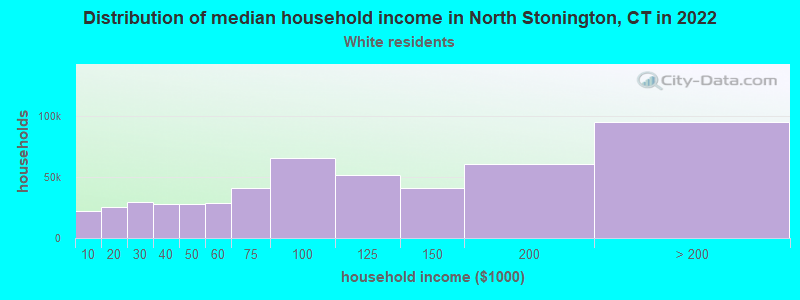
Income statistics for White residents
Median household income in North Stonington, CT in 2022:| North Stonington: | $99,943 |
| State: | $96,890 |
Change in median household income between 2000 and 2022:| North Stonington, Connecticut: | +69.4% |
| Connecticut: | +68.5% |
Number of households with income < $10k:| North Stonington: | 4.2% (21,860) |
| State: | 4.2% (42,265) |
Number of households with income $10k - 20k:| North Stonington: | 4.9% (25,132) |
| State: | 4.8% (48,323) |
Number of households with income $20k - 30k:| North Stonington: | 5.8% (29,888) |
| State: | 5.7% (57,716) |
Number of households with income $30k - 40k:| North Stonington: | 5.4% (27,666) |
| State: | 5.3% (53,827) |
Number of households with income $40k - 50k:| North Stonington: | 5.3% (27,552) |
| State: | 5.3% (53,301) |
Number of households with income $50k - 60k:| North Stonington: | 5.6% (28,673) |
| State: | 5.5% (55,690) |
Number of households with income $60k - 75k:| North Stonington: | 7.9% (40,976) |
| Connecticut: | 8.0% (80,329) |
Number of households with income $75k - 100k:| North Stonington: | 12.7% (65,658) |
| Connecticut: | 12.7% (128,070) |
Number of households with income $100k - 125k:| North Stonington: | 10.0% (51,557) |
| State: | 10.0% (101,210) |
Number of households with income $125k - 150k:| North Stonington: | 8.0% (41,392) |
| State: | 8.0% (81,250) |
Number of households with income $150k - 200k:| North Stonington: | 11.8% (60,862) |
| State: | 11.8% (119,527) |
Number of households with income > $200k:| North Stonington: | 18.4% (95,278) |
| Connecticut: | 18.6% (187,875) |
Aggregate household income in North Stonington in 2022: $3,933,166,388
Median family income in North Stonington in 2022:| North Stonington: | $114,083 |
| State: | $128,955 |
Number of families with income < $10k:| North Stonington: | 3.8% (38) |
| Connecticut: | 1.9% (11,537) |
Number of families with income $10k - 20k:| North Stonington: | 1.6% (15) |
| Connecticut: | 1.8% (11,289) |
Number of families with income $20k - 30k:| North Stonington: | 3.5% (34) |
| State: | 3.0% (18,506) |
Number of families with income $30k - 40k:| North Stonington: | 4.1% (41) |
| State: | 2.9% (18,160) |
Number of families with income $40k - 50k:| North Stonington: | 6.1% (61) |
| State: | 3.9% (24,550) |
Number of families with income $50k - 60k:| North Stonington: | 7.7% (76) |
| State: | 4.3% (26,723) |
Number of families with income $60k - 75k:| North Stonington: | 10.7% (106) |
| Connecticut: | 7.1% (44,075) |
Number of families with income $75k - 100k:| North Stonington: | 13.7% (136) |
| Connecticut: | 12.5% (77,679) |
Number of families with income $100k - 125k:| North Stonington: | 11.3% (112) |
| Connecticut: | 11.1% (69,086) |
Number of families with income $125k - 150k:| North Stonington: | 13.9% (138) |
| State: | 9.6% (59,616) |
Number of families with income $150k - 200k:| North Stonington: | 9.4% (94) |
| State: | 15.7% (97,890) |
Number of families with income > $200k:| North Stonington: | 14.2% (141) |
| State: | 26.3% (163,417) |
Median non-family income in North Stonington in 2022:| North Stonington: | $71,486 |
| State: | $54,067 |
Change in median non-family income between 2000 and 2022:| North Stonington, Connecticut: | +73.7% |
| State: | +68.7% |
Median per capita income in North Stonington in 2022:| North Stonington: | $49,706 |
| Connecticut: | $59,916 |
Change in median per capita income between 2000 and 2022:| North Stonington, Connecticut: | +92.1% |
| State: | +90.2% |
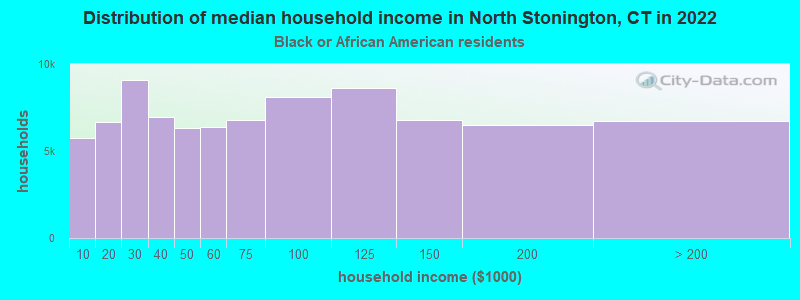
Income statistics for Black or African American residents
Median household income in North Stonington, CT in 2022:| North Stonington: | $34,193 |
| Connecticut: | $61,803 |
Change in median household income between 2000 and 2022:| North Stonington, Connecticut: | +60.9% |
| Connecticut: | +76.1% |
Number of households with income < $10k:| North Stonington: | 6.8% (5,747) |
| Connecticut: | 6.8% (9,494) |
Number of households with income $10k - 20k:| North Stonington: | 7.9% (6,661) |
| Connecticut: | 7.9% (11,003) |
Number of households with income $20k - 30k:| North Stonington: | 10.8% (9,107) |
| State: | 10.8% (15,045) |
Number of households with income $30k - 40k:| North Stonington: | 8.2% (6,962) |
| State: | 8.2% (11,501) |
Number of households with income $40k - 50k:| North Stonington: | 7.4% (6,306) |
| Connecticut: | 7.4% (10,416) |
Number of households with income $50k - 60k:| North Stonington: | 7.5% (6,377) |
| Connecticut: | 7.5% (10,534) |
Number of households with income $60k - 75k:| North Stonington: | 8.0% (6,806) |
| State: | 8.0% (11,244) |
Number of households with income $75k - 100k:| North Stonington: | 9.6% (8,093) |
| State: | 9.6% (13,370) |
Number of households with income $100k - 125k:| North Stonington: | 10.2% (8,623) |
| State: | 10.2% (14,244) |
Number of households with income $125k - 150k:| North Stonington: | 8.0% (6,808) |
| State: | 8.0% (11,246) |
Number of households with income $150k - 200k:| North Stonington: | 7.7% (6,494) |
| State: | 7.7% (10,727) |
Number of households with income > $200k:| North Stonington: | 7.9% (6,711) |
| State: | 7.9% (11,086) |
Aggregate household income in North Stonington in 2022: $709,339
Median family income in North Stonington in 2022:| North Stonington: | $47,217 |
| Connecticut: | $87,228 |
Median per capita income in North Stonington in 2022:| North Stonington: | $34,814 |
| State: | $36,289 |
Change in median per capita income between 2000 and 2022:| North Stonington, Connecticut: | +115.2% |
| State: | +117.5% |
Income statistics for Asian residents
Number of households with income < $10k:| North Stonington: | 7.1% (1,671) |
| State: | 7.1% (4,245) |
Number of households with income $10k - 20k:| North Stonington: | 3.5% (821) |
| Connecticut: | 3.5% (2,087) |
Number of households with income $20k - 30k:| North Stonington: | 4.1% (969) |
| State: | 4.1% (2,464) |
Number of households with income $30k - 40k:| North Stonington: | 4.1% (976) |
| Connecticut: | 4.1% (2,478) |
Number of households with income $40k - 50k:| North Stonington: | 3.3% (780) |
| State: | 3.3% (1,983) |
Number of households with income $50k - 60k:| North Stonington: | 3.9% (916) |
| Connecticut: | 3.9% (2,328) |
Number of households with income $60k - 75k:| North Stonington: | 7.0% (1,664) |
| State: | 7.0% (4,228) |
Number of households with income $75k - 100k:| North Stonington: | 11.5% (2,720) |
| State: | 11.5% (6,911) |
Number of households with income $100k - 125k:| North Stonington: | 10.2% (2,412) |
| Connecticut: | 10.2% (6,127) |
Number of households with income $125k - 150k:| North Stonington: | 8.5% (1,999) |
| State: | 8.5% (5,079) |
Number of households with income $150k - 200k:| North Stonington: | 12.4% (2,926) |
| State: | 12.4% (7,434) |
Number of households with income > $200k:| North Stonington: | 24.4% (5,770) |
| Connecticut: | 24.4% (14,661) |
Median per capita income in North Stonington in 2022:| North Stonington: | $22,401 |
| State: | $55,295 |
Change in median per capita income between 2000 and 2022:| North Stonington, Connecticut: | +103.6% |
| Connecticut: | +97.8% |
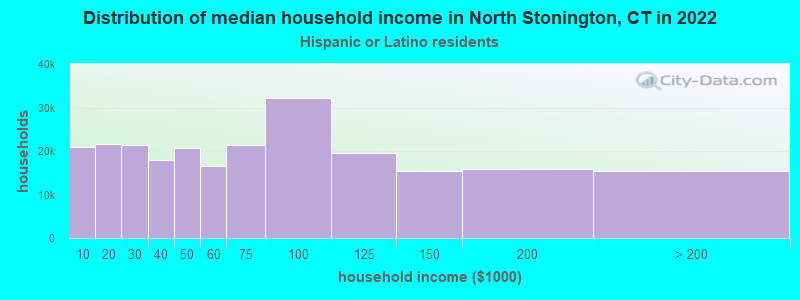
Income statistics for Hispanic or Latino residents
Median household income in North Stonington, CT in 2022:| North Stonington: | $60,592 |
| State: | $60,275 |
Change in median household income between 2000 and 2022:| North Stonington, Connecticut: | +67.8% |
| Connecticut: | +87.9% |
Number of households with income < $10k:| North Stonington: | 8.7% (20,922) |
| State: | 8.7% (18,584) |
Number of households with income $10k - 20k:| North Stonington: | 9.1% (21,656) |
| State: | 9.1% (19,235) |
Number of households with income $20k - 30k:| North Stonington: | 8.9% (21,379) |
| Connecticut: | 8.9% (18,989) |
Number of households with income $30k - 40k:| North Stonington: | 7.5% (17,976) |
| State: | 7.5% (15,967) |
Number of households with income $40k - 50k:| North Stonington: | 8.7% (20,789) |
| State: | 8.7% (18,466) |
Number of households with income $50k - 60k:| North Stonington: | 6.9% (16,556) |
| State: | 6.9% (14,706) |
Number of households with income $60k - 75k:| North Stonington: | 8.9% (21,265) |
| Connecticut: | 8.9% (18,888) |
Number of households with income $75k - 100k:| North Stonington: | 13.5% (32,276) |
| Connecticut: | 13.5% (28,669) |
Number of households with income $100k - 125k:| North Stonington: | 8.2% (19,628) |
| State: | 8.2% (17,434) |
Number of households with income $125k - 150k:| North Stonington: | 6.5% (15,482) |
| State: | 6.5% (13,752) |
Number of households with income $150k - 200k:| North Stonington: | 6.6% (15,890) |
| State: | 6.6% (14,114) |
Number of households with income > $200k:| North Stonington: | 6.4% (15,345) |
| State: | 6.4% (13,630) |
Aggregate household income in North Stonington in 2022: $15,386,886
Median family income in North Stonington in 2022:| North Stonington: | $36,048 |
| Connecticut: | $68,336 |
Number of families with income < $10k:| North Stonington: | 7.0% (19) |
| State: | 5.2% (7,456) |
Number of families with income $10k - 20k:| North Stonington: | 3.3% (9) |
| State: | 6.0% (8,616) |
Number of families with income $20k - 30k:| North Stonington: | 9.8% (26) |
| State: | 8.9% (12,680) |
Number of families with income $30k - 40k:| North Stonington: | 9.0% (24) |
| State: | 8.5% (12,090) |
Number of families with income $40k - 50k:| North Stonington: | 11.8% (32) |
| State: | 8.8% (12,624) |
Number of families with income $50k - 60k:| North Stonington: | 12.5% (34) |
| Connecticut: | 8.4% (11,924) |
Number of families with income $60k - 75k:| North Stonington: | 10.7% (29) |
| State: | 8.9% (12,677) |
Number of families with income $75k - 100k:| North Stonington: | 13.3% (36) |
| State: | 14.3% (20,457) |
Number of families with income $100k - 125k:| North Stonington: | 6.6% (18) |
| Connecticut: | 8.2% (11,720) |
Number of families with income $125k - 150k:| North Stonington: | 9.7% (26) |
| State: | 8.2% (11,729) |
Number of families with income $150k - 200k:| North Stonington: | 3.3% (9) |
| State: | 7.1% (10,096) |
Number of families with income > $200k:| North Stonington: | 3.0% (8) |
| Connecticut: | 7.4% (10,622) |
Median non-family income in North Stonington in 2022:| North Stonington: | $64,723 |
| State: | $36,714 |
Change in median non-family income between 2000 and 2022:| North Stonington, Connecticut: | +73.9% |
| State: | +90.0% |
Median per capita income in North Stonington in 2022:| North Stonington: | $28,067 |
| State: | $28,507 |
Change in median per capita income between 2000 and 2022:| North Stonington, Connecticut: | +80.3% |
| State: | +117.2% |
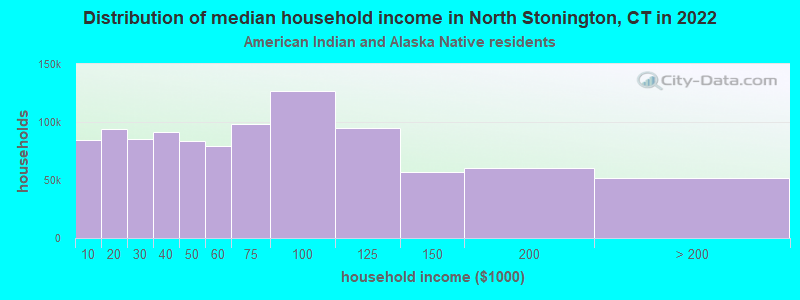
Income statistics for American Indian and Alaska Native residents
Median household income in North Stonington, CT in 2022:| North Stonington: | $33,507 |
| Connecticut: | $41,848 |
Change in median household income between 2000 and 2022:| North Stonington, Connecticut: | +12.9% |
| State: | +12.9% |
Number of households with income < $10k:| North Stonington: | 8.4% (84,420) |
| Connecticut: | 10.2% (340) |
Number of households with income $10k - 20k:| North Stonington: | 9.4% (94,210) |
| State: | 8.5% (283) |
Number of households with income $20k - 30k:| North Stonington: | 8.5% (85,214) |
| State: | 9.4% (314) |
Number of households with income $30k - 40k:| North Stonington: | 9.1% (91,296) |
| State: | 10.1% (337) |
Number of households with income $40k - 50k:| North Stonington: | 8.3% (83,743) |
| Connecticut: | 13.4% (447) |
Number of households with income $50k - 60k:| North Stonington: | 7.8% (78,963) |
| State: | 3.1% (104) |
Number of households with income $60k - 75k:| North Stonington: | 9.8% (98,424) |
| State: | 5.6% (188) |
Number of households with income $75k - 100k:| North Stonington: | 12.6% (127,049) |
| Connecticut: | 13.4% (447) |
Number of households with income $100k - 125k:| North Stonington: | 9.4% (95,008) |
| State: | 9.5% (317) |
Number of households with income $125k - 150k:| North Stonington: | 5.6% (56,881) |
| State: | 3.9% (131) |
Number of households with income $150k - 200k:| North Stonington: | 6.0% (59,963) |
| Connecticut: | 6.3% (212) |
Number of households with income > $200k:| North Stonington: | 5.2% (51,901) |
| Connecticut: | 6.8% (228) |
Aggregate household income in North Stonington in 2022: $7,649,459
Median family income in North Stonington in 2022:| North Stonington: | $40,613 |
| State: | $57,217 |
Number of families with income $20k - 30k:| North Stonington: | 7.6% (11) |
| State: | 10.7% (215) |
Number of families with income $150k - 200k:| North Stonington: | 14.0% (20) |
| State: | 10.3% (207) |
Number of families with income > $200k:| North Stonington: | 78.4% (110) |
| State: | 11.3% (228) |
Median non-family income in North Stonington in 2022:| North Stonington: | $66,118 |
| State: | $40,310 |
Change in median non-family income between 2000 and 2022:| North Stonington, Connecticut: | +125.1% |
| Connecticut: | +125.1% |
Median per capita income in North Stonington in 2022:| North Stonington: | $47,023 |
| Connecticut: | $25,355 |
Change in median per capita income between 2000 and 2022:| North Stonington, Connecticut: | +45.9% |
| State: | +39.4% |
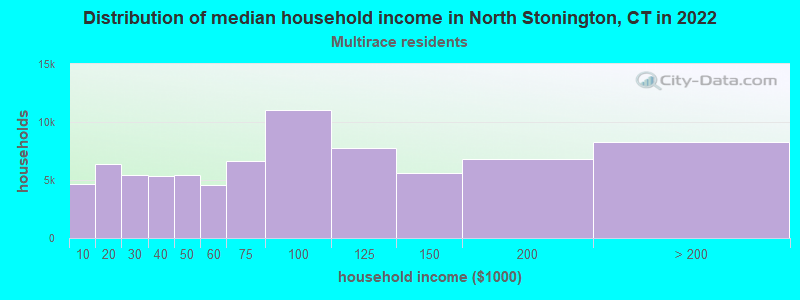
Income statistics for Multirace residents
Median household income in North Stonington, CT in 2022:| North Stonington: | $49,717 |
| Connecticut: | $77,277 |
Change in median household income between 2000 and 2022:| North Stonington, Connecticut: | +119.4% |
| Connecticut: | +113.6% |
Number of households with income < $10k:| North Stonington: | 6.0% (4,669) |
| State: | 6.0% (7,457) |
Number of households with income $10k - 20k:| North Stonington: | 8.1% (6,348) |
| Connecticut: | 8.1% (10,139) |
Number of households with income $20k - 30k:| North Stonington: | 7.0% (5,448) |
| State: | 7.0% (8,702) |
Number of households with income $30k - 40k:| North Stonington: | 6.9% (5,350) |
| State: | 6.9% (8,546) |
Number of households with income $40k - 50k:| North Stonington: | 7.0% (5,455) |
| Connecticut: | 7.0% (8,712) |
Number of households with income $50k - 60k:| North Stonington: | 5.9% (4,590) |
| State: | 5.9% (7,331) |
Number of households with income $60k - 75k:| North Stonington: | 8.5% (6,658) |
| State: | 8.5% (10,634) |
Number of households with income $75k - 100k:| North Stonington: | 14.1% (11,019) |
| Connecticut: | 14.1% (17,600) |
Number of households with income $100k - 125k:| North Stonington: | 9.9% (7,753) |
| Connecticut: | 9.9% (12,383) |
Number of households with income $125k - 150k:| North Stonington: | 7.2% (5,585) |
| State: | 7.2% (8,921) |
Number of households with income $150k - 200k:| North Stonington: | 8.8% (6,838) |
| Connecticut: | 8.8% (10,922) |
Number of households with income > $200k:| North Stonington: | 10.6% (8,294) |
| State: | 10.6% (13,247) |
Aggregate household income in North Stonington in 2022: $3,100,704
Median family income in North Stonington in 2022:| North Stonington: | $8,064 |
| State: | $84,255 |
Number of families with income < $10k:| North Stonington: | 100.0% (13) |
| Connecticut: | 3.6% (3,027) |
Median non-family income in North Stonington in 2022:| North Stonington: | $42,993 |
| Connecticut: | $44,462 |
Change in median non-family income between 2000 and 2022:| North Stonington, Connecticut: | +81.0% |
| State: | +97.6% |
Median per capita income in North Stonington in 2022:| North Stonington: | $49,559 |
| State: | $32,794 |
Change in median per capita income between 2000 and 2022:| North Stonington, Connecticut: | +95.5% |
| State: | +117.2% |