North Treasure, Montana (MT) income map, earnings map, and wages data
The median household income in North Treasure, MT in 2022 was $53,663, which was 26.0% less than the median annual income of $67,631 across the entire state of Montana. Compared to the median income of $26,250 in 2000 this represents an increase of 51.1%. The per capita income in 2022 was $22,179, which means an increase of 55.3% compared to 2000 when it was $9,923.
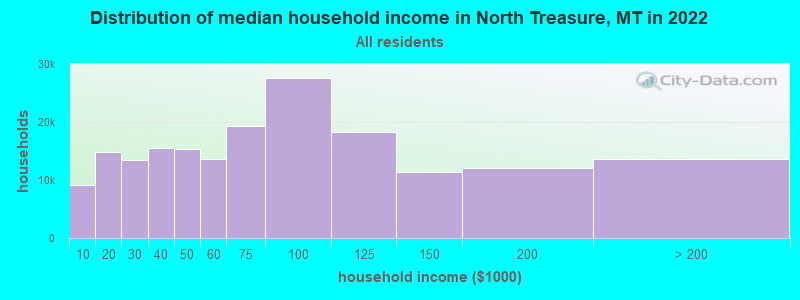
Income statistics for all residents
Median household income in North Treasure, MT in 2022:| North Treasure: | $53,663 |
| State: | $67,631 |
Change in median household income between 2000 and 2022:| North Treasure, Montana: | +104.4% |
| Montana: | +104.8% |
Number of households with income < $10k:| North Treasure: | 5.0% (9,215) |
| State: | 5.0% (23,231) |
Number of households with income $10k - 20k:| North Treasure: | 8.1% (14,908) |
| Montana: | 8.1% (37,478) |
Number of households with income $20k - 30k:| North Treasure: | 7.3% (13,525) |
| State: | 7.3% (33,880) |
Number of households with income $30k - 40k:| North Treasure: | 8.4% (15,434) |
| State: | 8.4% (38,912) |
Number of households with income $40k - 50k:| North Treasure: | 8.3% (15,298) |
| State: | 8.3% (38,441) |
Number of households with income $50k - 60k:| North Treasure: | 7.4% (13,550) |
| State: | 7.4% (34,172) |
Number of households with income $60k - 75k:| North Treasure: | 10.5% (19,376) |
| Montana: | 10.5% (48,783) |
Number of households with income $75k - 100k:| North Treasure: | 15.0% (27,658) |
| State: | 15.0% (69,571) |
Number of households with income $100k - 125k:| North Treasure: | 9.9% (18,242) |
| State: | 9.9% (45,889) |
Number of households with income $125k - 150k:| North Treasure: | 6.1% (11,303) |
| Montana: | 6.1% (28,538) |
Number of households with income $150k - 200k:| North Treasure: | 6.5% (12,045) |
| Montana: | 6.6% (30,552) |
Number of households with income > $200k:| North Treasure: | 7.4% (13,701) |
| Montana: | 7.5% (34,625) |
Aggregate household income in North Treasure in 2022: $31,545,486
Median family income in North Treasure in 2022:| North Treasure: | $62,090 |
| State: | $83,580 |
Median non-family income in North Treasure in 2022:| North Treasure: | $31,867 |
| State: | $40,582 |
Change in median non-family income between 2000 and 2022:| North Treasure, Montana: | +103.9% |
| Montana: | +108.3% |
Median per capita income in North Treasure in 2022:| North Treasure: | $22,180 |
| State: | $38,329 |
Change in median per capita income between 2000 and 2022:| North Treasure, Montana: | +123.5% |
| Montana: | +123.5% |
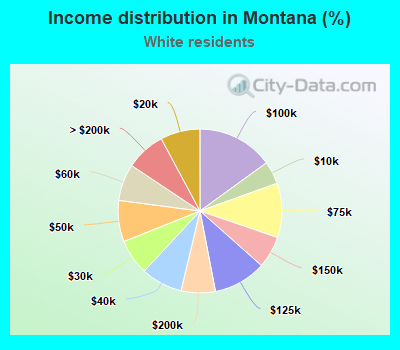
Income statistics for White residents
Median household income in North Treasure, MT in 2022:| North Treasure: | $57,519 |
| State: | $69,744 |
Change in median household income between 2000 and 2022:| North Treasure, Montana: | +106.8% |
| Montana: | +106.5% |
Number of households with income < $10k:| North Treasure: | 4.5% (7,609) |
| State: | 4.5% (18,406) |
Number of households with income $10k - 20k:| North Treasure: | 7.8% (13,248) |
| State: | 7.8% (32,061) |
Number of households with income $20k - 30k:| North Treasure: | 7.1% (11,953) |
| State: | 7.0% (28,825) |
Number of households with income $30k - 40k:| North Treasure: | 8.2% (13,817) |
| State: | 8.2% (33,552) |
Number of households with income $40k - 50k:| North Treasure: | 8.2% (13,832) |
| State: | 8.2% (33,446) |
Number of households with income $50k - 60k:| North Treasure: | 7.2% (12,252) |
| State: | 7.3% (29,753) |
Number of households with income $60k - 75k:| North Treasure: | 10.8% (18,184) |
| State: | 10.7% (44,051) |
Number of households with income $75k - 100k:| North Treasure: | 15.0% (25,403) |
| Montana: | 15.0% (61,580) |
Number of households with income $100k - 125k:| North Treasure: | 10.4% (17,596) |
| State: | 10.4% (42,636) |
Number of households with income $125k - 150k:| North Treasure: | 6.3% (10,675) |
| State: | 6.3% (25,938) |
Number of households with income $150k - 200k:| North Treasure: | 6.7% (11,355) |
| State: | 6.8% (27,704) |
Number of households with income > $200k:| North Treasure: | 7.8% (13,181) |
| State: | 7.8% (32,101) |
Aggregate household income in North Treasure in 2022: $28,131,118
Median family income in North Treasure in 2022:| North Treasure: | $63,270 |
| State: | $86,163 |
Number of families with income < $10k:| North Treasure: | 2.6% (1) |
| State: | 2.0% (4,963) |
Number of families with income $10k - 20k:| North Treasure: | 15.3% (7) |
| State: | 2.8% (7,063) |
Number of families with income $20k - 30k:| North Treasure: | 10.7% (5) |
| State: | 4.5% (11,218) |
Number of families with income $30k - 40k:| North Treasure: | 24.4% (12) |
| State: | 6.0% (14,834) |
Number of families with income $40k - 50k:| North Treasure: | 6.9% (3) |
| State: | 6.8% (16,997) |
Number of families with income $50k - 60k:| North Treasure: | 7.6% (4) |
| State: | 7.3% (18,007) |
Number of families with income $60k - 75k:| North Treasure: | 4.7% (2) |
| State: | 11.6% (28,681) |
Number of families with income $100k - 125k:| North Treasure: | 27.7% (13) |
| Montana: | 13.5% (33,620) |
Median non-family income in North Treasure in 2022:| North Treasure: | $32,162 |
| Montana: | $41,403 |
Change in median non-family income between 2000 and 2022:| North Treasure, Montana: | +105.8% |
| State: | +109.4% |
Median per capita income in North Treasure in 2022:| North Treasure: | $22,403 |
| Montana: | $40,453 |
Change in median per capita income between 2000 and 2022:| North Treasure, Montana: | +125.9% |
| State: | +125.6% |
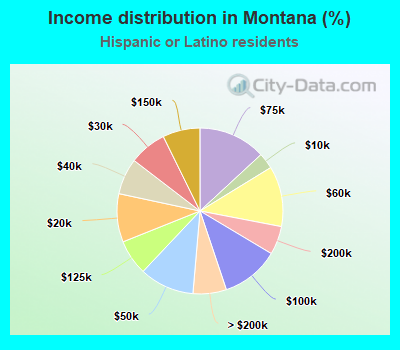
Income statistics for Hispanic or Latino residents
Median household income in North Treasure, MT in 2022:| North Treasure: | $39,163 |
| Montana: | $60,797 |
Change in median household income between 2000 and 2022:| North Treasure, Montana: | +108.9% |
| State: | +117.3% |
Number of households with income < $10k:| North Treasure: | 3.1% (155) |
| State: | 3.1% (455) |
Number of households with income $10k - 20k:| North Treasure: | 9.5% (474) |
| State: | 9.4% (1,375) |
Number of households with income $20k - 30k:| North Treasure: | 7.1% (355) |
| State: | 7.3% (1,066) |
Number of households with income $30k - 40k:| North Treasure: | 7.3% (362) |
| State: | 7.1% (1,032) |
Number of households with income $40k - 50k:| North Treasure: | 10.6% (527) |
| State: | 10.7% (1,557) |
Number of households with income $50k - 60k:| North Treasure: | 11.4% (568) |
| State: | 11.8% (1,722) |
Number of households with income $60k - 75k:| North Treasure: | 12.3% (616) |
| Montana: | 13.1% (1,918) |
Number of households with income $75k - 100k:| North Treasure: | 12.2% (607) |
| State: | 11.3% (1,648) |
Number of households with income $100k - 125k:| North Treasure: | 6.2% (309) |
| State: | 6.9% (1,011) |
Number of households with income $125k - 150k:| North Treasure: | 8.0% (398) |
| State: | 7.3% (1,064) |
Number of households with income $150k - 200k:| North Treasure: | 5.4% (268) |
| State: | 5.6% (812) |
Number of households with income > $200k:| North Treasure: | 7.0% (349) |
| State: | 6.5% (951) |
Aggregate household income in North Treasure in 2022: $251,221
Median family income in North Treasure in 2022:| North Treasure: | $36,582 |
| State: | $66,328 |
Median per capita income in North Treasure in 2022:| North Treasure: | $7,806 |
| Montana: | $23,068 |
Change in median per capita income between 2000 and 2022:| North Treasure, Montana: | +112.9% |
| Montana: | +122.4% |
Income statistics for other residents
Number of households with income < $10k:| North Treasure: | 6.2% (8) |
| State: | 4.0% (142) |
Number of households with income $10k - 20k:| North Treasure: | 7.0% (9) |
| State: | 8.0% (282) |
Number of households with income $20k - 30k:| North Treasure: | 7.8% (10) |
| State: | 7.4% (260) |
Number of households with income $30k - 40k:| North Treasure: | 9.4% (12) |
| State: | 12.9% (455) |
Number of households with income $40k - 50k:| North Treasure: | 8.6% (11) |
| State: | 7.1% (251) |
Number of households with income $50k - 60k:| North Treasure: | 7.8% (10) |
| Montana: | 7.4% (262) |
Number of households with income $60k - 75k:| North Treasure: | 10.9% (14) |
| State: | 7.8% (277) |
Number of households with income $75k - 100k:| North Treasure: | 14.1% (18) |
| State: | 10.6% (376) |
Number of households with income $100k - 125k:| North Treasure: | 9.4% (12) |
| State: | 10.3% (365) |
Number of households with income $125k - 150k:| North Treasure: | 6.2% (8) |
| State: | 12.1% (426) |
Number of households with income $150k - 200k:| North Treasure: | 7.0% (9) |
| State: | 4.5% (159) |
Number of households with income > $200k:| North Treasure: | 5.5% (7) |
| Montana: | 7.8% (277) |
Aggregate household income in North Treasure in 2022: $232,787
Median family income in North Treasure in 2022:| North Treasure: | $49,345 |
| Montana: | $89,236 |
Median per capita income in North Treasure in 2022:| North Treasure: | $22,820 |
| Montana: | $23,968 |
Change in median per capita income between 2000 and 2022:| North Treasure, Montana: | +107.5% |
| Montana: | +114.9% |