Northeast Brazos, Texas (TX) income map, earnings map, and wages data
The median household income in Northeast Brazos, TX in 2022 was $104,650, which was 30.9% greater than the median annual income of $72,284 across the entire state of Texas. Compared to the median income of $50,432 in 2000 this represents an increase of 51.8%. The per capita income in 2022 was $41,885, which means an increase of 49.1% compared to 2000 when it was $21,300.
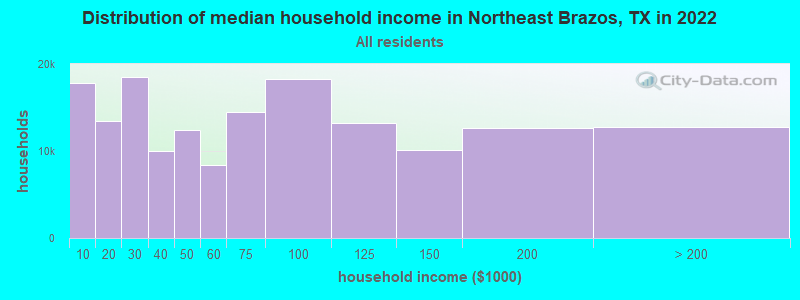
Income statistics for all residents
Median household income in Northeast Brazos, TX in 2022:| Northeast Brazos: | $104,650 |
| State: | $72,284 |
Change in median household income between 2000 and 2022:| Northeast Brazos, Texas: | +107.5% |
| Texas: | +81.0% |
Number of households with income < $10k:| Northeast Brazos: | 11.0% (17,841) |
| State: | 5.5% (611,011) |
Number of households with income $10k - 20k:| Northeast Brazos: | 8.3% (13,442) |
| State: | 6.7% (743,157) |
Number of households with income $20k - 30k:| Northeast Brazos: | 11.4% (18,541) |
| State: | 7.2% (803,381) |
Number of households with income $30k - 40k:| Northeast Brazos: | 6.2% (10,012) |
| Texas: | 7.8% (866,080) |
Number of households with income $40k - 50k:| Northeast Brazos: | 7.6% (12,366) |
| State: | 7.3% (810,440) |
Number of households with income $50k - 60k:| Northeast Brazos: | 5.2% (8,364) |
| State: | 7.2% (799,783) |
Number of households with income $60k - 75k:| Northeast Brazos: | 8.9% (14,509) |
| State: | 9.9% (1,095,384) |
Number of households with income $75k - 100k:| Northeast Brazos: | 11.3% (18,295) |
| State: | 12.8% (1,419,057) |
Number of households with income $100k - 125k:| Northeast Brazos: | 8.1% (13,194) |
| State: | 9.5% (1,054,577) |
Number of households with income $125k - 150k:| Northeast Brazos: | 6.3% (10,149) |
| State: | 6.7% (741,518) |
Number of households with income $150k - 200k:| Northeast Brazos: | 7.8% (12,658) |
| State: | 8.7% (961,776) |
Number of households with income > $200k:| Northeast Brazos: | 7.9% (12,786) |
| State: | 10.7% (1,181,544) |
Aggregate household income in Northeast Brazos in 2022: $880,862,509
Median family income in Northeast Brazos in 2022:| Northeast Brazos: | $108,677 |
| Texas: | $86,267 |
Median non-family income in Northeast Brazos in 2022:| Northeast Brazos: | $52,309 |
| Texas: | $45,999 |
Change in median non-family income between 2000 and 2022:| Northeast Brazos, Texas: | +107.3% |
| State: | +79.5% |
Median per capita income in Northeast Brazos in 2022:| Northeast Brazos: | $41,885 |
| Texas: | $38,123 |
Change in median per capita income between 2000 and 2022:| Northeast Brazos, Texas: | +96.6% |
| State: | +94.3% |
Income statistics for White residents
Median household income in Northeast Brazos, TX in 2022:| Northeast Brazos: | $108,232 |
| State: | $82,032 |
Change in median household income between 2000 and 2022:| Northeast Brazos, Texas: | +110.5% |
| State: | +91.0% |
Number of households with income < $10k:| Northeast Brazos: | 10.5% (10,645) |
| State: | 4.7% (273,716) |
Number of households with income $10k - 20k:| Northeast Brazos: | 8.0% (8,121) |
| Texas: | 5.5% (322,702) |
Number of households with income $20k - 30k:| Northeast Brazos: | 9.1% (9,277) |
| State: | 6.2% (363,947) |
Number of households with income $30k - 40k:| Northeast Brazos: | 5.9% (5,986) |
| State: | 6.8% (399,275) |
Number of households with income $40k - 50k:| Northeast Brazos: | 6.9% (6,987) |
| State: | 6.5% (383,417) |
Number of households with income $50k - 60k:| Northeast Brazos: | 5.5% (5,605) |
| State: | 6.6% (388,535) |
Number of households with income $60k - 75k:| Northeast Brazos: | 8.8% (8,914) |
| Texas: | 9.7% (566,295) |
Number of households with income $75k - 100k:| Northeast Brazos: | 11.6% (11,745) |
| State: | 13.0% (760,276) |
Number of households with income $100k - 125k:| Northeast Brazos: | 8.8% (8,922) |
| State: | 10.2% (597,596) |
Number of households with income $125k - 150k:| Northeast Brazos: | 6.7% (6,808) |
| Texas: | 7.4% (436,830) |
Number of households with income $150k - 200k:| Northeast Brazos: | 8.5% (8,652) |
| State: | 9.9% (583,067) |
Number of households with income > $200k:| Northeast Brazos: | 9.6% (9,771) |
| Texas: | 13.5% (792,647) |
Aggregate household income in Northeast Brazos in 2022: $637,116,247
Median family income in Northeast Brazos in 2022:| Northeast Brazos: | $118,793 |
| State: | $101,788 |
Number of families with income < $10k:| Northeast Brazos: | 1.4% (46) |
| State: | 2.8% (108,142) |
Number of families with income $10k - 20k:| Northeast Brazos: | 3.2% (103) |
| Texas: | 2.9% (113,421) |
Number of families with income $20k - 30k:| Northeast Brazos: | 4.0% (131) |
| State: | 4.1% (157,688) |
Number of families with income $30k - 40k:| Northeast Brazos: | 2.3% (76) |
| Texas: | 5.2% (198,847) |
Number of families with income $40k - 50k:| Northeast Brazos: | 7.5% (245) |
| State: | 5.6% (216,490) |
Number of families with income $50k - 60k:| Northeast Brazos: | 9.1% (296) |
| State: | 5.7% (220,689) |
Number of families with income $60k - 75k:| Northeast Brazos: | 16.0% (520) |
| State: | 9.0% (346,106) |
Number of families with income $75k - 100k:| Northeast Brazos: | 14.6% (475) |
| State: | 13.7% (527,363) |
Number of families with income $100k - 125k:| Northeast Brazos: | 17.3% (564) |
| State: | 11.6% (448,411) |
Number of families with income $125k - 150k:| Northeast Brazos: | 6.3% (205) |
| State: | 9.2% (355,798) |
Number of families with income $150k - 200k:| Northeast Brazos: | 4.9% (159) |
| Texas: | 12.5% (480,185) |
Number of families with income > $200k:| Northeast Brazos: | 13.3% (434) |
| Texas: | 17.6% (677,490) |
Median non-family income in Northeast Brazos in 2022:| Northeast Brazos: | $59,757 |
| State: | $50,587 |
Change in median non-family income between 2000 and 2022:| Northeast Brazos, Texas: | +131.7% |
| State: | +87.7% |
Median per capita income in Northeast Brazos in 2022:| Northeast Brazos: | $44,993 |
| Texas: | $47,740 |
Change in median per capita income between 2000 and 2022:| Northeast Brazos, Texas: | +99.6% |
| Texas: | +114.3% |
Income statistics for Black or African American residents
Median household income in Northeast Brazos, TX in 2022:| Northeast Brazos: | $72,756 |
| Texas: | $55,759 |
Change in median household income between 2000 and 2022:| Northeast Brazos, Texas: | +104.4% |
| State: | +90.3% |
Number of households with income < $10k:| Northeast Brazos: | 19.4% (3,113) |
| Texas: | 8.9% (126,378) |
Number of households with income $10k - 20k:| Northeast Brazos: | 14.1% (2,265) |
| Texas: | 9.9% (140,369) |
Number of households with income $20k - 30k:| Northeast Brazos: | 9.6% (1,548) |
| State: | 8.5% (120,639) |
Number of households with income $30k - 40k:| Northeast Brazos: | 5.3% (844) |
| State: | 9.7% (137,517) |
Number of households with income $40k - 50k:| Northeast Brazos: | 14.2% (2,275) |
| State: | 8.0% (112,973) |
Number of households with income $50k - 60k:| Northeast Brazos: | 3.6% (571) |
| Texas: | 8.3% (117,156) |
Number of households with income $60k - 75k:| Northeast Brazos: | 12.2% (1,965) |
| State: | 10.4% (147,462) |
Number of households with income $75k - 100k:| Northeast Brazos: | 8.2% (1,319) |
| State: | 11.5% (162,718) |
Number of households with income $100k - 125k:| Northeast Brazos: | 7.2% (1,153) |
| State: | 8.2% (115,829) |
Number of households with income $125k - 150k:| Northeast Brazos: | 4.2% (681) |
| State: | 4.9% (69,556) |
Number of households with income $150k - 200k:| Northeast Brazos: | 2.1% (338) |
| State: | 6.4% (90,701) |
Number of households with income > $200k:| Northeast Brazos: | 0.0% (0) |
| State: | 5.5% (77,988) |
Aggregate household income in Northeast Brazos in 2022: $31,980,743
Median family income in Northeast Brazos in 2022:| Northeast Brazos: | $79,596 |
| State: | $69,134 |
Number of families with income < $10k:| Northeast Brazos: | 9.6% (35) |
| State: | 6.8% (55,625) |
Number of families with income $20k - 30k:| Northeast Brazos: | 6.4% (23) |
| Texas: | 7.1% (57,877) |
Number of families with income $30k - 40k:| Northeast Brazos: | 3.0% (11) |
| Texas: | 8.5% (68,776) |
Number of families with income $40k - 50k:| Northeast Brazos: | 8.4% (30) |
| Texas: | 7.1% (57,907) |
Number of families with income $50k - 60k:| Northeast Brazos: | 4.3% (16) |
| Texas: | 7.3% (59,511) |
Number of families with income $60k - 75k:| Northeast Brazos: | 13.6% (49) |
| State: | 10.1% (81,994) |
Number of families with income $75k - 100k:| Northeast Brazos: | 16.8% (61) |
| State: | 12.7% (103,723) |
Number of families with income $125k - 150k:| Northeast Brazos: | 37.9% (137) |
| State: | 6.8% (55,615) |
Median non-family income in Northeast Brazos in 2022:| Northeast Brazos: | $76,223 |
| State: | $40,133 |
Change in median non-family income between 2000 and 2022:| Northeast Brazos, Texas: | +114.4% |
| Texas: | +102.2% |
Median per capita income in Northeast Brazos in 2022:| Northeast Brazos: | $25,546 |
| State: | $30,490 |
Change in median per capita income between 2000 and 2022:| Northeast Brazos, Texas: | +87.5% |
| Texas: | +113.9% |
Income statistics for Hispanic or Latino residents
Median household income in Northeast Brazos, TX in 2022:| Northeast Brazos: | $136,652 |
| Texas: | $60,504 |
Change in median household income between 2000 and 2022:| Northeast Brazos, Texas: | +141.6% |
| State: | +102.5% |
Number of households with income < $10k:| Northeast Brazos: | 8.9% (4,085) |
| Texas: | 5.8% (213,953) |
Number of households with income $10k - 20k:| Northeast Brazos: | 5.6% (2,578) |
| State: | 8.0% (297,456) |
Number of households with income $20k - 30k:| Northeast Brazos: | 11.8% (5,442) |
| State: | 9.2% (340,166) |
Number of households with income $30k - 40k:| Northeast Brazos: | 8.3% (3,822) |
| Texas: | 9.5% (354,336) |
Number of households with income $40k - 50k:| Northeast Brazos: | 7.6% (3,505) |
| State: | 8.8% (327,013) |
Number of households with income $50k - 60k:| Northeast Brazos: | 6.4% (2,931) |
| State: | 8.3% (308,818) |
Number of households with income $60k - 75k:| Northeast Brazos: | 9.5% (4,378) |
| Texas: | 10.9% (405,109) |
Number of households with income $75k - 100k:| Northeast Brazos: | 14.2% (6,503) |
| State: | 13.8% (511,639) |
Number of households with income $100k - 125k:| Northeast Brazos: | 5.7% (2,607) |
| Texas: | 8.6% (319,728) |
Number of households with income $125k - 150k:| Northeast Brazos: | 8.2% (3,787) |
| State: | 5.7% (210,932) |
Number of households with income $150k - 200k:| Northeast Brazos: | 10.7% (4,896) |
| State: | 6.4% (236,055) |
Number of households with income > $200k:| Northeast Brazos: | 3.1% (1,407) |
| State: | 5.1% (189,259) |
Aggregate household income in Northeast Brazos in 2022: $94,408,185
Median family income in Northeast Brazos in 2022:| Northeast Brazos: | $159,629 |
| State: | $65,080 |
Number of families with income < $10k:| Northeast Brazos: | 1.3% (18) |
| State: | 5.3% (147,493) |
Number of families with income $10k - 20k:| Northeast Brazos: | 3.5% (47) |
| State: | 6.3% (174,531) |
Number of families with income $20k - 30k:| Northeast Brazos: | 11.2% (154) |
| State: | 8.6% (238,528) |
Number of families with income $30k - 40k:| Northeast Brazos: | 5.2% (71) |
| Texas: | 9.1% (251,999) |
Number of families with income $40k - 50k:| Northeast Brazos: | 9.8% (133) |
| Texas: | 8.6% (240,188) |
Number of families with income $50k - 60k:| Northeast Brazos: | 6.2% (85) |
| Texas: | 8.0% (223,566) |
Number of families with income $60k - 75k:| Northeast Brazos: | 18.7% (256) |
| Texas: | 10.9% (302,688) |
Number of families with income $75k - 100k:| Northeast Brazos: | 17.6% (241) |
| Texas: | 14.3% (398,554) |
Number of families with income $100k - 125k:| Northeast Brazos: | 10.7% (146) |
| State: | 9.5% (264,007) |
Number of families with income $125k - 150k:| Northeast Brazos: | 8.4% (115) |
| Texas: | 6.2% (171,274) |
Number of families with income $150k - 200k:| Northeast Brazos: | 2.8% (38) |
| Texas: | 7.3% (202,259) |
Number of families with income > $200k:| Northeast Brazos: | 4.6% (63) |
| State: | 5.9% (165,129) |
Median non-family income in Northeast Brazos in 2022:| Northeast Brazos: | $28,079 |
| Texas: | $39,934 |
Change in median non-family income between 2000 and 2022:| Northeast Brazos, Texas: | +149.6% |
| State: | +109.1% |
Median per capita income in Northeast Brazos in 2022:| Northeast Brazos: | $33,077 |
| State: | $24,862 |
Change in median per capita income between 2000 and 2022:| Northeast Brazos, Texas: | +125.7% |
| State: | +130.8% |
Income statistics for Multirace residents
Median household income in Northeast Brazos, TX in 2022:| Northeast Brazos: | $108,066 |
| State: | $62,748 |
Change in median household income between 2000 and 2022:| Northeast Brazos, Texas: | +128.8% |
| State: | +92.3% |
Number of households with income < $10k:| Northeast Brazos: | 8.9% (2,786) |
| Texas: | 5.5% (122,324) |
Number of households with income $10k - 20k:| Northeast Brazos: | 8.0% (2,528) |
| Texas: | 8.2% (182,232) |
Number of households with income $20k - 30k:| Northeast Brazos: | 17.2% (5,393) |
| Texas: | 8.5% (189,456) |
Number of households with income $30k - 40k:| Northeast Brazos: | 6.6% (2,066) |
| Texas: | 8.9% (197,499) |
Number of households with income $40k - 50k:| Northeast Brazos: | 10.9% (3,434) |
| State: | 8.7% (191,735) |
Number of households with income $50k - 60k:| Northeast Brazos: | 3.5% (1,106) |
| Texas: | 8.0% (177,535) |
Number of households with income $60k - 75k:| Northeast Brazos: | 10.7% (3,373) |
| State: | 10.5% (232,479) |
Number of households with income $75k - 100k:| Northeast Brazos: | 11.9% (3,730) |
| State: | 13.1% (290,448) |
Number of households with income $100k - 125k:| Northeast Brazos: | 4.2% (1,320) |
| State: | 8.6% (191,595) |
Number of households with income $125k - 150k:| Northeast Brazos: | 3.5% (1,090) |
| State: | 6.0% (133,361) |
Number of households with income $150k - 200k:| Northeast Brazos: | 8.0% (2,523) |
| State: | 7.2% (159,195) |
Number of households with income > $200k:| Northeast Brazos: | 6.6% (2,068) |
| State: | 6.7% (148,064) |
Aggregate household income in Northeast Brazos in 2022: $58,508,098
Median family income in Northeast Brazos in 2022:| Northeast Brazos: | $155,901 |
| State: | $69,780 |
Number of families with income $40k - 50k:| Northeast Brazos: | 16.2% (29) |
| Texas: | 8.4% (135,809) |
Number of families with income $50k - 60k:| Northeast Brazos: | 83.8% (151) |
| State: | 7.9% (127,739) |
Median non-family income in Northeast Brazos in 2022:| Northeast Brazos: | $6,759 |
| Texas: | $40,634 |
Change in median non-family income between 2000 and 2022:| Northeast Brazos, Texas: | +80.2% |
| State: | +77.2% |
Median per capita income in Northeast Brazos in 2022:| Northeast Brazos: | $37,948 |
| Texas: | $26,785 |
Income statistics for other residents
Number of households with income < $10k:| Northeast Brazos: | 6.0% (44) |
| State: | 5.9% (54,162) |
Number of households with income $10k - 20k:| Northeast Brazos: | 6.8% (50) |
| State: | 6.8% (62,891) |
Number of households with income $20k - 30k:| Northeast Brazos: | 10.6% (78) |
| Texas: | 10.6% (97,294) |
Number of households with income $30k - 40k:| Northeast Brazos: | 10.8% (80) |
| Texas: | 10.8% (99,670) |
Number of households with income $40k - 50k:| Northeast Brazos: | 9.3% (69) |
| State: | 9.3% (85,548) |
Number of households with income $50k - 60k:| Northeast Brazos: | 9.1% (67) |
| State: | 9.0% (82,757) |
Number of households with income $60k - 75k:| Northeast Brazos: | 11.0% (81) |
| Texas: | 10.9% (100,326) |
Number of households with income $75k - 100k:| Northeast Brazos: | 14.1% (104) |
| State: | 14.0% (128,767) |
Number of households with income $100k - 125k:| Northeast Brazos: | 8.1% (60) |
| State: | 8.2% (75,218) |
Number of households with income $125k - 150k:| Northeast Brazos: | 4.9% (36) |
| State: | 4.8% (44,223) |
Number of households with income $150k - 200k:| Northeast Brazos: | 5.5% (41) |
| Texas: | 5.6% (51,376) |
Number of households with income > $200k:| Northeast Brazos: | 3.9% (29) |
| State: | 4.0% (36,393) |
Aggregate household income in Northeast Brazos in 2022: $10,625,847
Median family income in Northeast Brazos in 2022:| Northeast Brazos: | $95,453 |
| Texas: | $60,064 |
Number of families with income < $10k:| Northeast Brazos: | 8.7% (10) |
| State: | 6.8% (47,502) |
Number of families with income $20k - 30k:| Northeast Brazos: | 10.3% (12) |
| State: | 9.9% (68,761) |
Number of families with income $30k - 40k:| Northeast Brazos: | 8.1% (9) |
| State: | 9.7% (67,685) |
Number of families with income $60k - 75k:| Northeast Brazos: | 29.3% (34) |
| Texas: | 11.2% (77,588) |
Number of families with income $75k - 100k:| Northeast Brazos: | 43.5% (51) |
| State: | 14.5% (101,032) |
Median non-family income in Northeast Brazos in 2022:| Northeast Brazos: | $42,859 |
| State: | $38,690 |
Median per capita income in Northeast Brazos in 2022:| Northeast Brazos: | $27,171 |
| Texas: | $23,899 |