Northeast Tarrant, Texas (TX) income map, earnings map, and wages data
The median household income in Northeast Tarrant, TX in 2022 was $97,076, which was 25.5% greater than the median annual income of $72,284 across the entire state of Texas. Compared to the median income of $58,823 in 2000 this represents an increase of 39.4%. The per capita income in 2022 was $48,051, which means an increase of 42.4% compared to 2000 when it was $27,655.
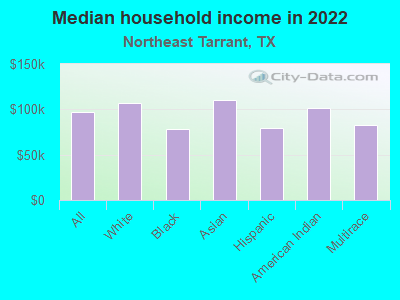
Income statistics for all residents
Median household income in Northeast Tarrant, TX in 2022:| Northeast Tarrant: | $97,077 |
| State: | $72,284 |
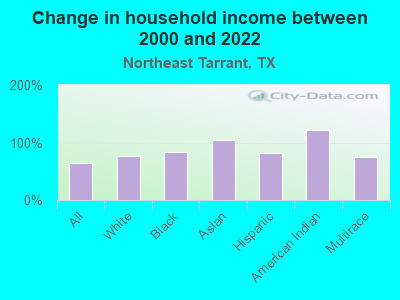
Change in median household income between 2000 and 2022:| Northeast Tarrant, Texas: | +65.0% |
| Texas: | +81.0% |
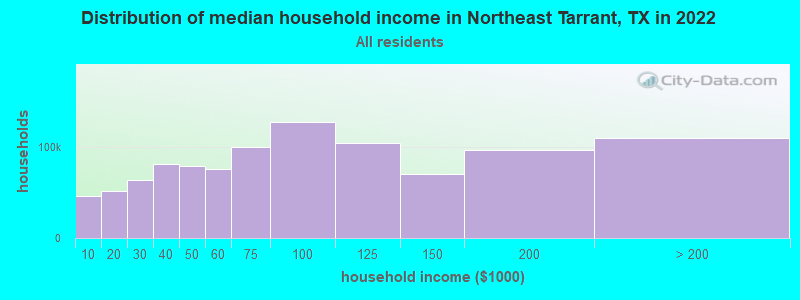
Number of households with income < $10k:| Northeast Tarrant: | 4.6% (46,302) |
| Texas: | 5.5% (611,011) |
Number of households with income $10k - 20k:| Northeast Tarrant: | 5.1% (51,262) |
| State: | 6.7% (743,157) |
Number of households with income $20k - 30k:| Northeast Tarrant: | 6.3% (63,056) |
| State: | 7.2% (803,381) |
Number of households with income $30k - 40k:| Northeast Tarrant: | 8.1% (81,165) |
| State: | 7.8% (866,080) |
Number of households with income $40k - 50k:| Northeast Tarrant: | 7.8% (78,552) |
| State: | 7.3% (810,440) |
Number of households with income $50k - 60k:| Northeast Tarrant: | 7.5% (75,269) |
| Texas: | 7.2% (799,783) |
Number of households with income $60k - 75k:| Northeast Tarrant: | 10.0% (99,902) |
| State: | 9.9% (1,095,384) |
Number of households with income $75k - 100k:| Northeast Tarrant: | 12.7% (127,142) |
| State: | 12.8% (1,419,057) |
Number of households with income $100k - 125k:| Northeast Tarrant: | 10.4% (103,821) |
| Texas: | 9.5% (1,054,577) |
Number of households with income $125k - 150k:| Northeast Tarrant: | 7.0% (69,910) |
| State: | 6.7% (741,518) |
Number of households with income $150k - 200k:| Northeast Tarrant: | 9.7% (96,812) |
| Texas: | 8.7% (961,776) |
Number of households with income > $200k:| Northeast Tarrant: | 10.9% (109,398) |
| State: | 10.7% (1,181,544) |
Aggregate household income in Northeast Tarrant in 2022: $82,672,530,100
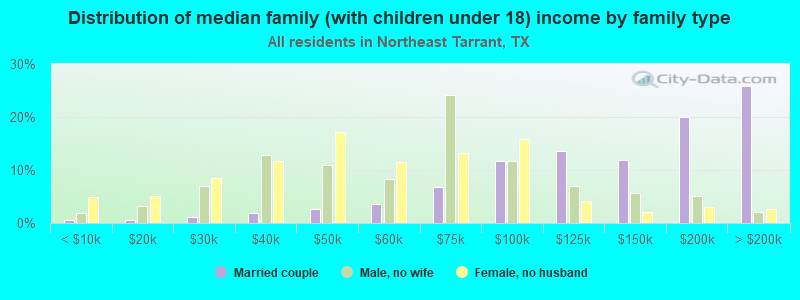
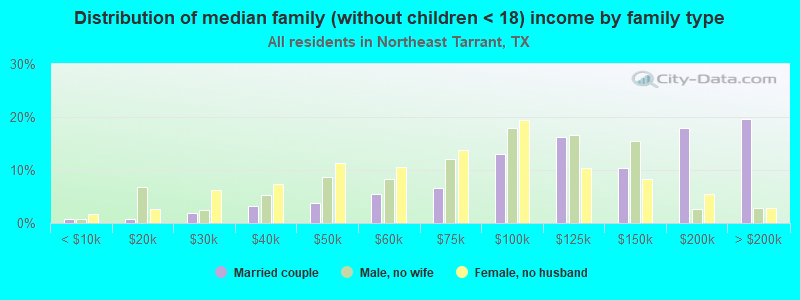
Median family income in Northeast Tarrant in 2022:| Northeast Tarrant: | $120,253 |
| Texas: | $86,267 |
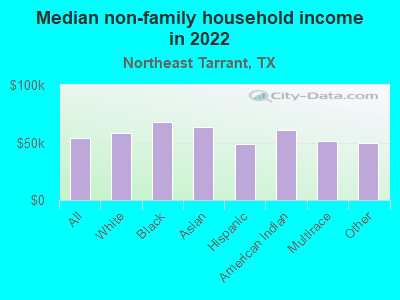
Median non-family income in Northeast Tarrant in 2022:| Northeast Tarrant: | $54,234 |
| State: | $45,999 |
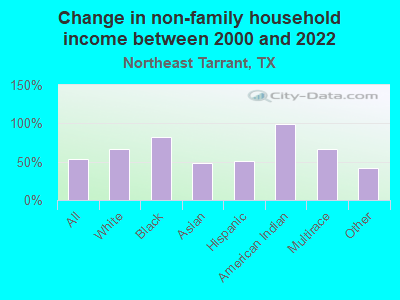
Change in median non-family income between 2000 and 2022:| Northeast Tarrant, Texas: | +53.5% |
| Texas: | +79.5% |
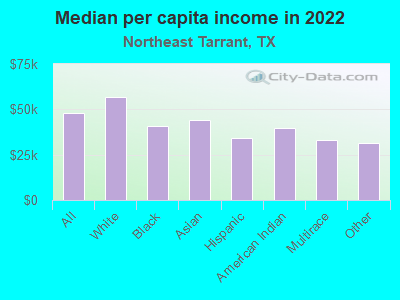
Median per capita income in Northeast Tarrant in 2022:| Northeast Tarrant: | $48,052 |
| State: | $38,123 |
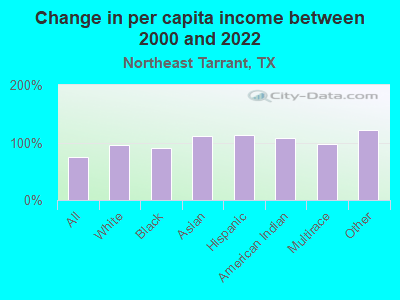
Change in median per capita income between 2000 and 2022:| Northeast Tarrant, Texas: | +73.8% |
| State: | +94.3% |
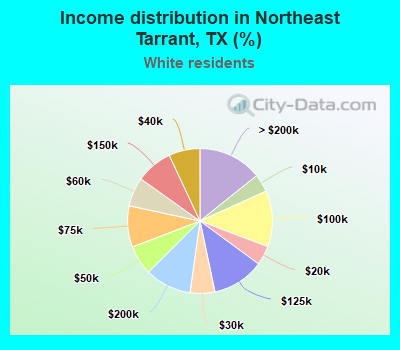
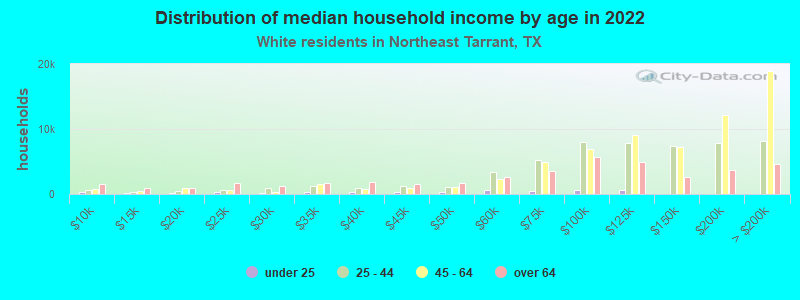
Income statistics for White residents
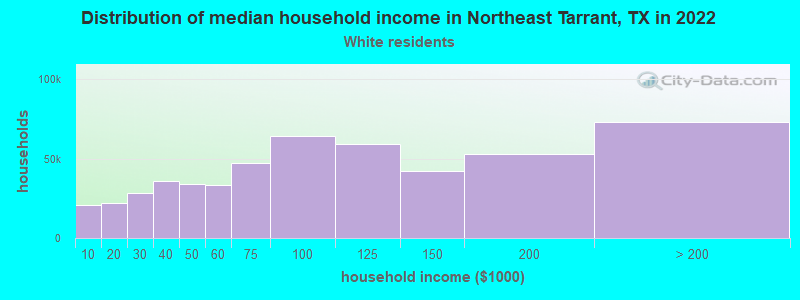
Median household income in Northeast Tarrant, TX in 2022:| Northeast Tarrant: | $106,732 |
| Texas: | $82,032 |
Change in median household income between 2000 and 2022:| Northeast Tarrant, Texas: | +75.6% |
| State: | +91.0% |
Number of households with income < $10k:| Northeast Tarrant: | 4.0% (20,465) |
| Texas: | 4.7% (273,716) |
Number of households with income $10k - 20k:| Northeast Tarrant: | 4.3% (22,135) |
| State: | 5.5% (322,702) |
Number of households with income $20k - 30k:| Northeast Tarrant: | 5.5% (28,251) |
| State: | 6.2% (363,947) |
Number of households with income $30k - 40k:| Northeast Tarrant: | 7.0% (35,643) |
| Texas: | 6.8% (399,275) |
Number of households with income $40k - 50k:| Northeast Tarrant: | 6.6% (33,724) |
| State: | 6.5% (383,417) |
Number of households with income $50k - 60k:| Northeast Tarrant: | 6.5% (33,180) |
| State: | 6.6% (388,535) |
Number of households with income $60k - 75k:| Northeast Tarrant: | 9.2% (47,232) |
| State: | 9.7% (566,295) |
Number of households with income $75k - 100k:| Northeast Tarrant: | 12.5% (64,089) |
| State: | 13.0% (760,276) |
Number of households with income $100k - 125k:| Northeast Tarrant: | 11.6% (59,408) |
| State: | 10.2% (597,596) |
Number of households with income $125k - 150k:| Northeast Tarrant: | 8.2% (41,871) |
| State: | 7.4% (436,830) |
Number of households with income $150k - 200k:| Northeast Tarrant: | 10.4% (53,053) |
| State: | 9.9% (583,067) |
Number of households with income > $200k:| Northeast Tarrant: | 14.3% (73,004) |
| Texas: | 13.5% (792,647) |
Aggregate household income in Northeast Tarrant in 2022: $51,271,718,500
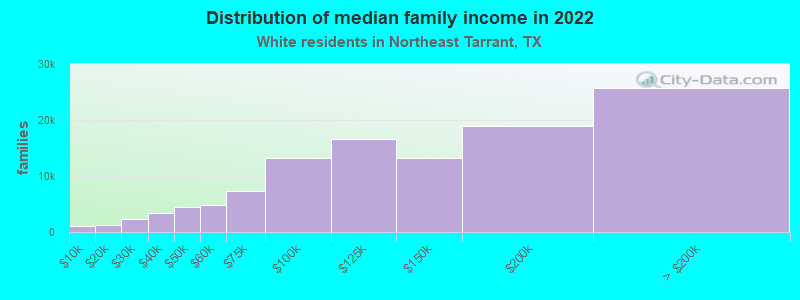
Median family income in Northeast Tarrant in 2022:| Northeast Tarrant: | $134,060 |
| Texas: | $101,788 |
Number of families with income < $10k:| Northeast Tarrant: | 0.9% (1,008) |
| State: | 2.8% (108,142) |
Number of families with income $10k - 20k:| Northeast Tarrant: | 1.2% (1,335) |
| Texas: | 2.9% (113,421) |
Number of families with income $20k - 30k:| Northeast Tarrant: | 2.0% (2,259) |
| State: | 4.1% (157,688) |
Number of families with income $30k - 40k:| Northeast Tarrant: | 3.0% (3,375) |
| Texas: | 5.2% (198,847) |
Number of families with income $40k - 50k:| Northeast Tarrant: | 4.0% (4,516) |
| State: | 5.6% (216,490) |
Number of families with income $50k - 60k:| Northeast Tarrant: | 4.3% (4,843) |
| State: | 5.7% (220,689) |
Number of families with income $60k - 75k:| Northeast Tarrant: | 6.6% (7,399) |
| State: | 9.0% (346,106) |
Number of families with income $75k - 100k:| Northeast Tarrant: | 11.8% (13,282) |
| State: | 13.7% (527,363) |
Number of families with income $100k - 125k:| Northeast Tarrant: | 14.7% (16,523) |
| Texas: | 11.6% (448,411) |
Number of families with income $125k - 150k:| Northeast Tarrant: | 11.8% (13,239) |
| State: | 9.2% (355,798) |
Number of families with income $150k - 200k:| Northeast Tarrant: | 16.8% (18,843) |
| Texas: | 12.5% (480,185) |
Number of families with income > $200k:| Northeast Tarrant: | 22.9% (25,671) |
| State: | 17.6% (677,490) |
Median non-family income in Northeast Tarrant in 2022:| Northeast Tarrant: | $58,671 |
| Texas: | $50,587 |
Change in median non-family income between 2000 and 2022:| Northeast Tarrant, Texas: | +66.6% |
| State: | +87.7% |
Median per capita income in Northeast Tarrant in 2022:| Northeast Tarrant: | $56,953 |
| Texas: | $47,740 |
Change in median per capita income between 2000 and 2022:| Northeast Tarrant, Texas: | +94.6% |
| State: | +114.3% |
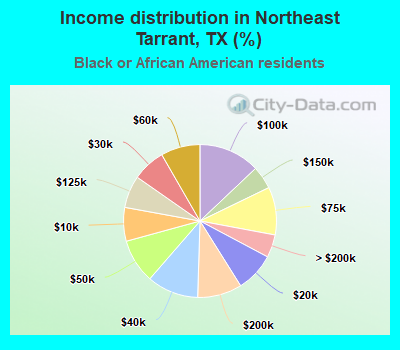
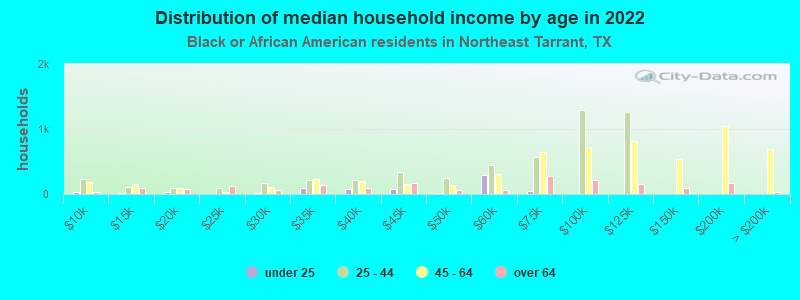
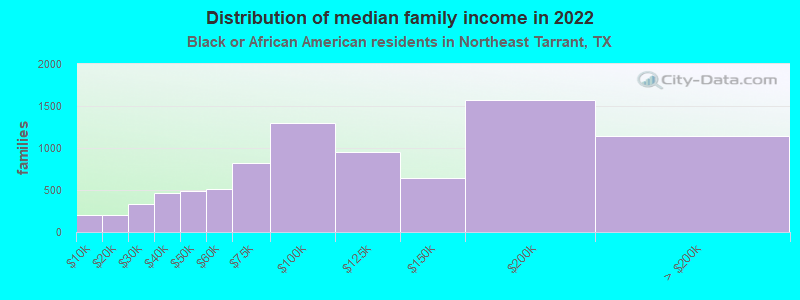
Income statistics for Black or African American residents
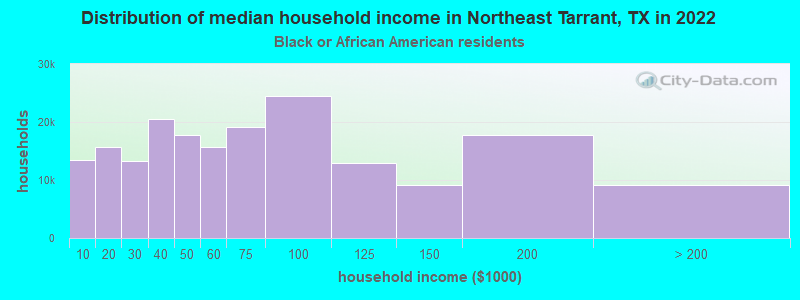
Median household income in Northeast Tarrant, TX in 2022:| Northeast Tarrant: | $78,118 |
| Texas: | $55,759 |
Change in median household income between 2000 and 2022:| Northeast Tarrant, Texas: | +83.4% |
| State: | +90.3% |
Number of households with income < $10k:| Northeast Tarrant: | 7.1% (13,483) |
| Texas: | 8.9% (126,378) |
Number of households with income $10k - 20k:| Northeast Tarrant: | 8.3% (15,692) |
| State: | 9.9% (140,369) |
Number of households with income $20k - 30k:| Northeast Tarrant: | 7.0% (13,216) |
| State: | 8.5% (120,639) |
Number of households with income $30k - 40k:| Northeast Tarrant: | 10.9% (20,579) |
| State: | 9.7% (137,517) |
Number of households with income $40k - 50k:| Northeast Tarrant: | 9.4% (17,694) |
| State: | 8.0% (112,973) |
Number of households with income $50k - 60k:| Northeast Tarrant: | 8.3% (15,717) |
| State: | 8.3% (117,156) |
Number of households with income $60k - 75k:| Northeast Tarrant: | 10.1% (19,138) |
| State: | 10.4% (147,462) |
Number of households with income $75k - 100k:| Northeast Tarrant: | 13.0% (24,492) |
| State: | 11.5% (162,718) |
Number of households with income $100k - 125k:| Northeast Tarrant: | 6.8% (12,921) |
| State: | 8.2% (115,829) |
Number of households with income $125k - 150k:| Northeast Tarrant: | 4.9% (9,203) |
| State: | 4.9% (69,556) |
Number of households with income $150k - 200k:| Northeast Tarrant: | 9.4% (17,808) |
| Texas: | 6.4% (90,701) |
Number of households with income > $200k:| Northeast Tarrant: | 4.8% (9,167) |
| State: | 5.5% (77,988) |
Aggregate household income in Northeast Tarrant in 2022: $1,412,574,648
Median family income in Northeast Tarrant in 2022:| Northeast Tarrant: | $94,408 |
| State: | $69,134 |
Number of families with income < $10k:| Northeast Tarrant: | 2.4% (206) |
| State: | 6.8% (55,625) |
Number of families with income $10k - 20k:| Northeast Tarrant: | 2.4% (207) |
| Texas: | 6.8% (55,300) |
Number of families with income $20k - 30k:| Northeast Tarrant: | 3.9% (338) |
| State: | 7.1% (57,877) |
Number of families with income $30k - 40k:| Northeast Tarrant: | 5.4% (470) |
| State: | 8.5% (68,776) |
Number of families with income $40k - 50k:| Northeast Tarrant: | 5.6% (487) |
| Texas: | 7.1% (57,907) |
Number of families with income $50k - 60k:| Northeast Tarrant: | 5.9% (509) |
| State: | 7.3% (59,511) |
Number of families with income $60k - 75k:| Northeast Tarrant: | 9.6% (826) |
| State: | 10.1% (81,994) |
Number of families with income $75k - 100k:| Northeast Tarrant: | 15.0% (1,301) |
| Texas: | 12.7% (103,723) |
Number of families with income $100k - 125k:| Northeast Tarrant: | 11.0% (955) |
| State: | 9.4% (76,609) |
Number of families with income $125k - 150k:| Northeast Tarrant: | 7.4% (640) |
| State: | 6.8% (55,615) |
Number of families with income $150k - 200k:| Northeast Tarrant: | 18.2% (1,573) |
| State: | 9.4% (76,146) |
Number of families with income > $200k:| Northeast Tarrant: | 13.2% (1,138) |
| State: | 7.9% (64,439) |
Median non-family income in Northeast Tarrant in 2022:| Northeast Tarrant: | $67,654 |
| State: | $40,133 |
Change in median non-family income between 2000 and 2022:| Northeast Tarrant, Texas: | +82.3% |
| Texas: | +102.2% |
Median per capita income in Northeast Tarrant in 2022:| Northeast Tarrant: | $40,972 |
| Texas: | $30,490 |
Change in median per capita income between 2000 and 2022:| Northeast Tarrant, Texas: | +89.6% |
| State: | +113.9% |
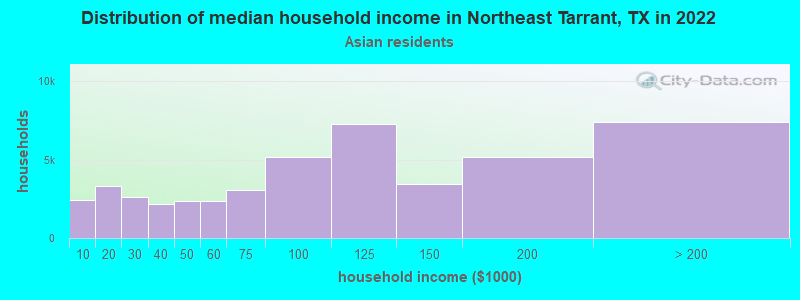
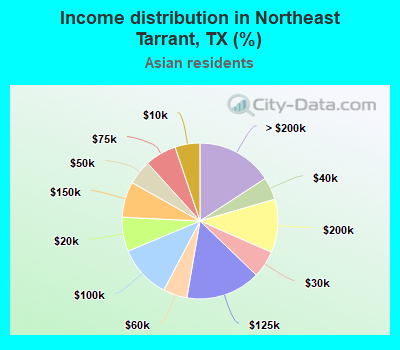
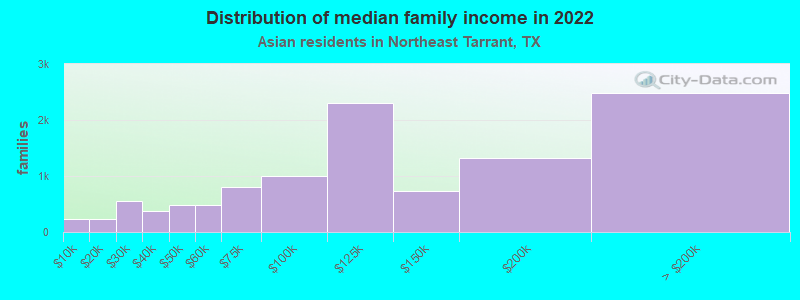
Income statistics for Asian residents
Median household income in Northeast Tarrant, TX in 2022:| Northeast Tarrant: | $110,715 |
| State: | $107,673 |
Change in median household income between 2000 and 2022:| Northeast Tarrant, Texas: | +104.8% |
| State: | +115.1% |
Number of households with income < $10k:| Northeast Tarrant: | 5.2% (2,411) |
| State: | 5.2% (29,885) |
Number of households with income $10k - 20k:| Northeast Tarrant: | 7.1% (3,317) |
| State: | 4.7% (27,044) |
Number of households with income $20k - 30k:| Northeast Tarrant: | 5.6% (2,631) |
| State: | 4.1% (23,363) |
Number of households with income $30k - 40k:| Northeast Tarrant: | 4.7% (2,198) |
| Texas: | 4.1% (23,309) |
Number of households with income $40k - 50k:| Northeast Tarrant: | 5.1% (2,375) |
| State: | 5.2% (29,826) |
Number of households with income $50k - 60k:| Northeast Tarrant: | 5.0% (2,331) |
| State: | 4.7% (26,512) |
Number of households with income $60k - 75k:| Northeast Tarrant: | 6.6% (3,064) |
| State: | 6.5% (36,905) |
Number of households with income $75k - 100k:| Northeast Tarrant: | 11.0% (5,145) |
| State: | 11.3% (64,350) |
Number of households with income $100k - 125k:| Northeast Tarrant: | 15.5% (7,250) |
| Texas: | 11.4% (64,714) |
Number of households with income $125k - 150k:| Northeast Tarrant: | 7.4% (3,470) |
| State: | 9.3% (52,719) |
Number of households with income $150k - 200k:| Northeast Tarrant: | 11.0% (5,166) |
| State: | 12.5% (70,953) |
Number of households with income > $200k:| Northeast Tarrant: | 15.8% (7,395) |
| Texas: | 21.1% (120,260) |
Aggregate household income in Northeast Tarrant in 2022: $1,638,202,883
Median family income in Northeast Tarrant in 2022:| Northeast Tarrant: | $117,501 |
| State: | $123,328 |
Number of families with income < $10k:| Northeast Tarrant: | 2.1% (228) |
| State: | 3.1% (13,567) |
Number of families with income $10k - 20k:| Northeast Tarrant: | 2.1% (229) |
| Texas: | 3.0% (13,043) |
Number of families with income $20k - 30k:| Northeast Tarrant: | 5.0% (550) |
| Texas: | 3.4% (14,738) |
Number of families with income $30k - 40k:| Northeast Tarrant: | 3.4% (377) |
| Texas: | 3.4% (15,033) |
Number of families with income $40k - 50k:| Northeast Tarrant: | 4.3% (477) |
| State: | 4.9% (21,622) |
Number of families with income $50k - 60k:| Northeast Tarrant: | 4.4% (488) |
| Texas: | 4.7% (20,568) |
Number of families with income $60k - 75k:| Northeast Tarrant: | 7.3% (797) |
| Texas: | 6.1% (26,637) |
Number of families with income $75k - 100k:| Northeast Tarrant: | 9.1% (1,001) |
| State: | 10.7% (46,626) |
Number of families with income $100k - 125k:| Northeast Tarrant: | 20.9% (2,298) |
| Texas: | 11.3% (49,585) |
Number of families with income $125k - 150k:| Northeast Tarrant: | 6.7% (735) |
| Texas: | 9.8% (43,043) |
Number of families with income $150k - 200k:| Northeast Tarrant: | 12.1% (1,328) |
| State: | 14.7% (64,203) |
Number of families with income > $200k:| Northeast Tarrant: | 22.6% (2,486) |
| State: | 24.8% (108,511) |
Median non-family income in Northeast Tarrant in 2022:| Northeast Tarrant: | $63,111 |
| State: | $64,320 |
Change in median non-family income between 2000 and 2022:| Northeast Tarrant, Texas: | +47.8% |
| State: | +131.1% |
Median per capita income in Northeast Tarrant in 2022:| Northeast Tarrant: | $43,852 |
| Texas: | $48,626 |
Change in median per capita income between 2000 and 2022:| Northeast Tarrant, Texas: | +112.0% |
| State: | +132.0% |
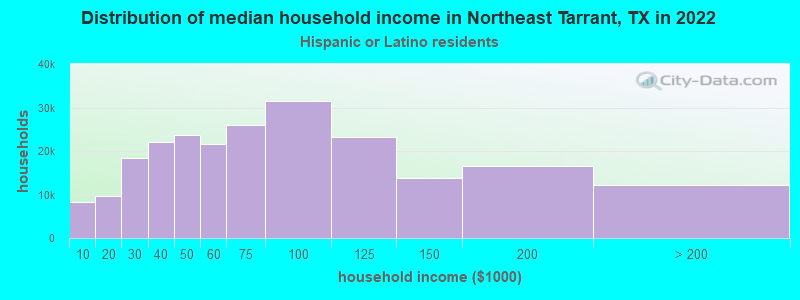
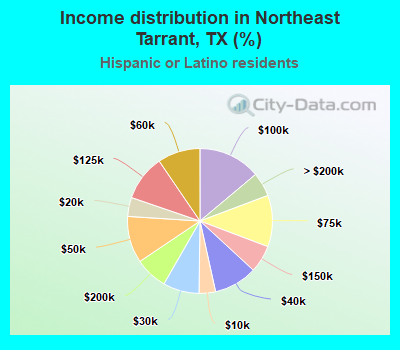
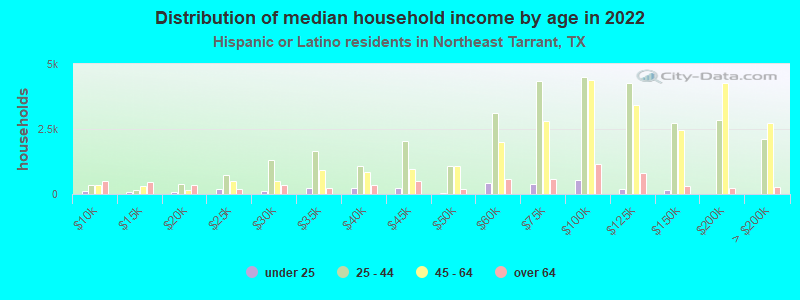
Income statistics for Hispanic or Latino residents
Median household income in Northeast Tarrant, TX in 2022:| Northeast Tarrant: | $79,666 |
| State: | $60,504 |
Change in median household income between 2000 and 2022:| Northeast Tarrant, Texas: | +81.6% |
| State: | +102.5% |
Number of households with income < $10k:| Northeast Tarrant: | 3.7% (8,349) |
| State: | 5.8% (213,953) |
Number of households with income $10k - 20k:| Northeast Tarrant: | 4.2% (9,590) |
| Texas: | 8.0% (297,456) |
Number of households with income $20k - 30k:| Northeast Tarrant: | 8.1% (18,308) |
| State: | 9.2% (340,166) |
Number of households with income $30k - 40k:| Northeast Tarrant: | 9.7% (21,974) |
| State: | 9.5% (354,336) |
Number of households with income $40k - 50k:| Northeast Tarrant: | 10.4% (23,718) |
| Texas: | 8.8% (327,013) |
Number of households with income $50k - 60k:| Northeast Tarrant: | 9.5% (21,594) |
| State: | 8.3% (308,818) |
Number of households with income $60k - 75k:| Northeast Tarrant: | 11.5% (26,050) |
| Texas: | 10.9% (405,109) |
Number of households with income $75k - 100k:| Northeast Tarrant: | 13.9% (31,583) |
| State: | 13.8% (511,639) |
Number of households with income $100k - 125k:| Northeast Tarrant: | 10.2% (23,243) |
| State: | 8.6% (319,728) |
Number of households with income $125k - 150k:| Northeast Tarrant: | 6.1% (13,893) |
| State: | 5.7% (210,932) |
Number of households with income $150k - 200k:| Northeast Tarrant: | 7.3% (16,563) |
| State: | 6.4% (236,055) |
Number of households with income > $200k:| Northeast Tarrant: | 5.4% (12,223) |
| State: | 5.1% (189,259) |
Aggregate household income in Northeast Tarrant in 2022: $4,748,783,648
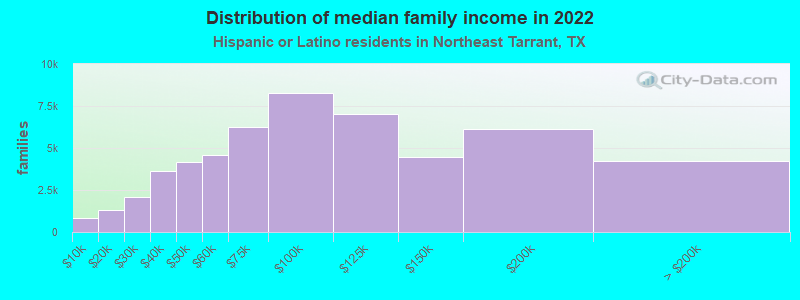
Median family income in Northeast Tarrant in 2022:| Northeast Tarrant: | $92,537 |
| Texas: | $65,080 |
Number of families with income < $10k:| Northeast Tarrant: | 1.6% (841) |
| State: | 5.3% (147,493) |
Number of families with income $10k - 20k:| Northeast Tarrant: | 2.4% (1,284) |
| Texas: | 6.3% (174,531) |
Number of families with income $20k - 30k:| Northeast Tarrant: | 3.9% (2,089) |
| State: | 8.6% (238,528) |
Number of families with income $30k - 40k:| Northeast Tarrant: | 6.9% (3,657) |
| State: | 9.1% (251,999) |
Number of families with income $40k - 50k:| Northeast Tarrant: | 7.9% (4,192) |
| Texas: | 8.6% (240,188) |
Number of families with income $50k - 60k:| Northeast Tarrant: | 8.7% (4,583) |
| State: | 8.0% (223,566) |
Number of families with income $60k - 75k:| Northeast Tarrant: | 11.8% (6,228) |
| State: | 10.9% (302,688) |
Number of families with income $75k - 100k:| Northeast Tarrant: | 15.7% (8,295) |
| State: | 14.3% (398,554) |
Number of families with income $100k - 125k:| Northeast Tarrant: | 13.2% (7,015) |
| State: | 9.5% (264,007) |
Number of families with income $125k - 150k:| Northeast Tarrant: | 8.4% (4,458) |
| State: | 6.2% (171,274) |
Number of families with income $150k - 200k:| Northeast Tarrant: | 11.5% (6,111) |
| Texas: | 7.3% (202,259) |
Number of families with income > $200k:| Northeast Tarrant: | 7.9% (4,208) |
| Texas: | 5.9% (165,129) |
Median non-family income in Northeast Tarrant in 2022:| Northeast Tarrant: | $48,743 |
| Texas: | $39,934 |
Change in median non-family income between 2000 and 2022:| Northeast Tarrant, Texas: | +50.4% |
| State: | +109.1% |
Median per capita income in Northeast Tarrant in 2022:| Northeast Tarrant: | $34,406 |
| Texas: | $24,862 |
Change in median per capita income between 2000 and 2022:| Northeast Tarrant, Texas: | +112.5% |
| State: | +130.8% |
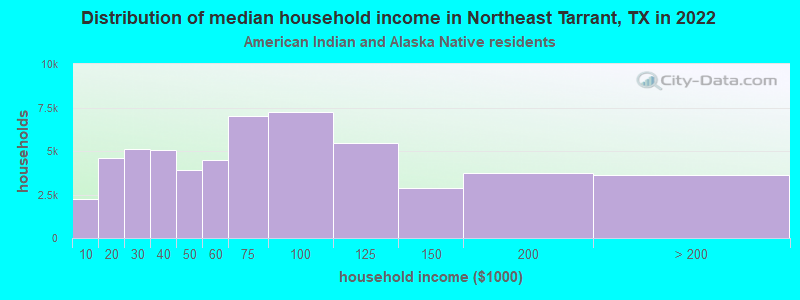
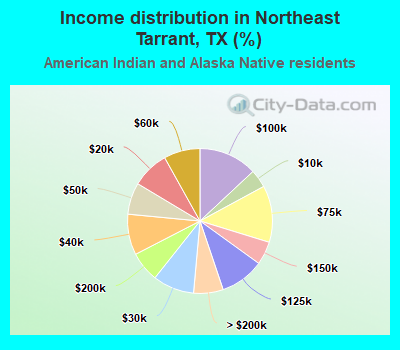
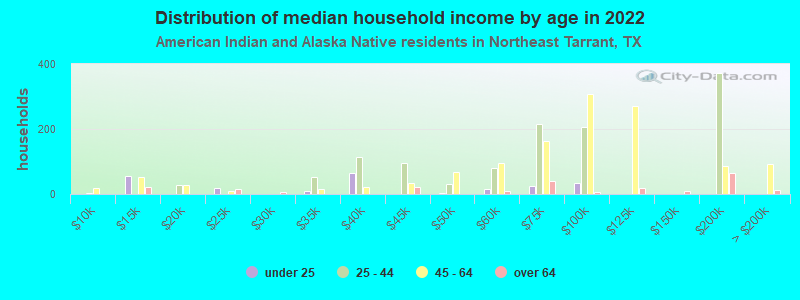
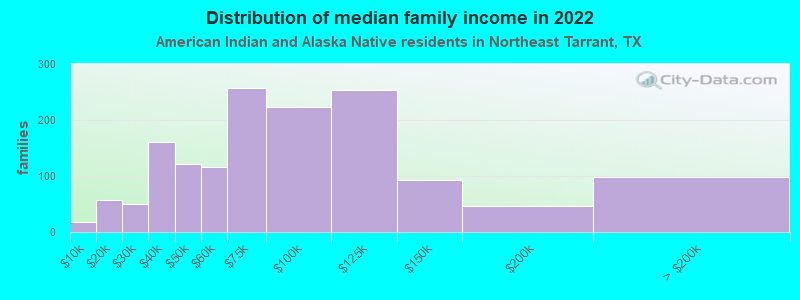
Income statistics for American Indian and Alaska Native residents
Median household income in Northeast Tarrant, TX in 2022:| Northeast Tarrant: | $101,902 |
| State: | $65,765 |
Change in median household income between 2000 and 2022:| Northeast Tarrant, Texas: | +120.8% |
| Texas: | +88.3% |
Number of households with income < $10k:| Northeast Tarrant: | 4.1% (2,249) |
| State: | 4.1% (3,398) |
Number of households with income $10k - 20k:| Northeast Tarrant: | 8.3% (4,598) |
| State: | 8.3% (6,949) |
Number of households with income $20k - 30k:| Northeast Tarrant: | 9.3% (5,123) |
| State: | 9.3% (7,742) |
Number of households with income $30k - 40k:| Northeast Tarrant: | 9.1% (5,041) |
| State: | 9.1% (7,627) |
Number of households with income $40k - 50k:| Northeast Tarrant: | 7.1% (3,922) |
| State: | 7.1% (5,922) |
Number of households with income $50k - 60k:| Northeast Tarrant: | 8.1% (4,475) |
| State: | 8.1% (6,761) |
Number of households with income $60k - 75k:| Northeast Tarrant: | 12.7% (7,003) |
| Texas: | 12.7% (10,588) |
Number of households with income $75k - 100k:| Northeast Tarrant: | 13.0% (7,216) |
| Texas: | 13.0% (10,903) |
Number of households with income $100k - 125k:| Northeast Tarrant: | 9.9% (5,464) |
| Texas: | 9.9% (8,256) |
Number of households with income $125k - 150k:| Northeast Tarrant: | 5.2% (2,880) |
| State: | 5.2% (4,355) |
Number of households with income $150k - 200k:| Northeast Tarrant: | 6.7% (3,717) |
| State: | 6.7% (5,623) |
Number of households with income > $200k:| Northeast Tarrant: | 6.6% (3,649) |
| Texas: | 6.6% (5,522) |
Aggregate household income in Northeast Tarrant in 2022: $188,960,754
Median family income in Northeast Tarrant in 2022:| Northeast Tarrant: | $94,853 |
| Texas: | $72,369 |
Number of families with income < $10k:| Northeast Tarrant: | 1.2% (18) |
| State: | 2.7% (1,671) |
Number of families with income $10k - 20k:| Northeast Tarrant: | 3.8% (57) |
| Texas: | 8.0% (4,891) |
Number of families with income $20k - 30k:| Northeast Tarrant: | 3.3% (50) |
| State: | 7.3% (4,502) |
Number of families with income $30k - 40k:| Northeast Tarrant: | 10.7% (160) |
| State: | 7.5% (4,592) |
Number of families with income $40k - 50k:| Northeast Tarrant: | 8.2% (122) |
| State: | 7.9% (4,855) |
Number of families with income $50k - 60k:| Northeast Tarrant: | 7.8% (116) |
| State: | 7.1% (4,347) |
Number of families with income $60k - 75k:| Northeast Tarrant: | 17.2% (257) |
| State: | 12.1% (7,429) |
Number of families with income $75k - 100k:| Northeast Tarrant: | 14.9% (223) |
| Texas: | 14.4% (8,852) |
Number of families with income $100k - 125k:| Northeast Tarrant: | 16.9% (253) |
| State: | 11.4% (6,997) |
Number of families with income $125k - 150k:| Northeast Tarrant: | 6.2% (93) |
| State: | 7.5% (4,609) |
Number of families with income $150k - 200k:| Northeast Tarrant: | 3.2% (47) |
| State: | 6.9% (4,246) |
Number of families with income > $200k:| Northeast Tarrant: | 6.6% (99) |
| State: | 7.0% (4,287) |
Median non-family income in Northeast Tarrant in 2022:| Northeast Tarrant: | $60,832 |
| Texas: | $40,351 |
Change in median non-family income between 2000 and 2022:| Northeast Tarrant, Texas: | +99.2% |
| Texas: | +71.9% |
Median per capita income in Northeast Tarrant in 2022:| Northeast Tarrant: | $39,459 |
| State: | $28,166 |
Change in median per capita income between 2000 and 2022:| Northeast Tarrant, Texas: | +108.2% |
| State: | +77.2% |
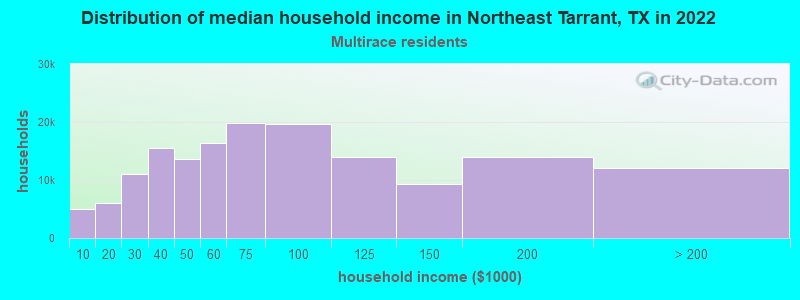
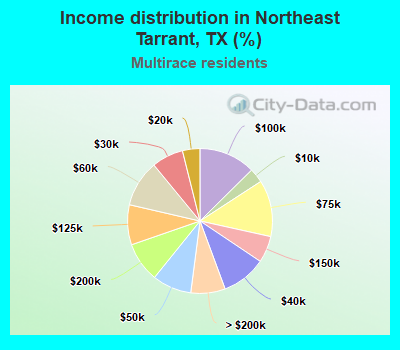
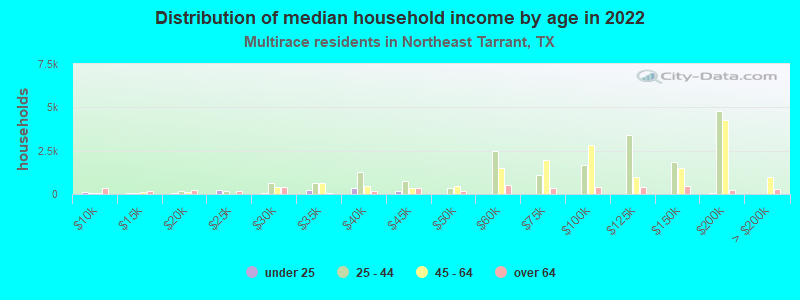
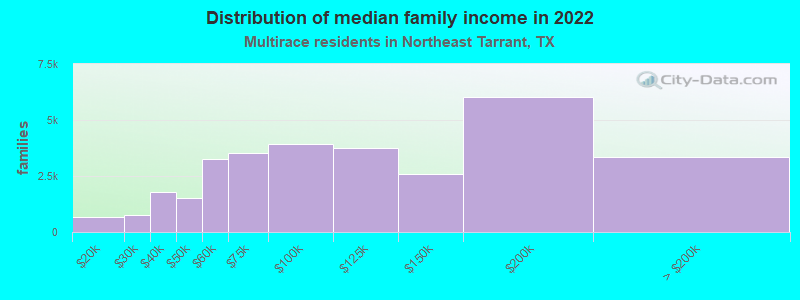
Income statistics for Multirace residents
Median household income in Northeast Tarrant, TX in 2022:| Northeast Tarrant: | $82,465 |
| State: | $62,748 |
Change in median household income between 2000 and 2022:| Northeast Tarrant, Texas: | +75.4% |
| Texas: | +92.3% |
Number of households with income < $10k:| Northeast Tarrant: | 3.2% (5,024) |
| State: | 5.5% (122,324) |
Number of households with income $10k - 20k:| Northeast Tarrant: | 3.9% (6,084) |
| Texas: | 8.2% (182,232) |
Number of households with income $20k - 30k:| Northeast Tarrant: | 7.1% (11,049) |
| State: | 8.5% (189,456) |
Number of households with income $30k - 40k:| Northeast Tarrant: | 10.0% (15,579) |
| State: | 8.9% (197,499) |
Number of households with income $40k - 50k:| Northeast Tarrant: | 8.8% (13,685) |
| State: | 8.7% (191,735) |
Number of households with income $50k - 60k:| Northeast Tarrant: | 10.4% (16,296) |
| State: | 8.0% (177,535) |
Number of households with income $60k - 75k:| Northeast Tarrant: | 12.6% (19,752) |
| State: | 10.5% (232,479) |
Number of households with income $75k - 100k:| Northeast Tarrant: | 12.6% (19,730) |
| Texas: | 13.1% (290,448) |
Number of households with income $100k - 125k:| Northeast Tarrant: | 8.9% (13,966) |
| State: | 8.6% (191,595) |
Number of households with income $125k - 150k:| Northeast Tarrant: | 6.0% (9,306) |
| State: | 6.0% (133,361) |
Number of households with income $150k - 200k:| Northeast Tarrant: | 8.9% (13,893) |
| State: | 7.2% (159,195) |
Number of households with income > $200k:| Northeast Tarrant: | 7.7% (12,005) |
| State: | 6.7% (148,064) |
Aggregate household income in Northeast Tarrant in 2022: $3,608,903,840
Median family income in Northeast Tarrant in 2022:| Northeast Tarrant: | $95,209 |
| Texas: | $69,780 |
Number of families with income < $10k:| Northeast Tarrant: | 0.2% (52) |
| State: | 4.4% (70,825) |
Number of families with income $10k - 20k:| Northeast Tarrant: | 2.2% (681) |
| State: | 5.9% (95,279) |
Number of families with income $20k - 30k:| Northeast Tarrant: | 2.5% (770) |
| State: | 7.8% (126,627) |
Number of families with income $30k - 40k:| Northeast Tarrant: | 5.7% (1,792) |
| State: | 8.5% (137,626) |
Number of families with income $40k - 50k:| Northeast Tarrant: | 4.8% (1,500) |
| Texas: | 8.4% (135,809) |
Number of families with income $50k - 60k:| Northeast Tarrant: | 10.4% (3,251) |
| Texas: | 7.9% (127,739) |
Number of families with income $60k - 75k:| Northeast Tarrant: | 11.2% (3,505) |
| State: | 10.5% (169,549) |
Number of families with income $75k - 100k:| Northeast Tarrant: | 12.6% (3,921) |
| Texas: | 14.0% (226,284) |
Number of families with income $100k - 125k:| Northeast Tarrant: | 12.0% (3,752) |
| State: | 9.5% (153,597) |
Number of families with income $125k - 150k:| Northeast Tarrant: | 8.3% (2,603) |
| State: | 6.7% (107,900) |
Number of families with income $150k - 200k:| Northeast Tarrant: | 19.3% (6,028) |
| State: | 8.5% (137,607) |
Number of families with income > $200k:| Northeast Tarrant: | 10.7% (3,336) |
| State: | 7.9% (127,299) |
Median non-family income in Northeast Tarrant in 2022:| Northeast Tarrant: | $51,040 |
| Texas: | $40,634 |
Change in median non-family income between 2000 and 2022:| Northeast Tarrant, Texas: | +66.1% |
| Texas: | +77.2% |
Median per capita income in Northeast Tarrant in 2022:| Northeast Tarrant: | $33,194 |
| State: | $26,785 |
Change in median per capita income between 2000 and 2022:| Northeast Tarrant, Texas: | +97.2% |
| Texas: | +110.9% |
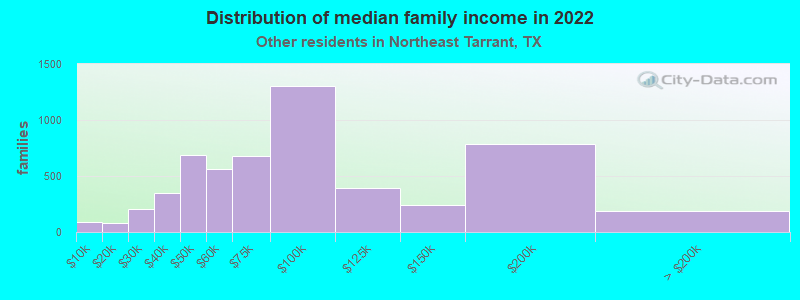
Income statistics for other residents
Number of households with income < $10k:| Northeast Tarrant: | 5.9% (424) |
| State: | 5.9% (54,162) |
Number of households with income $10k - 20k:| Northeast Tarrant: | 4.3% (309) |
| State: | 6.8% (62,891) |
Number of households with income $20k - 30k:| Northeast Tarrant: | 9.7% (694) |
| Texas: | 10.6% (97,294) |
Number of households with income $30k - 40k:| Northeast Tarrant: | 7.5% (538) |
| State: | 10.8% (99,670) |
Number of households with income $40k - 50k:| Northeast Tarrant: | 14.9% (1,065) |
| State: | 9.3% (85,548) |
Number of households with income $50k - 60k:| Northeast Tarrant: | 9.1% (653) |
| State: | 9.0% (82,757) |
Number of households with income $60k - 75k:| Northeast Tarrant: | 11.8% (840) |
| State: | 10.9% (100,326) |
Number of households with income $75k - 100k:| Northeast Tarrant: | 15.1% (1,082) |
| Texas: | 14.0% (128,767) |
Number of households with income $100k - 125k:| Northeast Tarrant: | 8.1% (579) |
| State: | 8.2% (75,218) |
Number of households with income $125k - 150k:| Northeast Tarrant: | 4.2% (298) |
| Texas: | 4.8% (44,223) |
Number of households with income $150k - 200k:| Northeast Tarrant: | 5.7% (408) |
| State: | 5.6% (51,376) |
Number of households with income > $200k:| Northeast Tarrant: | 3.5% (253) |
| State: | 4.0% (36,393) |
Aggregate household income in Northeast Tarrant in 2022: $534,323,208
Median family income in Northeast Tarrant in 2022:| Northeast Tarrant: | $76,970 |
| Texas: | $60,064 |
Number of families with income < $10k:| Northeast Tarrant: | 1.6% (91) |
| State: | 6.8% (47,502) |
Number of families with income $10k - 20k:| Northeast Tarrant: | 1.5% (81) |
| State: | 6.0% (41,763) |
Number of families with income $20k - 30k:| Northeast Tarrant: | 3.7% (206) |
| Texas: | 9.9% (68,761) |
Number of families with income $30k - 40k:| Northeast Tarrant: | 6.3% (348) |
| Texas: | 9.7% (67,685) |
Number of families with income $40k - 50k:| Northeast Tarrant: | 12.3% (686) |
| Texas: | 9.0% (62,441) |
Number of families with income $50k - 60k:| Northeast Tarrant: | 10.1% (564) |
| State: | 8.5% (59,321) |
Number of families with income $60k - 75k:| Northeast Tarrant: | 12.2% (679) |
| State: | 11.2% (77,588) |
Number of families with income $75k - 100k:| Northeast Tarrant: | 23.4% (1,301) |
| State: | 14.5% (101,032) |
Number of families with income $100k - 125k:| Northeast Tarrant: | 7.0% (392) |
| Texas: | 8.8% (61,439) |
Number of families with income $125k - 150k:| Northeast Tarrant: | 4.4% (242) |
| Texas: | 5.1% (35,727) |
Number of families with income $150k - 200k:| Northeast Tarrant: | 14.1% (782) |
| State: | 5.9% (41,211) |
Number of families with income > $200k:| Northeast Tarrant: | 3.4% (187) |
| State: | 4.5% (31,243) |
Median non-family income in Northeast Tarrant in 2022:| Northeast Tarrant: | $49,816 |
| State: | $38,690 |
Change in median non-family income between 2000 and 2022:| Northeast Tarrant, Texas: | +41.2% |
| Texas: | +90.2% |
Median per capita income in Northeast Tarrant in 2022:| Northeast Tarrant: | $31,385 |
| State: | $23,899 |
Change in median per capita income between 2000 and 2022:| Northeast Tarrant, Texas: | +122.2% |
| Texas: | +135.2% |