Northern Cheyenne, Montana (MT) income map, earnings map, and wages data
The median household income in Northern Cheyenne, MT in 2022 was $57,471, which was 17.7% less than the median annual income of $67,631 across the entire state of Montana. Compared to the median income of $28,113 in 2000 this represents an increase of 51.1%. The per capita income in 2022 was $16,332, which means an increase of 55.3% compared to 2000 when it was $7,307.
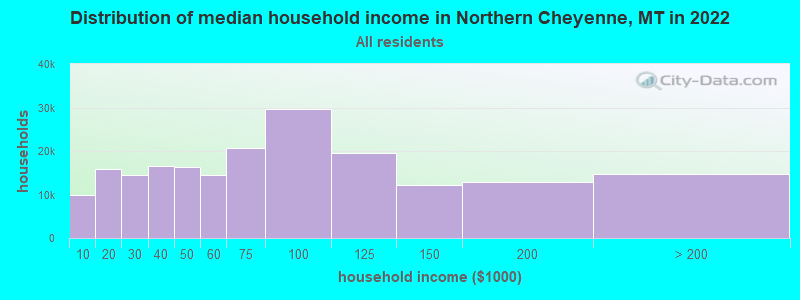
Income statistics for all residents
Median household income in Northern Cheyenne, MT in 2022:| Northern Cheyenne: | $57,472 |
| State: | $67,631 |
Change in median household income between 2000 and 2022:| Northern Cheyenne, Montana: | +104.4% |
| State: | +104.8% |
Number of households with income < $10k:| Northern Cheyenne: | 5.0% (9,869) |
| State: | 5.0% (23,231) |
Number of households with income $10k - 20k:| Northern Cheyenne: | 8.1% (15,966) |
| State: | 8.1% (37,478) |
Number of households with income $20k - 30k:| Northern Cheyenne: | 7.3% (14,485) |
| State: | 7.3% (33,880) |
Number of households with income $30k - 40k:| Northern Cheyenne: | 8.4% (16,530) |
| State: | 8.4% (38,912) |
Number of households with income $40k - 50k:| Northern Cheyenne: | 8.3% (16,383) |
| State: | 8.3% (38,441) |
Number of households with income $50k - 60k:| Northern Cheyenne: | 7.4% (14,512) |
| State: | 7.4% (34,172) |
Number of households with income $60k - 75k:| Northern Cheyenne: | 10.5% (20,751) |
| Montana: | 10.5% (48,783) |
Number of households with income $75k - 100k:| Northern Cheyenne: | 15.0% (29,621) |
| Montana: | 15.0% (69,571) |
Number of households with income $100k - 125k:| Northern Cheyenne: | 9.9% (19,537) |
| State: | 9.9% (45,889) |
Number of households with income $125k - 150k:| Northern Cheyenne: | 6.1% (12,105) |
| Montana: | 6.1% (28,538) |
Number of households with income $150k - 200k:| Northern Cheyenne: | 6.5% (12,899) |
| State: | 6.6% (30,552) |
Number of households with income > $200k:| Northern Cheyenne: | 7.4% (14,674) |
| Montana: | 7.5% (34,625) |
Aggregate household income in Northern Cheyenne in 2022: $113,663,708
Median family income in Northern Cheyenne in 2022:| Northern Cheyenne: | $58,270 |
| State: | $83,580 |
Median non-family income in Northern Cheyenne in 2022:| Northern Cheyenne: | $17,421 |
| State: | $40,582 |
Change in median non-family income between 2000 and 2022:| Northern Cheyenne, Montana: | +103.9% |
| State: | +108.3% |
Median per capita income in Northern Cheyenne in 2022:| Northern Cheyenne: | $16,332 |
| State: | $38,329 |
Change in median per capita income between 2000 and 2022:| Northern Cheyenne, Montana: | +123.5% |
| State: | +123.5% |
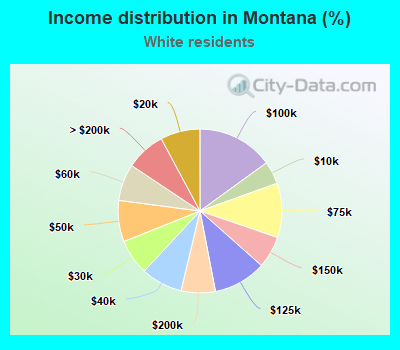
Income statistics for White residents
Median household income in Northern Cheyenne, MT in 2022:| Northern Cheyenne: | $59,730 |
| State: | $69,744 |
Change in median household income between 2000 and 2022:| Northern Cheyenne, Montana: | +106.8% |
| State: | +106.5% |
Number of households with income < $10k:| Northern Cheyenne: | 4.5% (7,901) |
| Montana: | 4.5% (18,406) |
Number of households with income $10k - 20k:| Northern Cheyenne: | 7.8% (13,757) |
| State: | 7.8% (32,061) |
Number of households with income $20k - 30k:| Northern Cheyenne: | 7.1% (12,413) |
| State: | 7.0% (28,825) |
Number of households with income $30k - 40k:| Northern Cheyenne: | 8.2% (14,349) |
| State: | 8.2% (33,552) |
Number of households with income $40k - 50k:| Northern Cheyenne: | 8.2% (14,364) |
| State: | 8.2% (33,446) |
Number of households with income $50k - 60k:| Northern Cheyenne: | 7.2% (12,723) |
| State: | 7.3% (29,753) |
Number of households with income $60k - 75k:| Northern Cheyenne: | 10.8% (18,883) |
| State: | 10.7% (44,051) |
Number of households with income $75k - 100k:| Northern Cheyenne: | 15.0% (26,379) |
| Montana: | 15.0% (61,580) |
Number of households with income $100k - 125k:| Northern Cheyenne: | 10.4% (18,272) |
| Montana: | 10.4% (42,636) |
Number of households with income $125k - 150k:| Northern Cheyenne: | 6.3% (11,085) |
| State: | 6.3% (25,938) |
Number of households with income $150k - 200k:| Northern Cheyenne: | 6.7% (11,791) |
| State: | 6.8% (27,704) |
Number of households with income > $200k:| Northern Cheyenne: | 7.8% (13,688) |
| State: | 7.8% (32,101) |
Aggregate household income in Northern Cheyenne in 2022: $18,050,808
Median family income in Northern Cheyenne in 2022:| Northern Cheyenne: | $60,363 |
| State: | $86,163 |
Number of families with income < $10k:| Northern Cheyenne: | 14.6% (4) |
| State: | 2.0% (4,963) |
Number of families with income $10k - 20k:| Northern Cheyenne: | 6.0% (2) |
| Montana: | 2.8% (7,063) |
Number of families with income $20k - 30k:| Northern Cheyenne: | 27.5% (7) |
| State: | 4.5% (11,218) |
Number of families with income $30k - 40k:| Northern Cheyenne: | 5.9% (2) |
| State: | 6.0% (14,834) |
Number of families with income $50k - 60k:| Northern Cheyenne: | 45.9% (12) |
| State: | 7.3% (18,007) |
Median non-family income in Northern Cheyenne in 2022:| Northern Cheyenne: | $30,361 |
| State: | $41,403 |
Change in median non-family income between 2000 and 2022:| Northern Cheyenne, Montana: | +105.8% |
| State: | +109.4% |
Median per capita income in Northern Cheyenne in 2022:| Northern Cheyenne: | $27,355 |
| Montana: | $40,453 |
Change in median per capita income between 2000 and 2022:| Northern Cheyenne, Montana: | +125.9% |
| Montana: | +125.6% |
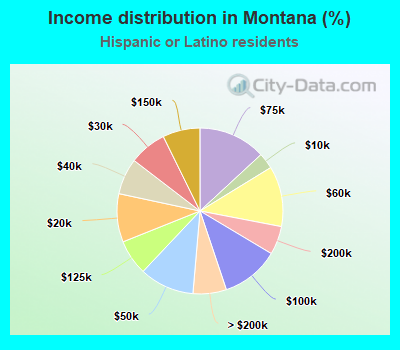
Income statistics for Hispanic or Latino residents
Median household income in Northern Cheyenne, MT in 2022:| Northern Cheyenne: | $13,054 |
| Montana: | $60,797 |
Change in median household income between 2000 and 2022:| Northern Cheyenne, Montana: | +108.9% |
| Montana: | +117.3% |
Number of households with income < $10k:| Northern Cheyenne: | 3.1% (52) |
| State: | 3.1% (455) |
Number of households with income $10k - 20k:| Northern Cheyenne: | 9.5% (158) |
| Montana: | 9.4% (1,375) |
Number of households with income $20k - 30k:| Northern Cheyenne: | 7.1% (118) |
| State: | 7.3% (1,066) |
Number of households with income $30k - 40k:| Northern Cheyenne: | 7.3% (121) |
| Montana: | 7.1% (1,032) |
Number of households with income $40k - 50k:| Northern Cheyenne: | 10.6% (176) |
| State: | 10.7% (1,557) |
Number of households with income $50k - 60k:| Northern Cheyenne: | 11.4% (189) |
| State: | 11.8% (1,722) |
Number of households with income $60k - 75k:| Northern Cheyenne: | 12.3% (205) |
| Montana: | 13.1% (1,918) |
Number of households with income $75k - 100k:| Northern Cheyenne: | 12.2% (202) |
| State: | 11.3% (1,648) |
Number of households with income $100k - 125k:| Northern Cheyenne: | 6.2% (103) |
| State: | 6.9% (1,011) |
Number of households with income $125k - 150k:| Northern Cheyenne: | 8.0% (133) |
| State: | 7.3% (1,064) |
Number of households with income $150k - 200k:| Northern Cheyenne: | 5.4% (89) |
| Montana: | 5.6% (812) |
Number of households with income > $200k:| Northern Cheyenne: | 7.0% (116) |
| State: | 6.5% (951) |
Aggregate household income in Northern Cheyenne in 2022: $353,032
Median family income in Northern Cheyenne in 2022:| Northern Cheyenne: | $12,194 |
| Montana: | $66,328 |
Median per capita income in Northern Cheyenne in 2022:| Northern Cheyenne: | $16,529 |
| Montana: | $23,068 |
Change in median per capita income between 2000 and 2022:| Northern Cheyenne, Montana: | +112.9% |
| Montana: | +122.4% |
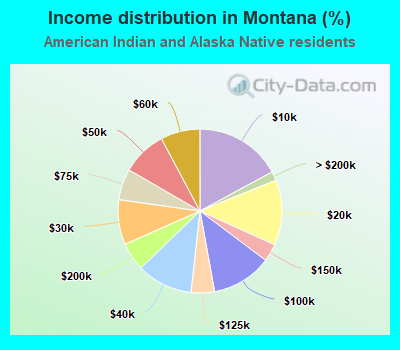
Income statistics for American Indian and Alaska Native residents
Median household income in Northern Cheyenne, MT in 2022:| Northern Cheyenne: | $47,737 |
| State: | $40,063 |
Change in median household income between 2000 and 2022:| Northern Cheyenne, Montana: | +82.9% |
| Montana: | +77.9% |
Number of households with income < $10k:| Northern Cheyenne: | 16.6% (1,711) |
| Montana: | 17.1% (3,122) |
Number of households with income $10k - 20k:| Northern Cheyenne: | 12.9% (1,331) |
| State: | 12.9% (2,355) |
Number of households with income $20k - 30k:| Northern Cheyenne: | 9.0% (928) |
| Montana: | 8.9% (1,620) |
Number of households with income $30k - 40k:| Northern Cheyenne: | 11.2% (1,154) |
| State: | 11.0% (2,013) |
Number of households with income $40k - 50k:| Northern Cheyenne: | 8.9% (914) |
| State: | 8.8% (1,615) |
Number of households with income $50k - 60k:| Northern Cheyenne: | 8.1% (836) |
| State: | 7.8% (1,423) |
Number of households with income $60k - 75k:| Northern Cheyenne: | 5.7% (584) |
| State: | 6.1% (1,117) |
Number of households with income $75k - 100k:| Northern Cheyenne: | 12.5% (1,284) |
| Montana: | 11.9% (2,169) |
Number of households with income $100k - 125k:| Northern Cheyenne: | 4.6% (471) |
| Montana: | 4.6% (845) |
Number of households with income $125k - 150k:| Northern Cheyenne: | 3.4% (347) |
| State: | 3.5% (637) |
Number of households with income $150k - 200k:| Northern Cheyenne: | 5.1% (529) |
| State: | 5.6% (1,015) |
Number of households with income > $200k:| Northern Cheyenne: | 1.8% (190) |
| Montana: | 1.8% (324) |
Aggregate household income in Northern Cheyenne in 2022: $19,951,398
Median family income in Northern Cheyenne in 2022:| Northern Cheyenne: | $40,575 |
| Montana: | $41,048 |
Number of families with income < $10k:| Northern Cheyenne: | 9.2% (19) |
| State: | 10.3% (1,176) |
Number of families with income $10k - 20k:| Northern Cheyenne: | 14.4% (30) |
| State: | 12.8% (1,470) |
Number of families with income $20k - 30k:| Northern Cheyenne: | 16.2% (34) |
| State: | 8.1% (932) |
Number of families with income $30k - 40k:| Northern Cheyenne: | 37.8% (79) |
| State: | 17.4% (1,998) |
Number of families with income $40k - 50k:| Northern Cheyenne: | 3.1% (7) |
| Montana: | 5.9% (680) |
Number of families with income $50k - 60k:| Northern Cheyenne: | 9.8% (21) |
| State: | 7.6% (866) |
Number of families with income $60k - 75k:| Northern Cheyenne: | 4.4% (9) |
| State: | 8.2% (936) |
Number of families with income $75k - 100k:| Northern Cheyenne: | 5.1% (11) |
| Montana: | 10.0% (1,145) |
Median non-family income in Northern Cheyenne in 2022:| Northern Cheyenne: | $15,486 |
| State: | $23,519 |
Change in median non-family income between 2000 and 2022:| Northern Cheyenne, Montana: | +103.7% |
| State: | +93.1% |
Median per capita income in Northern Cheyenne in 2022:| Northern Cheyenne: | $15,061 |
| Montana: | $19,038 |
Change in median per capita income between 2000 and 2022:| Northern Cheyenne, Montana: | +129.4% |
| State: | +114.7% |
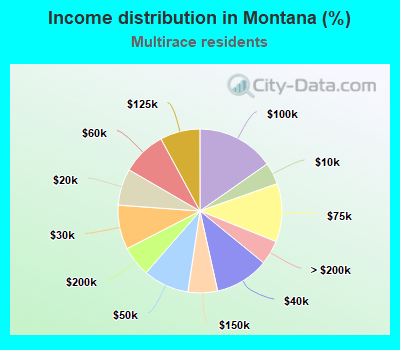
Income statistics for Multirace residents
Median household income in Northern Cheyenne, MT in 2022:| Northern Cheyenne: | $95,782 |
| State: | $61,907 |
Change in median household income between 2000 and 2022:| Northern Cheyenne, Montana: | +141.3% |
| State: | +137.5% |
Number of households with income < $10k:| Northern Cheyenne: | 4.3% (897) |
| State: | 4.3% (1,142) |
Number of households with income $10k - 20k:| Northern Cheyenne: | 7.1% (1,481) |
| State: | 7.2% (1,913) |
Number of households with income $20k - 30k:| Northern Cheyenne: | 8.7% (1,816) |
| Montana: | 8.7% (2,315) |
Number of households with income $30k - 40k:| Northern Cheyenne: | 10.8% (2,241) |
| State: | 10.7% (2,822) |
Number of households with income $40k - 50k:| Northern Cheyenne: | 8.9% (1,850) |
| State: | 9.0% (2,396) |
Number of households with income $50k - 60k:| Northern Cheyenne: | 8.6% (1,781) |
| State: | 8.7% (2,311) |
Number of households with income $60k - 75k:| Northern Cheyenne: | 11.5% (2,385) |
| State: | 11.5% (3,043) |
Number of households with income $75k - 100k:| Northern Cheyenne: | 15.8% (3,289) |
| Montana: | 15.3% (4,050) |
Number of households with income $100k - 125k:| Northern Cheyenne: | 7.9% (1,650) |
| State: | 7.9% (2,089) |
Number of households with income $125k - 150k:| Northern Cheyenne: | 5.7% (1,180) |
| State: | 5.8% (1,541) |
Number of households with income $150k - 200k:| Northern Cheyenne: | 5.8% (1,199) |
| Montana: | 6.0% (1,587) |
Number of households with income > $200k:| Northern Cheyenne: | 4.8% (986) |
| State: | 4.8% (1,271) |
Aggregate household income in Northern Cheyenne in 2022: $9,782,021
Median family income in Northern Cheyenne in 2022:| Northern Cheyenne: | $85,067 |
| Montana: | $70,768 |
Number of families with income $30k - 40k:| Northern Cheyenne: | 30.1% (17) |
| State: | 7.0% (1,237) |
Number of families with income $50k - 60k:| Northern Cheyenne: | 69.9% (38) |
| State: | 8.3% (1,468) |
Median per capita income in Northern Cheyenne in 2022:| Northern Cheyenne: | $41,473 |
| Montana: | $29,391 |