Northwest Grayson, Texas (TX) income map, earnings map, and wages data
The median household income in Northwest Grayson, TX in 2022 was $69,544, which was 3.9% less than the median annual income of $72,284 across the entire state of Texas. Compared to the median income of $39,112 in 2000 this represents an increase of 43.8%. The per capita income in 2022 was $39,200, which means an increase of 48.9% compared to 2000 when it was $20,030.
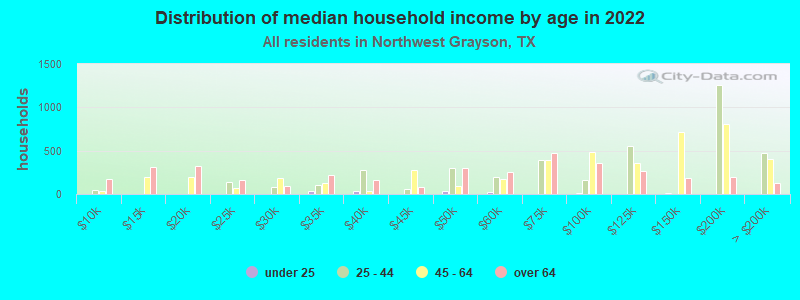
Income statistics for all residents
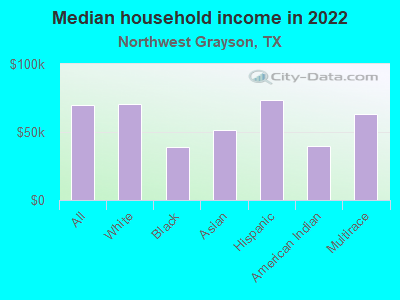
Median household income in Northwest Grayson, TX in 2022:| Northwest Grayson: | $69,545 |
| State: | $72,284 |
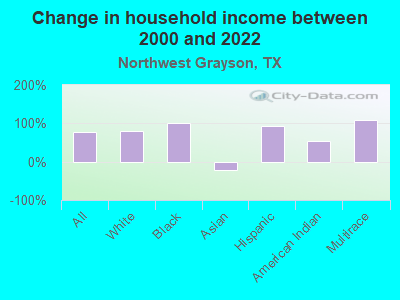
Change in median household income between 2000 and 2022:| Northwest Grayson, Texas: | +77.8% |
| State: | +81.0% |
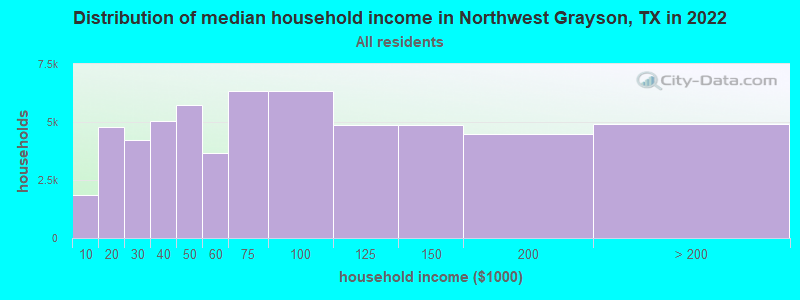
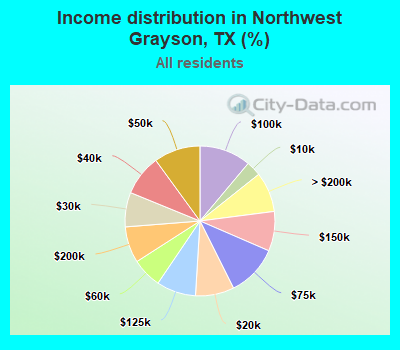
Number of households with income < $10k:| Northwest Grayson: | 3.2% (1,844) |
| Texas: | 5.5% (611,011) |
Number of households with income $10k - 20k:| Northwest Grayson: | 8.3% (4,770) |
| State: | 6.7% (743,157) |
Number of households with income $20k - 30k:| Northwest Grayson: | 7.4% (4,244) |
| State: | 7.2% (803,381) |
Number of households with income $30k - 40k:| Northwest Grayson: | 8.8% (5,033) |
| Texas: | 7.8% (866,080) |
Number of households with income $40k - 50k:| Northwest Grayson: | 10.0% (5,722) |
| State: | 7.3% (810,440) |
Number of households with income $50k - 60k:| Northwest Grayson: | 6.4% (3,681) |
| State: | 7.2% (799,783) |
Number of households with income $60k - 75k:| Northwest Grayson: | 11.1% (6,354) |
| Texas: | 9.9% (1,095,384) |
Number of households with income $75k - 100k:| Northwest Grayson: | 11.1% (6,342) |
| Texas: | 12.8% (1,419,057) |
Number of households with income $100k - 125k:| Northwest Grayson: | 8.5% (4,853) |
| State: | 9.5% (1,054,577) |
Number of households with income $125k - 150k:| Northwest Grayson: | 8.6% (4,887) |
| Texas: | 6.7% (741,518) |
Number of households with income $150k - 200k:| Northwest Grayson: | 7.8% (4,474) |
| Texas: | 8.7% (961,776) |
Number of households with income > $200k:| Northwest Grayson: | 8.6% (4,931) |
| State: | 10.7% (1,181,544) |
Aggregate household income in Northwest Grayson in 2022: $1,080,272,306
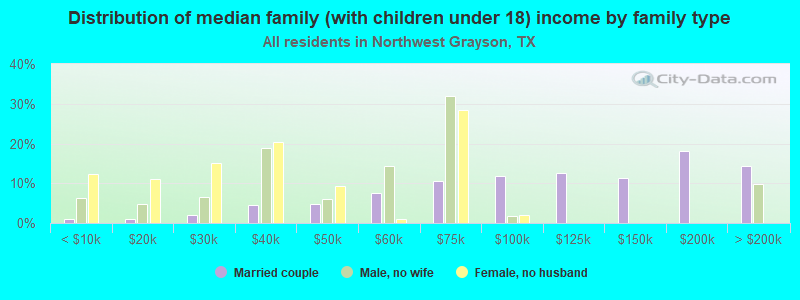
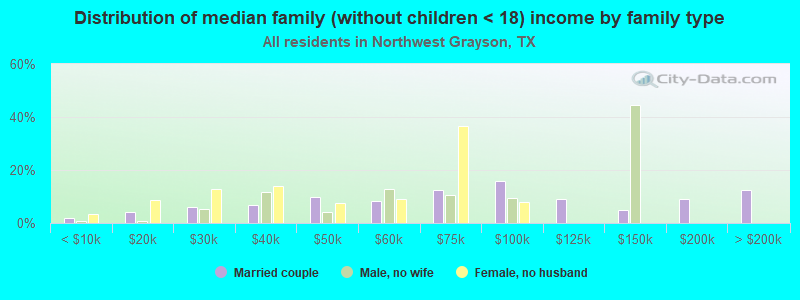
Median family income in Northwest Grayson in 2022:| Northwest Grayson: | $89,502 |
| State: | $86,267 |
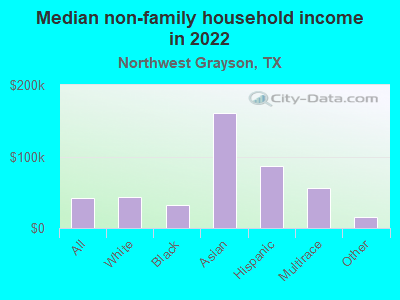
Median non-family income in Northwest Grayson in 2022:| Northwest Grayson: | $41,297 |
| Texas: | $45,999 |
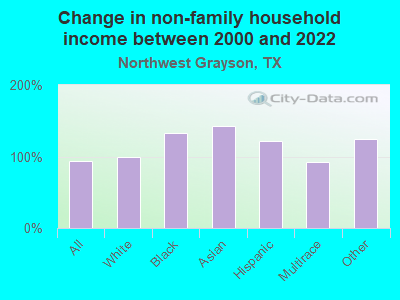
Change in median non-family income between 2000 and 2022:| Northwest Grayson, Texas: | +93.8% |
| State: | +79.5% |
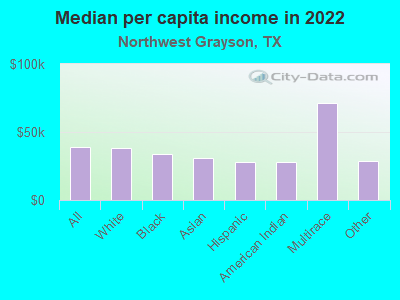
Median per capita income in Northwest Grayson in 2022:| Northwest Grayson: | $39,201 |
| State: | $38,123 |
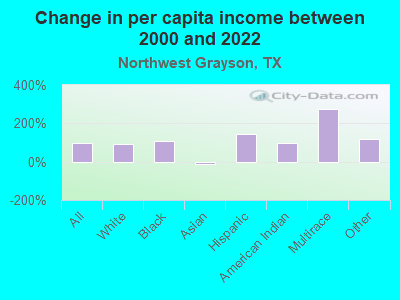
Change in median per capita income between 2000 and 2022:| Northwest Grayson, Texas: | +95.7% |
| State: | +94.3% |
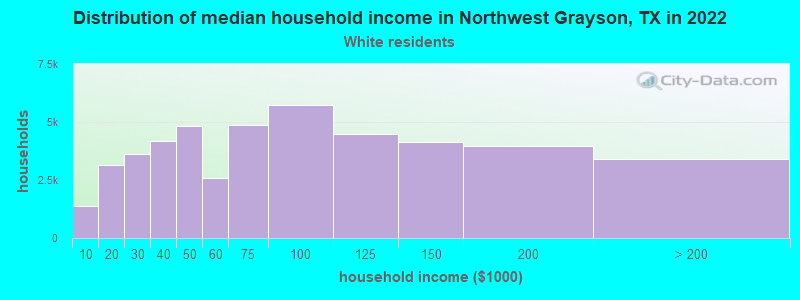
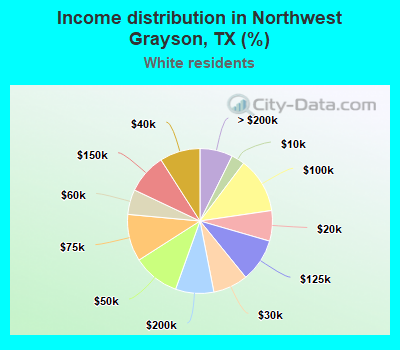
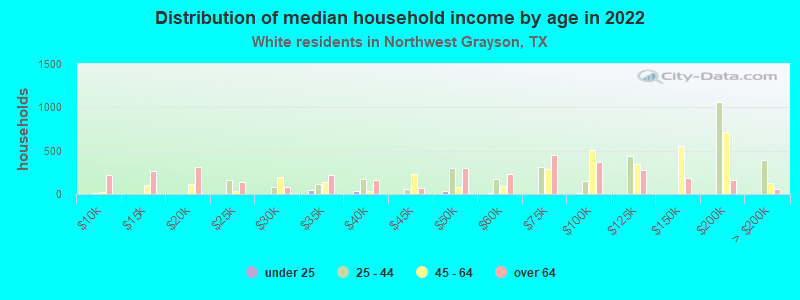
Income statistics for White residents
Median household income in Northwest Grayson, TX in 2022:| Northwest Grayson: | $70,813 |
| State: | $82,032 |
Change in median household income between 2000 and 2022:| Northwest Grayson, Texas: | +79.8% |
| State: | +91.0% |
Number of households with income < $10k:| Northwest Grayson: | 3.0% (1,377) |
| State: | 4.7% (273,716) |
Number of households with income $10k - 20k:| Northwest Grayson: | 6.8% (3,150) |
| State: | 5.5% (322,702) |
Number of households with income $20k - 30k:| Northwest Grayson: | 7.8% (3,603) |
| State: | 6.2% (363,947) |
Number of households with income $30k - 40k:| Northwest Grayson: | 9.0% (4,180) |
| Texas: | 6.8% (399,275) |
Number of households with income $40k - 50k:| Northwest Grayson: | 10.5% (4,849) |
| Texas: | 6.5% (383,417) |
Number of households with income $50k - 60k:| Northwest Grayson: | 5.6% (2,577) |
| State: | 6.6% (388,535) |
Number of households with income $60k - 75k:| Northwest Grayson: | 10.5% (4,873) |
| State: | 9.7% (566,295) |
Number of households with income $75k - 100k:| Northwest Grayson: | 12.4% (5,736) |
| State: | 13.0% (760,276) |
Number of households with income $100k - 125k:| Northwest Grayson: | 9.7% (4,477) |
| State: | 10.2% (597,596) |
Number of households with income $125k - 150k:| Northwest Grayson: | 8.9% (4,138) |
| State: | 7.4% (436,830) |
Number of households with income $150k - 200k:| Northwest Grayson: | 8.5% (3,954) |
| Texas: | 9.9% (583,067) |
Number of households with income > $200k:| Northwest Grayson: | 7.3% (3,391) |
| State: | 13.5% (792,647) |
Aggregate household income in Northwest Grayson in 2022: $916,119,006
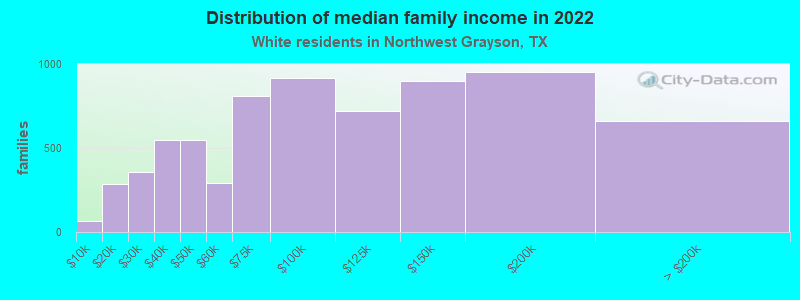
Median family income in Northwest Grayson in 2022:| Northwest Grayson: | $91,890 |
| Texas: | $101,788 |
Number of families with income < $10k:| Northwest Grayson: | 0.9% (63) |
| Texas: | 2.8% (108,142) |
Number of families with income $10k - 20k:| Northwest Grayson: | 4.0% (285) |
| Texas: | 2.9% (113,421) |
Number of families with income $20k - 30k:| Northwest Grayson: | 5.1% (356) |
| State: | 4.1% (157,688) |
Number of families with income $30k - 40k:| Northwest Grayson: | 7.7% (545) |
| State: | 5.2% (198,847) |
Number of families with income $40k - 50k:| Northwest Grayson: | 7.8% (545) |
| Texas: | 5.6% (216,490) |
Number of families with income $50k - 60k:| Northwest Grayson: | 4.2% (293) |
| Texas: | 5.7% (220,689) |
Number of families with income $60k - 75k:| Northwest Grayson: | 11.5% (809) |
| Texas: | 9.0% (346,106) |
Number of families with income $75k - 100k:| Northwest Grayson: | 13.0% (915) |
| State: | 13.7% (527,363) |
Number of families with income $100k - 125k:| Northwest Grayson: | 10.2% (721) |
| Texas: | 11.6% (448,411) |
Number of families with income $125k - 150k:| Northwest Grayson: | 12.7% (896) |
| State: | 9.2% (355,798) |
Number of families with income $150k - 200k:| Northwest Grayson: | 13.5% (951) |
| Texas: | 12.5% (480,185) |
Number of families with income > $200k:| Northwest Grayson: | 9.4% (660) |
| Texas: | 17.6% (677,490) |
Median non-family income in Northwest Grayson in 2022:| Northwest Grayson: | $42,798 |
| Texas: | $50,587 |
Change in median non-family income between 2000 and 2022:| Northwest Grayson, Texas: | +99.6% |
| State: | +87.7% |
Median per capita income in Northwest Grayson in 2022:| Northwest Grayson: | $38,457 |
| Texas: | $47,740 |
Change in median per capita income between 2000 and 2022:| Northwest Grayson, Texas: | +91.1% |
| State: | +114.3% |
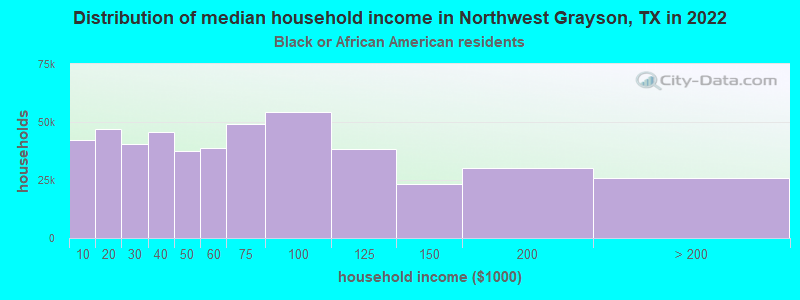
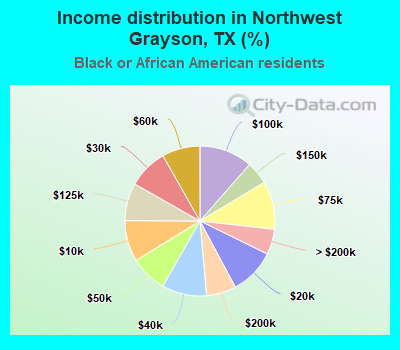
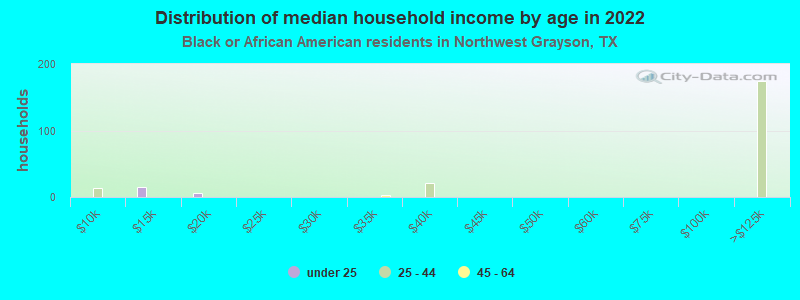
Income statistics for Black or African American residents
Median household income in Northwest Grayson, TX in 2022:| Northwest Grayson: | $39,152 |
| Texas: | $55,759 |
Change in median household income between 2000 and 2022:| Northwest Grayson, Texas: | +99.9% |
| State: | +90.3% |
Number of households with income < $10k:| Northwest Grayson: | 8.9% (42,071) |
| Texas: | 8.9% (126,378) |
Number of households with income $10k - 20k:| Northwest Grayson: | 9.9% (47,036) |
| State: | 9.9% (140,369) |
Number of households with income $20k - 30k:| Northwest Grayson: | 8.5% (40,467) |
| Texas: | 8.5% (120,639) |
Number of households with income $30k - 40k:| Northwest Grayson: | 9.7% (45,752) |
| State: | 9.7% (137,517) |
Number of households with income $40k - 50k:| Northwest Grayson: | 7.9% (37,586) |
| State: | 8.0% (112,973) |
Number of households with income $50k - 60k:| Northwest Grayson: | 8.2% (38,946) |
| Texas: | 8.3% (117,156) |
Number of households with income $60k - 75k:| Northwest Grayson: | 10.4% (49,164) |
| Texas: | 10.4% (147,462) |
Number of households with income $75k - 100k:| Northwest Grayson: | 11.5% (54,285) |
| Texas: | 11.5% (162,718) |
Number of households with income $100k - 125k:| Northwest Grayson: | 8.1% (38,543) |
| State: | 8.2% (115,829) |
Number of households with income $125k - 150k:| Northwest Grayson: | 4.9% (23,356) |
| State: | 4.9% (69,556) |
Number of households with income $150k - 200k:| Northwest Grayson: | 6.4% (30,250) |
| Texas: | 6.4% (90,701) |
Number of households with income > $200k:| Northwest Grayson: | 5.5% (25,989) |
| State: | 5.5% (77,988) |
Aggregate household income in Northwest Grayson in 2022: $5,031,071
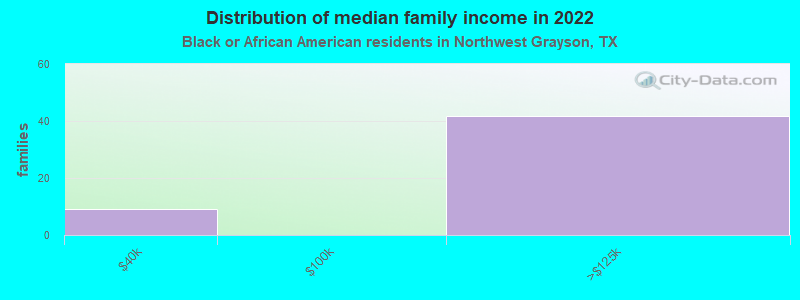
Median family income in Northwest Grayson in 2022:| Northwest Grayson: | $77,216 |
| State: | $69,134 |
Number of families with income $30k - 40k:| Northwest Grayson: | 18.0% (9) |
| State: | 8.5% (68,776) |
Number of families with income $100k - 125k:| Northwest Grayson: | 82.0% (42) |
| State: | 9.4% (76,609) |
Median non-family income in Northwest Grayson in 2022:| Northwest Grayson: | $32,690 |
| State: | $40,133 |
Change in median non-family income between 2000 and 2022:| Northwest Grayson, Texas: | +133.0% |
| Texas: | +102.2% |
Median per capita income in Northwest Grayson in 2022:| Northwest Grayson: | $33,610 |
| State: | $30,490 |
Change in median per capita income between 2000 and 2022:| Northwest Grayson, Texas: | +108.2% |
| State: | +113.9% |
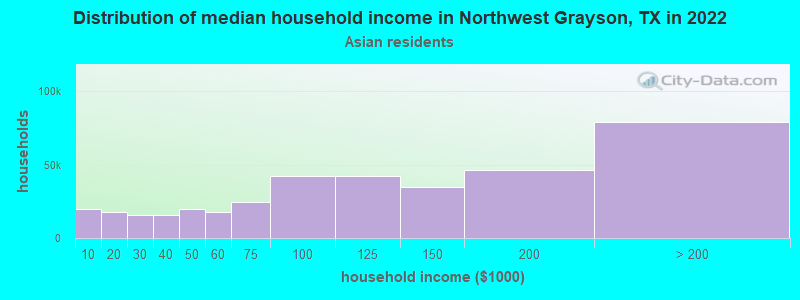
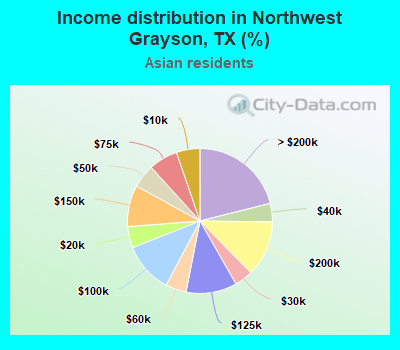
Income statistics for Asian residents
Median household income in Northwest Grayson, TX in 2022:| Northwest Grayson: | $51,172 |
| State: | $107,673 |
Number of households with income < $10k:| Northwest Grayson: | 5.3% (19,639) |
| State: | 5.2% (29,885) |
Number of households with income $10k - 20k:| Northwest Grayson: | 4.8% (17,770) |
| State: | 4.7% (27,044) |
Number of households with income $20k - 30k:| Northwest Grayson: | 4.1% (15,315) |
| State: | 4.1% (23,363) |
Number of households with income $30k - 40k:| Northwest Grayson: | 4.1% (15,311) |
| State: | 4.1% (23,309) |
Number of households with income $40k - 50k:| Northwest Grayson: | 5.2% (19,573) |
| State: | 5.2% (29,826) |
Number of households with income $50k - 60k:| Northwest Grayson: | 4.6% (17,362) |
| State: | 4.7% (26,512) |
Number of households with income $60k - 75k:| Northwest Grayson: | 6.5% (24,249) |
| State: | 6.5% (36,905) |
Number of households with income $75k - 100k:| Northwest Grayson: | 11.3% (42,166) |
| Texas: | 11.3% (64,350) |
Number of households with income $100k - 125k:| Northwest Grayson: | 11.3% (42,435) |
| State: | 11.4% (64,714) |
Number of households with income $125k - 150k:| Northwest Grayson: | 9.3% (34,595) |
| Texas: | 9.3% (52,719) |
Number of households with income $150k - 200k:| Northwest Grayson: | 12.5% (46,568) |
| State: | 12.5% (70,953) |
Number of households with income > $200k:| Northwest Grayson: | 21.1% (78,924) |
| State: | 21.1% (120,260) |
Aggregate household income in Northwest Grayson in 2022: $18,846,791
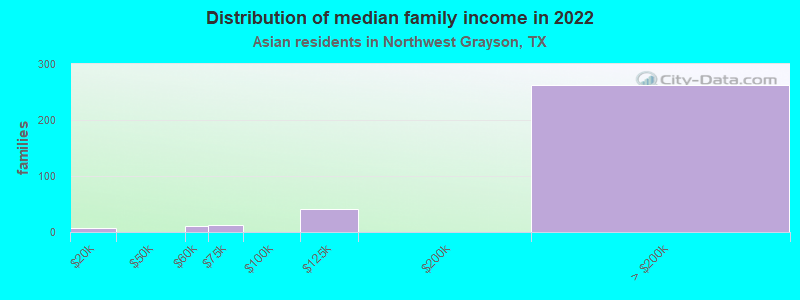
Median family income in Northwest Grayson in 2022:| Northwest Grayson: | $46,935 |
| State: | $123,328 |
Number of families with income $10k - 20k:| Northwest Grayson: | 2.5% (8) |
| State: | 3.0% (13,043) |
Number of families with income $50k - 60k:| Northwest Grayson: | 3.2% (11) |
| State: | 4.7% (20,568) |
Number of families with income $60k - 75k:| Northwest Grayson: | 4.0% (13) |
| State: | 6.1% (26,637) |
Number of families with income $100k - 125k:| Northwest Grayson: | 12.1% (41) |
| State: | 11.3% (49,585) |
Number of families with income > $200k:| Northwest Grayson: | 78.2% (263) |
| State: | 24.8% (108,511) |
Median non-family income in Northwest Grayson in 2022:| Northwest Grayson: | $160,153 |
| State: | $64,320 |
Change in median non-family income between 2000 and 2022:| Northwest Grayson, Texas: | +142.8% |
| State: | +131.1% |
Median per capita income in Northwest Grayson in 2022:| Northwest Grayson: | $30,926 |
| State: | $48,626 |
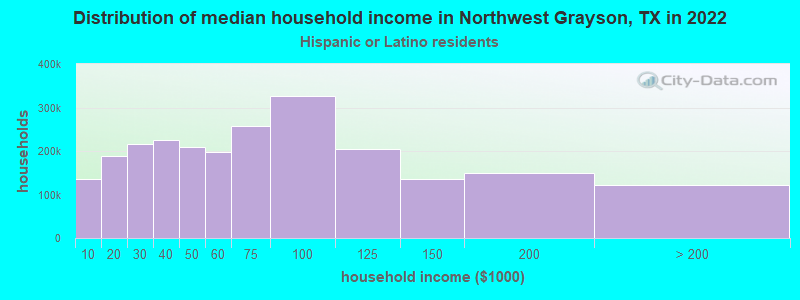
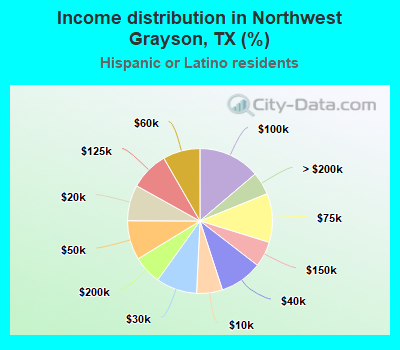
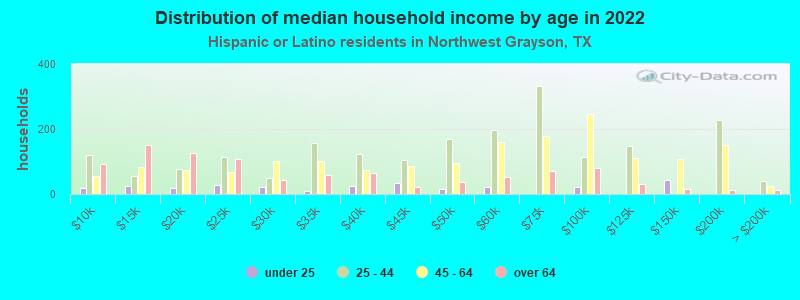
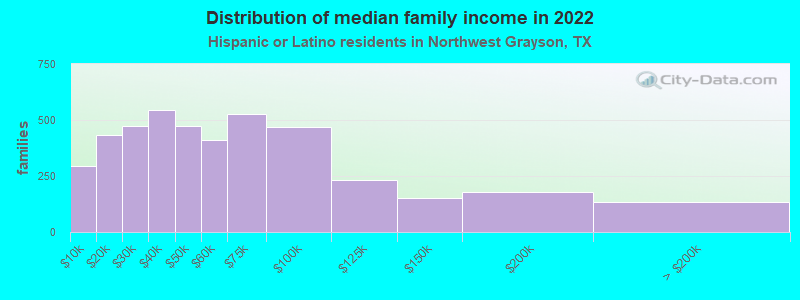
Income statistics for Hispanic or Latino residents
Median household income in Northwest Grayson, TX in 2022:| Northwest Grayson: | $73,326 |
| State: | $60,504 |
Change in median household income between 2000 and 2022:| Northwest Grayson, Texas: | +92.8% |
| Texas: | +102.5% |
Number of households with income < $10k:| Northwest Grayson: | 5.8% (136,359) |
| State: | 5.8% (213,953) |
Number of households with income $10k - 20k:| Northwest Grayson: | 8.0% (189,644) |
| Texas: | 8.0% (297,456) |
Number of households with income $20k - 30k:| Northwest Grayson: | 9.2% (216,681) |
| State: | 9.2% (340,166) |
Number of households with income $30k - 40k:| Northwest Grayson: | 9.5% (225,911) |
| State: | 9.5% (354,336) |
Number of households with income $40k - 50k:| Northwest Grayson: | 8.8% (208,350) |
| Texas: | 8.8% (327,013) |
Number of households with income $50k - 60k:| Northwest Grayson: | 8.3% (196,642) |
| State: | 8.3% (308,818) |
Number of households with income $60k - 75k:| Northwest Grayson: | 10.9% (258,183) |
| State: | 10.9% (405,109) |
Number of households with income $75k - 100k:| Northwest Grayson: | 13.8% (326,221) |
| State: | 13.8% (511,639) |
Number of households with income $100k - 125k:| Northwest Grayson: | 8.6% (203,873) |
| State: | 8.6% (319,728) |
Number of households with income $125k - 150k:| Northwest Grayson: | 5.7% (134,616) |
| State: | 5.7% (210,932) |
Number of households with income $150k - 200k:| Northwest Grayson: | 6.4% (150,341) |
| Texas: | 6.4% (236,055) |
Number of households with income > $200k:| Northwest Grayson: | 5.1% (120,703) |
| Texas: | 5.1% (189,259) |
Aggregate household income in Northwest Grayson in 2022: $34,222,620
Median family income in Northwest Grayson in 2022:| Northwest Grayson: | $54,466 |
| State: | $65,080 |
Number of families with income < $10k:| Northwest Grayson: | 6.8% (293) |
| Texas: | 5.3% (147,493) |
Number of families with income $10k - 20k:| Northwest Grayson: | 10.0% (431) |
| Texas: | 6.3% (174,531) |
Number of families with income $20k - 30k:| Northwest Grayson: | 11.0% (474) |
| State: | 8.6% (238,528) |
Number of families with income $30k - 40k:| Northwest Grayson: | 12.6% (546) |
| State: | 9.1% (251,999) |
Number of families with income $40k - 50k:| Northwest Grayson: | 11.0% (475) |
| Texas: | 8.6% (240,188) |
Number of families with income $50k - 60k:| Northwest Grayson: | 9.5% (410) |
| State: | 8.0% (223,566) |
Number of families with income $60k - 75k:| Northwest Grayson: | 12.2% (527) |
| State: | 10.9% (302,688) |
Number of families with income $75k - 100k:| Northwest Grayson: | 10.9% (470) |
| State: | 14.3% (398,554) |
Number of families with income $100k - 125k:| Northwest Grayson: | 5.3% (230) |
| State: | 9.5% (264,007) |
Number of families with income $125k - 150k:| Northwest Grayson: | 3.5% (153) |
| State: | 6.2% (171,274) |
Number of families with income $150k - 200k:| Northwest Grayson: | 4.1% (177) |
| Texas: | 7.3% (202,259) |
Number of families with income > $200k:| Northwest Grayson: | 3.1% (133) |
| State: | 5.9% (165,129) |
Median non-family income in Northwest Grayson in 2022:| Northwest Grayson: | $86,749 |
| State: | $39,934 |
Change in median non-family income between 2000 and 2022:| Northwest Grayson, Texas: | +120.8% |
| State: | +109.1% |
Median per capita income in Northwest Grayson in 2022:| Northwest Grayson: | $27,916 |
| State: | $24,862 |
Change in median per capita income between 2000 and 2022:| Northwest Grayson, Texas: | +146.2% |
| State: | +130.8% |
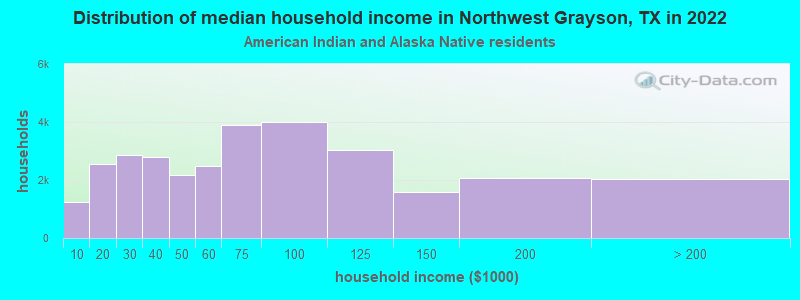
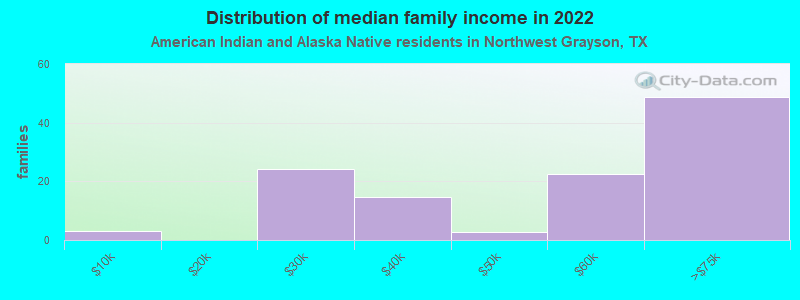
Income statistics for American Indian and Alaska Native residents
Median household income in Northwest Grayson, TX in 2022:| Northwest Grayson: | $39,736 |
| State: | $65,765 |
Change in median household income between 2000 and 2022:| Northwest Grayson, Texas: | +55.1% |
| State: | +88.3% |
Number of households with income < $10k:| Northwest Grayson: | 4.1% (1,249) |
| State: | 4.1% (3,398) |
Number of households with income $10k - 20k:| Northwest Grayson: | 8.3% (2,553) |
| State: | 8.3% (6,949) |
Number of households with income $20k - 30k:| Northwest Grayson: | 9.3% (2,845) |
| State: | 9.3% (7,742) |
Number of households with income $30k - 40k:| Northwest Grayson: | 9.1% (2,799) |
| Texas: | 9.1% (7,627) |
Number of households with income $40k - 50k:| Northwest Grayson: | 7.1% (2,178) |
| State: | 7.1% (5,922) |
Number of households with income $50k - 60k:| Northwest Grayson: | 8.1% (2,485) |
| Texas: | 8.1% (6,761) |
Number of households with income $60k - 75k:| Northwest Grayson: | 12.7% (3,889) |
| State: | 12.7% (10,588) |
Number of households with income $75k - 100k:| Northwest Grayson: | 13.0% (4,008) |
| State: | 13.0% (10,903) |
Number of households with income $100k - 125k:| Northwest Grayson: | 9.9% (3,034) |
| State: | 9.9% (8,256) |
Number of households with income $125k - 150k:| Northwest Grayson: | 5.2% (1,599) |
| State: | 5.2% (4,355) |
Number of households with income $150k - 200k:| Northwest Grayson: | 6.7% (2,064) |
| Texas: | 6.7% (5,623) |
Number of households with income > $200k:| Northwest Grayson: | 6.6% (2,027) |
| State: | 6.6% (5,522) |
Aggregate household income in Northwest Grayson in 2022: $2,501,146
Median family income in Northwest Grayson in 2022:| Northwest Grayson: | $72,155 |
| State: | $72,369 |
Number of families with income < $10k:| Northwest Grayson: | 2.8% (3) |
| State: | 2.7% (1,671) |
Number of families with income $20k - 30k:| Northwest Grayson: | 20.8% (24) |
| Texas: | 7.3% (4,502) |
Number of families with income $30k - 40k:| Northwest Grayson: | 12.7% (15) |
| State: | 7.5% (4,592) |
Number of families with income $40k - 50k:| Northwest Grayson: | 2.2% (3) |
| Texas: | 7.9% (4,855) |
Number of families with income $50k - 60k:| Northwest Grayson: | 19.3% (22) |
| State: | 7.1% (4,347) |
Number of families with income $60k - 75k:| Northwest Grayson: | 42.2% (49) |
| State: | 12.1% (7,429) |
Median per capita income in Northwest Grayson in 2022:| Northwest Grayson: | $28,132 |
| State: | $28,166 |
Change in median per capita income between 2000 and 2022:| Northwest Grayson, Texas: | +95.5% |
| State: | +77.2% |
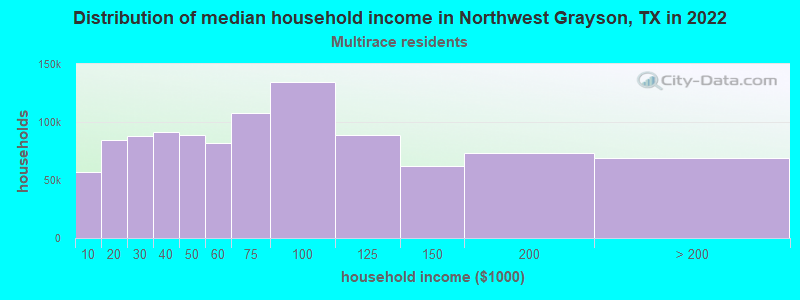
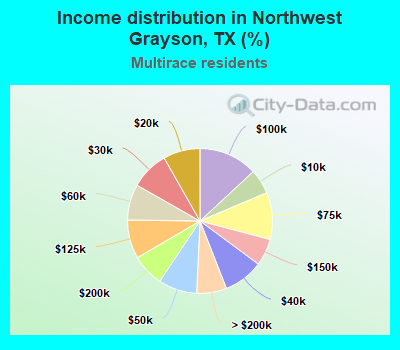
Income statistics for Multirace residents
Median household income in Northwest Grayson, TX in 2022:| Northwest Grayson: | $63,063 |
| State: | $62,748 |
Change in median household income between 2000 and 2022:| Northwest Grayson, Texas: | +108.5% |
| Texas: | +92.3% |
Number of households with income < $10k:| Northwest Grayson: | 5.5% (56,644) |
| State: | 5.5% (122,324) |
Number of households with income $10k - 20k:| Northwest Grayson: | 8.2% (84,387) |
| Texas: | 8.2% (182,232) |
Number of households with income $20k - 30k:| Northwest Grayson: | 8.5% (87,640) |
| State: | 8.5% (189,456) |
Number of households with income $30k - 40k:| Northwest Grayson: | 8.9% (91,431) |
| State: | 8.9% (197,499) |
Number of households with income $40k - 50k:| Northwest Grayson: | 8.7% (88,810) |
| State: | 8.7% (191,735) |
Number of households with income $50k - 60k:| Northwest Grayson: | 8.0% (82,142) |
| Texas: | 8.0% (177,535) |
Number of households with income $60k - 75k:| Northwest Grayson: | 10.5% (107,664) |
| State: | 10.5% (232,479) |
Number of households with income $75k - 100k:| Northwest Grayson: | 13.1% (134,466) |
| State: | 13.1% (290,448) |
Number of households with income $100k - 125k:| Northwest Grayson: | 8.6% (88,740) |
| Texas: | 8.6% (191,595) |
Number of households with income $125k - 150k:| Northwest Grayson: | 6.0% (61,810) |
| State: | 6.0% (133,361) |
Number of households with income $150k - 200k:| Northwest Grayson: | 7.2% (73,619) |
| State: | 7.2% (159,195) |
Number of households with income > $200k:| Northwest Grayson: | 6.7% (68,544) |
| State: | 6.7% (148,064) |
Aggregate household income in Northwest Grayson in 2022: $74,272,586
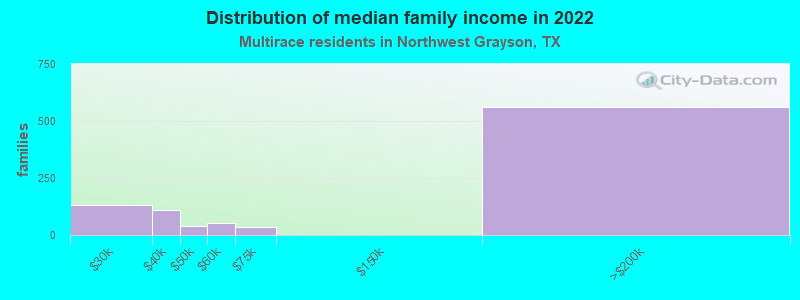
Median family income in Northwest Grayson in 2022:| Northwest Grayson: | $78,487 |
| State: | $69,780 |
Number of families with income $20k - 30k:| Northwest Grayson: | 14.0% (131) |
| State: | 7.8% (126,627) |
Number of families with income $30k - 40k:| Northwest Grayson: | 11.8% (110) |
| State: | 8.5% (137,626) |
Number of families with income $40k - 50k:| Northwest Grayson: | 4.4% (41) |
| Texas: | 8.4% (135,809) |
Number of families with income $50k - 60k:| Northwest Grayson: | 5.7% (54) |
| Texas: | 7.9% (127,739) |
Number of families with income $60k - 75k:| Northwest Grayson: | 3.7% (35) |
| State: | 10.5% (169,549) |
Number of families with income $150k - 200k:| Northwest Grayson: | 60.3% (563) |
| State: | 8.5% (137,607) |
Median non-family income in Northwest Grayson in 2022:| Northwest Grayson: | $55,531 |
| Texas: | $40,634 |
Change in median non-family income between 2000 and 2022:| Northwest Grayson, Texas: | +93.2% |
| State: | +77.2% |
Median per capita income in Northwest Grayson in 2022:| Northwest Grayson: | $71,299 |
| Texas: | $26,785 |
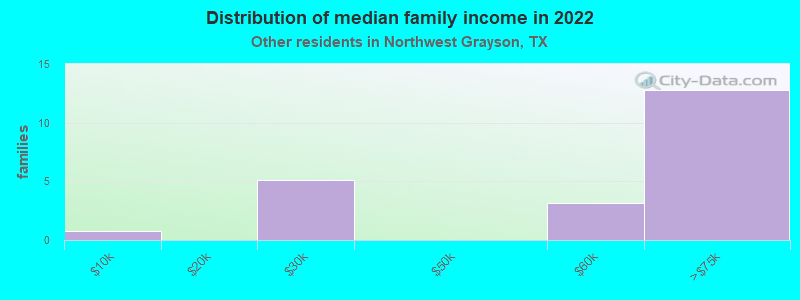
Income statistics for other residents
Number of households with income < $10k:| Northwest Grayson: | 6.1% (13) |
| State: | 5.9% (54,162) |
Number of households with income $10k - 20k:| Northwest Grayson: | 6.6% (14) |
| Texas: | 6.8% (62,891) |
Number of households with income $20k - 30k:| Northwest Grayson: | 10.3% (22) |
| State: | 10.6% (97,294) |
Number of households with income $30k - 40k:| Northwest Grayson: | 10.8% (23) |
| State: | 10.8% (99,670) |
Number of households with income $40k - 50k:| Northwest Grayson: | 9.4% (20) |
| Texas: | 9.3% (85,548) |
Number of households with income $50k - 60k:| Northwest Grayson: | 8.9% (19) |
| State: | 9.0% (82,757) |
Number of households with income $60k - 75k:| Northwest Grayson: | 10.8% (23) |
| Texas: | 10.9% (100,326) |
Number of households with income $75k - 100k:| Northwest Grayson: | 14.1% (30) |
| State: | 14.0% (128,767) |
Number of households with income $100k - 125k:| Northwest Grayson: | 8.5% (18) |
| State: | 8.2% (75,218) |
Number of households with income $125k - 150k:| Northwest Grayson: | 4.7% (10) |
| Texas: | 4.8% (44,223) |
Number of households with income $150k - 200k:| Northwest Grayson: | 5.6% (12) |
| State: | 5.6% (51,376) |
Number of households with income > $200k:| Northwest Grayson: | 4.2% (9) |
| State: | 4.0% (36,393) |
Aggregate household income in Northwest Grayson in 2022: $5,200,628
Median family income in Northwest Grayson in 2022:| Northwest Grayson: | $57,044 |
| State: | $60,064 |
Number of families with income < $10k:| Northwest Grayson: | 3.6% (1) |
| State: | 6.8% (47,502) |
Number of families with income $20k - 30k:| Northwest Grayson: | 23.6% (5) |
| Texas: | 9.9% (68,761) |
Number of families with income $50k - 60k:| Northwest Grayson: | 14.4% (3) |
| Texas: | 8.5% (59,321) |
Number of families with income $60k - 75k:| Northwest Grayson: | 58.5% (13) |
| Texas: | 11.2% (77,588) |
Median non-family income in Northwest Grayson in 2022:| Northwest Grayson: | $15,395 |
| State: | $38,690 |
Change in median non-family income between 2000 and 2022:| Northwest Grayson, Texas: | +123.9% |
| Texas: | +90.2% |
Median per capita income in Northwest Grayson in 2022:| Northwest Grayson: | $28,710 |
| Texas: | $23,899 |
Change in median per capita income between 2000 and 2022:| Northwest Grayson, Texas: | +119.7% |
| State: | +135.2% |