The median household income in Ocean City, MD in 2022 was $60,201, which was 57.8% less than the median annual income of $94,991 across the entire state of Maryland. Compared to the median income of $35,772 in 2000 this represents an increase of 40.6%. The per capita income in 2022 was $59,120, which means an increase of 55.9% compared to 2000 when it was $26,078.
Whole page based on the data from 2000 / 2022 when the population of Ocean City, Maryland was 7,173 / 6,882
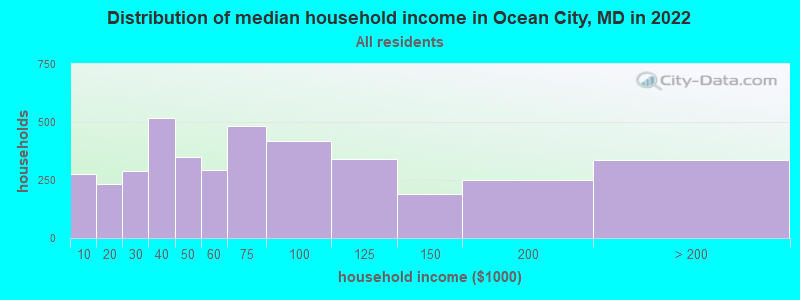
Income statistics for all residents
Median household income in Ocean City, MD in 2022:
Ocean City:
$60,202
State:
$94,991
Change in median household income between 2000 and 2022:
Ocean City, Maryland:
+68.3%
State:
+79.7%
Number of households with income < $10k:
Ocean City:
7.0% (277)
State:
4.8% (114,450)
Number of households with income $10k - 20k:
Ocean City:
5.9% (234)
Maryland:
5.0% (117,883)
Number of households with income $20k - 30k:
Ocean City:
7.2% (288)
State:
5.2% (123,350)
Number of households with income $30k - 40k:
Ocean City:
13.0% (518)
State:
5.6% (134,104)
Number of households with income $40k - 50k:
Ocean City:
8.8% (351)
Maryland:
5.6% (132,932)
Number of households with income $50k - 60k:
Ocean City:
7.4% (294)
State:
5.6% (132,707)
Number of households with income $60k - 75k:
Ocean City:
12.1% (483)
State:
7.9% (188,335)
Number of households with income $75k - 100k:
Ocean City:
10.5% (418)
Maryland:
12.5% (297,873)
Number of households with income $100k - 125k:
Ocean City:
8.6% (341)
State:
10.5% (250,497)
Number of households with income $125k - 150k:
Ocean City:
4.8% (190)
State:
8.1% (193,208)
Number of households with income $150k - 200k:
Ocean City:
6.3% (252)
State:
11.6% (274,905)
Number of households with income > $200k:
Ocean City:
8.4% (336)
State:
17.5% (415,740)
Aggregate household income in Ocean City in 2022: $401,070,072
Median family income in Ocean City in 2022:
Ocean City:
$86,283
State:
$117,294
Number of families with income < $10k:
Ocean City:
1.5% (28)
State:
2.7% (41,433)
Number of families with income $10k - 20k:
Ocean City:
0.5% (9)
State:
2.6% (40,126)
Number of families with income $20k - 30k:
Ocean City:
2.6% (51)
State:
3.4% (52,891)
Number of families with income $30k - 40k:
Ocean City:
14.7% (281)
State:
4.5% (70,252)
Number of families with income $40k - 50k:
Ocean City:
5.5% (106)
Maryland:
4.8% (74,112)
Number of families with income $50k - 60k:
Ocean City:
7.6% (146)
State:
5.0% (77,590)
Number of families with income $60k - 75k:
Ocean City:
11.9% (229)
Maryland:
7.1% (109,924)
Number of families with income $75k - 100k:
Ocean City:
13.0% (248)
State:
12.0% (185,255)
Number of families with income $100k - 125k:
Ocean City:
12.3% (235)
State:
11.2% (173,203)
Number of families with income $125k - 150k:
Ocean City:
6.2% (120)
State:
9.3% (143,453)
Number of families with income $150k - 200k:
Ocean City:
8.8% (170)
State:
14.2% (218,861)
Number of families with income > $200k:
Ocean City:
15.3% (294)
State:
23.2% (359,182)
Median non-family income in Ocean City in 2022:
Ocean City:
$42,774
State:
$57,179
Change in median non-family income between 2000 and 2022:
Ocean City, Maryland:
+52.7%
State:
+75.1%
Median per capita income in Ocean City in 2022:
Ocean City:
$59,121
State:
$49,236
Change in median per capita income between 2000 and 2022:
Ocean City, Maryland:
+126.7%
State:
+92.2%
Income statistics for White residents
Median household income in Ocean City, MD in 2022:
Ocean City:
$63,996
State:
$107,160
Change in median household income between 2000 and 2022:
Ocean City, Maryland:
+78.2%
State:
+85.3%
Number of households with income < $10k:
Ocean City:
7.2% (255)
State:
3.7% (47,387)
Number of households with income $10k - 20k:
Ocean City:
6.4% (227)
Maryland:
4.1% (52,102)
Number of households with income $20k - 30k:
Ocean City:
6.9% (242)
State:
4.6% (58,758)
Number of households with income $30k - 40k:
Ocean City:
8.7% (307)
State:
4.7% (59,745)
Number of households with income $40k - 50k:
Ocean City:
9.3% (328)
Maryland:
5.0% (62,576)
Number of households with income $50k - 60k:
Ocean City:
7.9% (277)
State:
5.1% (64,484)
Number of households with income $60k - 75k:
Ocean City:
13.5% (476)
Maryland:
7.7% (97,019)
Number of households with income $75k - 100k:
Ocean City:
10.8% (382)
Maryland:
11.8% (149,205)
Number of households with income $100k - 125k:
Ocean City:
9.3% (327)
Maryland:
10.6% (134,231)
Number of households with income $125k - 150k:
Ocean City:
5.3% (185)
Maryland:
8.8% (111,081)
Number of households with income $150k - 200k:
Ocean City:
6.0% (213)
State:
12.9% (162,966)
Number of households with income > $200k:
Ocean City:
8.6% (304)
State:
20.9% (264,377)
Aggregate household income in Ocean City in 2022: $367,588,877
Median family income in Ocean City in 2022:
Ocean City:
$96,446
State:
$134,708
Number of families with income < $10k:
Ocean City:
1.5% (25)
State:
1.6% (13,064)
Number of families with income $10k - 20k:
Ocean City:
0.6% (9)
Maryland:
2.0% (16,048)
Number of families with income $20k - 30k:
Ocean City:
2.5% (41)
Maryland:
2.2% (18,018)
Number of families with income $30k - 40k:
Ocean City:
7.3% (119)
Maryland:
3.3% (26,886)
Number of families with income $40k - 50k:
Ocean City:
5.7% (92)
State:
3.6% (29,194)
Number of families with income $50k - 60k:
Ocean City:
7.3% (119)
State:
4.1% (33,120)
Number of families with income $60k - 75k:
Ocean City:
13.6% (221)
State:
6.6% (53,501)
Number of families with income $75k - 100k:
Ocean City:
14.5% (235)
State:
11.3% (91,779)
Number of families with income $100k - 125k:
Ocean City:
13.7% (222)
Maryland:
11.3% (91,483)
Number of families with income $125k - 150k:
Ocean City:
7.1% (115)
Maryland:
9.9% (80,832)
Number of families with income $150k - 200k:
Ocean City:
10.1% (164)
State:
16.0% (130,295)
Number of families with income > $200k:
Ocean City:
16.2% (264)
State:
28.1% (228,324)
Median non-family income in Ocean City in 2022:
Ocean City:
$44,219
Maryland:
$61,991
Change in median non-family income between 2000 and 2022:
Ocean City, Maryland:
+57.2%
State:
+76.8%
Median per capita income in Ocean City in 2022:
Ocean City:
$63,113
Maryland:
$59,750
Change in median per capita income between 2000 and 2022:
Ocean City, Maryland:
+136.8%
Maryland:
+104.5%
Income statistics for Black or African American residents
Aggregate household income in Ocean City in 2022: $4,326,541
Median per capita income in Ocean City in 2022:
Ocean City:
$28,033
Maryland:
$40,756
Change in median per capita income between 2000 and 2022:
Ocean City, Maryland:
+111.1%
Maryland:
+113.5%
Income statistics for Asian residents
Number of households with income < $10k:
Ocean City:
0.0% (0)
State:
4.6% (6,395)
Number of households with income $10k - 20k:
Ocean City:
0.0% (0)
State:
3.6% (4,994)
Number of households with income $20k - 30k:
Ocean City:
0.0% (0)
Maryland:
4.6% (6,399)
Number of households with income $30k - 40k:
Ocean City:
39.0% (16)
State:
3.4% (4,682)
Number of households with income $40k - 50k:
Ocean City:
0.0% (0)
State:
4.6% (6,382)
Number of households with income $50k - 60k:
Ocean City:
0.0% (0)
Maryland:
4.6% (6,402)
Number of households with income $60k - 75k:
Ocean City:
0.0% (0)
State:
5.4% (7,426)
Number of households with income $75k - 100k:
Ocean City:
0.0% (0)
Maryland:
11.1% (15,313)
Number of households with income $100k - 125k:
Ocean City:
0.0% (0)
State:
10.6% (14,640)
Number of households with income $125k - 150k:
Ocean City:
0.0% (0)
State:
8.3% (11,465)
Number of households with income $150k - 200k:
Ocean City:
61.0% (25)
State:
13.4% (18,490)
Number of households with income > $200k:
Ocean City:
0.0% (0)
State:
25.6% (35,377)
Aggregate household income in Ocean City in 2022: $6,467,696
Median per capita income in Ocean City in 2022:
Ocean City:
$73,918
Maryland:
$53,546
Income statistics for Hispanic or Latino residents
Median household income in Ocean City, MD in 2022:
Ocean City:
$30,242
State:
$82,138
Change in median household income between 2000 and 2022:: -40.1%
Ocean City, Maryland:
-40.1%
State:
+70.2%
Number of households with income < $10k:
Ocean City:
0.0% (0)
Maryland:
3.7% (6,871)
Number of households with income $10k - 20k:
Ocean City:
2.3% (7)
State:
2.9% (5,465)
Number of households with income $20k - 30k:
Ocean City:
0.0% (0)
Maryland:
5.9% (11,012)
Number of households with income $30k - 40k:
Ocean City:
66.1% (199)
Maryland:
7.9% (14,668)
Number of households with income $40k - 50k:
Ocean City:
3.7% (11)
Maryland:
7.6% (14,074)
Number of households with income $50k - 60k:
Ocean City:
4.3% (13)
State:
7.6% (14,166)
Number of households with income $60k - 75k:
Ocean City:
20.6% (62)
State:
9.9% (18,486)
Number of households with income $75k - 100k:
Ocean City:
0.0% (0)
Maryland:
16.1% (30,032)
Number of households with income $100k - 125k:
Ocean City:
0.0% (0)
State:
9.4% (17,432)
Number of households with income $125k - 150k:
Ocean City:
0.0% (0)
State:
7.5% (13,963)
Number of households with income $150k - 200k:
Ocean City:
3.0% (9)
Maryland:
10.1% (18,750)
Number of households with income > $200k:
Ocean City:
0.0% (0)
State:
11.4% (21,133)
Aggregate household income in Ocean City in 2022: $10,813,037
Median family income in Ocean City in 2022:
Ocean City:
$28,948
Maryland:
$80,127
Number of families with income $10k - 20k:
Ocean City:
3.1% (7)
Maryland:
2.2% (3,250)
Number of families with income $30k - 40k:
Ocean City:
69.2% (158)
Maryland:
7.6% (11,123)
Number of families with income $60k - 75k:
Ocean City:
27.8% (63)
State:
10.2% (15,051)
Median non-family income in Ocean City in 2022:
Ocean City:
$40,690
State:
$55,347
Change in median non-family income between 2000 and 2022:: -12.0%
Ocean City, Maryland:
-12.0%
State:
+61.9%
Median per capita income in Ocean City in 2022:
Ocean City:
$15,642
State:
$29,024
Change in median per capita income between 2000 and 2022:: -29.0%
Ocean City, Maryland:
-29.0%
State:
+79.2%
Income statistics for American Indian and Alaska Native residents
Median per capita income in Ocean City in 2022:
Ocean City:
$17,334
Maryland:
$35,089
Change in median per capita income between 2000 and 2022:
Ocean City, Maryland:
+45.6%
Maryland:
+56.2%
Income statistics for Multirace residents
Number of households with income < $10k:
Ocean City:
0.0% (0)
State:
4.8% (6,469)
Number of households with income $10k - 20k:
Ocean City:
0.0% (0)
State:
3.3% (4,464)
Number of households with income $20k - 30k:
Ocean City:
0.0% (0)
Maryland:
5.8% (7,826)
Number of households with income $30k - 40k:
Ocean City:
89.1% (139)
Maryland:
8.1% (11,077)
Number of households with income $40k - 50k:
Ocean City:
0.0% (0)
State:
4.3% (5,895)
Number of households with income $50k - 60k:
Ocean City:
0.0% (0)
State:
3.9% (5,346)
Number of households with income $60k - 75k:
Ocean City:
0.0% (0)
State:
6.7% (9,159)
Number of households with income $75k - 100k:
Ocean City:
10.9% (17)
Maryland:
13.6% (18,420)
Number of households with income $100k - 125k:
Ocean City:
0.0% (0)
State:
12.9% (17,488)
Number of households with income $125k - 150k:
Ocean City:
0.0% (0)
State:
8.1% (11,039)
Number of households with income $150k - 200k:
Ocean City:
0.0% (0)
State:
11.5% (15,675)
Number of households with income > $200k:
Ocean City:
0.0% (0)
State:
17.0% (23,059)
Aggregate household income in Ocean City in 2022: $21,415,994
Median per capita income in Ocean City in 2022:
Ocean City:
$13,342
Maryland:
$35,630
Change in median per capita income between 2000 and 2022:: -19.7%
Ocean City, Maryland:
-19.7%
State:
+125.1%
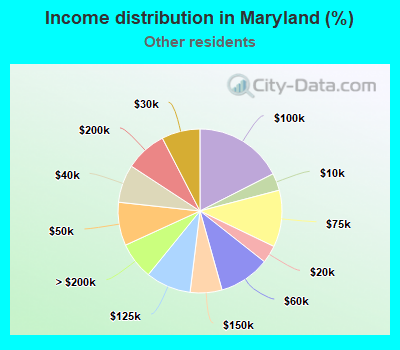
Income statistics for other residents
Median household income in Ocean City, MD in 2022:
Ocean City:
$29,026
State:
$72,980
Number of households with income < $10k:
Ocean City:
5.1% (10)
Maryland:
3.4% (3,746)
Number of households with income $10k - 20k:
Ocean City:
0.0% (0)
State:
3.5% (3,842)
Number of households with income $20k - 30k:
Ocean City:
22.7% (45)
State:
7.6% (8,343)
Number of households with income $30k - 40k:
Ocean City:
56.6% (112)
State:
7.5% (8,251)
Number of households with income $40k - 50k:
Ocean City:
0.0% (0)
State:
8.6% (9,414)
Number of households with income $50k - 60k:
Ocean City:
5.1% (10)
State:
10.0% (11,048)
Number of households with income $60k - 75k:
Ocean City:
0.0% (0)
State:
11.2% (12,339)
Number of households with income $75k - 100k:
Ocean City:
0.0% (0)
State:
17.5% (19,277)
Number of households with income $100k - 125k:
Ocean City:
0.0% (0)
State:
8.9% (9,813)
Number of households with income $125k - 150k:
Ocean City:
0.0% (0)
State:
6.3% (6,907)
Number of households with income $150k - 200k:
Ocean City:
0.0% (0)
State:
8.2% (9,023)
Number of households with income > $200k:
Ocean City:
10.6% (21)
State:
7.3% (8,036)
Aggregate household income in Ocean City in 2022: $9,471,302
Median family income in Ocean City in 2022:
Ocean City:
$28,724
State:
$69,179
Number of families with income $30k - 40k:
Ocean City:
71.8% (78)
State:
7.3% (6,474)
Number of families with income $50k - 60k:
Ocean City:
9.1% (10)
State:
11.3% (10,043)
Number of families with income > $200k:
Ocean City:
19.1% (21)
Maryland:
6.7% (6,005)
Median non-family income in Ocean City in 2022:
Ocean City:
$24,665
State:
$52,100
Change in median non-family income between 2000 and 2022:: -40.2%
Ocean City, Maryland:
-40.2%
State:
+64.2%
Median per capita income in Ocean City in 2022:
Ocean City:
$26,729
Maryland:
$24,415
Change in median per capita income between 2000 and 2022:
Ocean City, Maryland:
+146.7%
Maryland:
+73.6%
Discuss Ocean City, Maryland (MD) on our hugely popular Maryland forum.