Otter, Montana (MT) income map, earnings map, and wages data
The median household income in Otter, MT in 2022 was $55,650, which was 21.5% less than the median annual income of $67,631 across the entire state of Montana. Compared to the median income of $27,222 in 2000 this represents an increase of 51.1%. The per capita income in 2022 was $34,631, which means an increase of 55.3% compared to 2000 when it was $15,494.
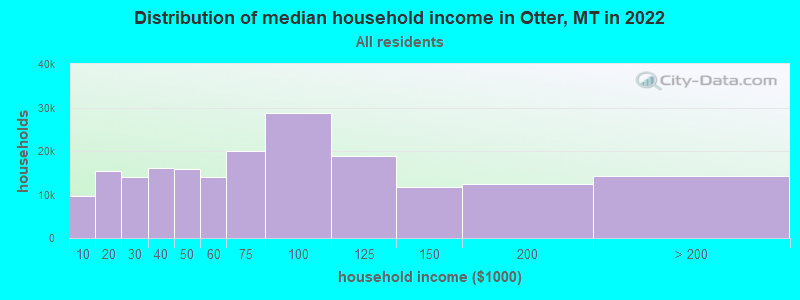
Income statistics for all residents
Median household income in Otter, MT in 2022:| Otter: | $55,650 |
| State: | $67,631 |
Change in median household income between 2000 and 2022:| Otter, Montana: | +104.4% |
| Montana: | +104.8% |
Number of households with income < $10k:| Otter: | 5.0% (9,556) |
| Montana: | 5.0% (23,231) |
Number of households with income $10k - 20k:| Otter: | 8.1% (15,460) |
| Montana: | 8.1% (37,478) |
Number of households with income $20k - 30k:| Otter: | 7.3% (14,026) |
| State: | 7.3% (33,880) |
Number of households with income $30k - 40k:| Otter: | 8.4% (16,006) |
| Montana: | 8.4% (38,912) |
Number of households with income $40k - 50k:| Otter: | 8.3% (15,864) |
| Montana: | 8.3% (38,441) |
Number of households with income $50k - 60k:| Otter: | 7.4% (14,052) |
| State: | 7.4% (34,172) |
Number of households with income $60k - 75k:| Otter: | 10.5% (20,094) |
| Montana: | 10.5% (48,783) |
Number of households with income $75k - 100k:| Otter: | 15.0% (28,683) |
| State: | 15.0% (69,571) |
Number of households with income $100k - 125k:| Otter: | 9.9% (18,918) |
| State: | 9.9% (45,889) |
Number of households with income $125k - 150k:| Otter: | 6.1% (11,721) |
| State: | 6.1% (28,538) |
Number of households with income $150k - 200k:| Otter: | 6.5% (12,491) |
| State: | 6.6% (30,552) |
Number of households with income > $200k:| Otter: | 7.4% (14,209) |
| Montana: | 7.5% (34,625) |
Aggregate household income in Otter in 2022: $57,184,847
Median family income in Otter in 2022:| Otter: | $68,728 |
| Montana: | $83,580 |
Median non-family income in Otter in 2022:| Otter: | $28,043 |
| State: | $40,582 |
Change in median non-family income between 2000 and 2022:| Otter, Montana: | +103.9% |
| State: | +108.3% |
Median per capita income in Otter in 2022:| Otter: | $34,632 |
| Montana: | $38,329 |
Change in median per capita income between 2000 and 2022:| Otter, Montana: | +123.5% |
| Montana: | +123.5% |
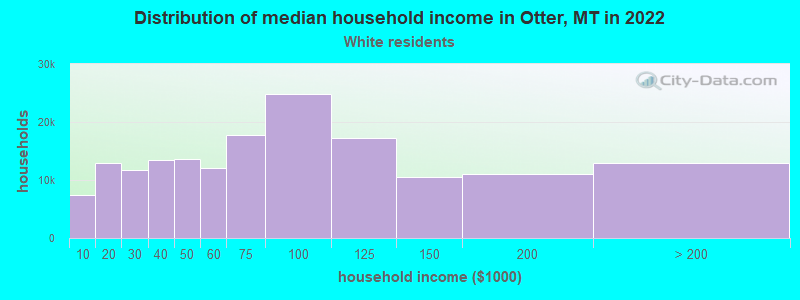
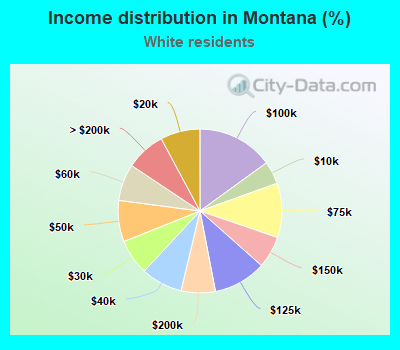
Income statistics for White residents
Median household income in Otter, MT in 2022:| Otter: | $56,297 |
| State: | $69,744 |
Change in median household income between 2000 and 2022:| Otter, Montana: | +106.8% |
| State: | +106.5% |
Number of households with income < $10k:| Otter: | 4.5% (7,447) |
| State: | 4.5% (18,406) |
Number of households with income $10k - 20k:| Otter: | 7.8% (12,967) |
| State: | 7.8% (32,061) |
Number of households with income $20k - 30k:| Otter: | 7.1% (11,700) |
| Montana: | 7.0% (28,825) |
Number of households with income $30k - 40k:| Otter: | 8.2% (13,524) |
| State: | 8.2% (33,552) |
Number of households with income $40k - 50k:| Otter: | 8.2% (13,539) |
| State: | 8.2% (33,446) |
Number of households with income $50k - 60k:| Otter: | 7.2% (11,992) |
| Montana: | 7.3% (29,753) |
Number of households with income $60k - 75k:| Otter: | 10.8% (17,797) |
| State: | 10.7% (44,051) |
Number of households with income $75k - 100k:| Otter: | 15.0% (24,863) |
| State: | 15.0% (61,580) |
Number of households with income $100k - 125k:| Otter: | 10.4% (17,222) |
| Montana: | 10.4% (42,636) |
Number of households with income $125k - 150k:| Otter: | 6.3% (10,448) |
| State: | 6.3% (25,938) |
Number of households with income $150k - 200k:| Otter: | 6.7% (11,113) |
| State: | 6.8% (27,704) |
Number of households with income > $200k:| Otter: | 7.8% (12,901) |
| State: | 7.8% (32,101) |
Aggregate household income in Otter in 2022: $48,720,611
Median family income in Otter in 2022:| Otter: | $69,509 |
| State: | $86,163 |
Number of families with income < $10k:| Otter: | 2.8% (3) |
| State: | 2.0% (4,963) |
Number of families with income $10k - 20k:| Otter: | 2.3% (2) |
| Montana: | 2.8% (7,063) |
Number of families with income $20k - 30k:| Otter: | 9.3% (10) |
| State: | 4.5% (11,218) |
Number of families with income $30k - 40k:| Otter: | 5.1% (5) |
| State: | 6.0% (14,834) |
Number of families with income $40k - 50k:| Otter: | 7.6% (8) |
| State: | 6.8% (16,997) |
Number of families with income $50k - 60k:| Otter: | 3.6% (4) |
| State: | 7.3% (18,007) |
Number of families with income $60k - 75k:| Otter: | 21.1% (22) |
| Montana: | 11.6% (28,681) |
Number of families with income $75k - 100k:| Otter: | 6.5% (7) |
| State: | 17.2% (42,622) |
Number of families with income $100k - 125k:| Otter: | 8.7% (9) |
| State: | 13.5% (33,620) |
Number of families with income $150k - 200k:| Otter: | 17.0% (18) |
| Montana: | 9.6% (23,873) |
Number of families with income > $200k:| Otter: | 16.0% (16) |
| State: | 10.0% (24,758) |
Median non-family income in Otter in 2022:| Otter: | $28,303 |
| Montana: | $41,403 |
Change in median non-family income between 2000 and 2022:| Otter, Montana: | +105.8% |
| State: | +109.4% |
Median per capita income in Otter in 2022:| Otter: | $34,504 |
| State: | $40,453 |
Change in median per capita income between 2000 and 2022:| Otter, Montana: | +125.9% |
| Montana: | +125.6% |
Income statistics for Asian residents
Number of households with income < $10k:| Otter: | 5.3% (356,891) |
| Montana: | 5.1% (160) |
Number of households with income $10k - 20k:| Otter: | 4.8% (322,178) |
| State: | 4.6% (144) |
Number of households with income $20k - 30k:| Otter: | 4.7% (315,328) |
| State: | 7.6% (237) |
Number of households with income $30k - 40k:| Otter: | 4.7% (313,005) |
| State: | 8.1% (251) |
Number of households with income $40k - 50k:| Otter: | 4.6% (308,221) |
| Montana: | 14.2% (442) |
Number of households with income $50k - 60k:| Otter: | 4.8% (319,906) |
| State: | 9.3% (289) |
Number of households with income $60k - 75k:| Otter: | 6.9% (458,785) |
| State: | 12.0% (373) |
Number of households with income $75k - 100k:| Otter: | 10.9% (726,788) |
| State: | 12.3% (382) |
Number of households with income $100k - 125k:| Otter: | 10.0% (666,283) |
| Montana: | 8.2% (255) |
Number of households with income $125k - 150k:| Otter: | 7.8% (524,291) |
| State: | 3.5% (110) |
Number of households with income $150k - 200k:| Otter: | 11.8% (791,285) |
| State: | 1.1% (35) |
Number of households with income > $200k:| Otter: | 23.7% (1,588,564) |
| Montana: | 13.9% (433) |
Median per capita income in Otter in 2022:| Otter: | $64,292 |
| State: | $44,327 |
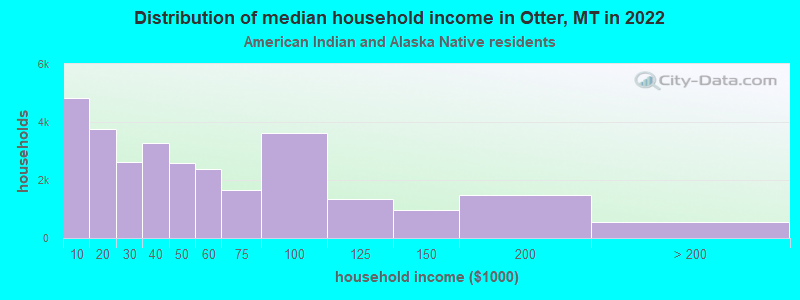
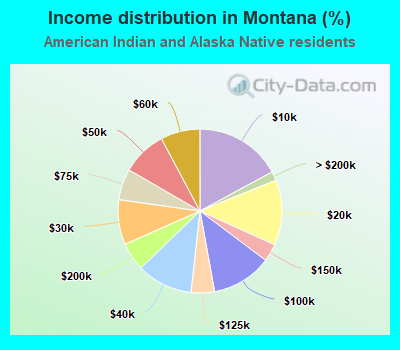
Income statistics for American Indian and Alaska Native residents
Median household income in Otter, MT in 2022:| Otter: | $134,921 |
| State: | $40,063 |
Change in median household income between 2000 and 2022:| Otter, Montana: | +82.9% |
| State: | +77.9% |
Number of households with income < $10k:| Otter: | 16.6% (4,835) |
| State: | 17.1% (3,122) |
Number of households with income $10k - 20k:| Otter: | 13.0% (3,763) |
| Montana: | 12.9% (2,355) |
Number of households with income $20k - 30k:| Otter: | 9.0% (2,621) |
| State: | 8.9% (1,620) |
Number of households with income $30k - 40k:| Otter: | 11.2% (3,260) |
| Montana: | 11.0% (2,013) |
Number of households with income $40k - 50k:| Otter: | 8.9% (2,582) |
| State: | 8.8% (1,615) |
Number of households with income $50k - 60k:| Otter: | 8.1% (2,364) |
| State: | 7.8% (1,423) |
Number of households with income $60k - 75k:| Otter: | 5.7% (1,650) |
| Montana: | 6.1% (1,117) |
Number of households with income $75k - 100k:| Otter: | 12.5% (3,629) |
| State: | 11.9% (2,169) |
Number of households with income $100k - 125k:| Otter: | 4.6% (1,332) |
| Montana: | 4.6% (845) |
Number of households with income $125k - 150k:| Otter: | 3.4% (982) |
| State: | 3.5% (637) |
Number of households with income $150k - 200k:| Otter: | 5.1% (1,495) |
| Montana: | 5.6% (1,015) |
Number of households with income > $200k:| Otter: | 1.8% (536) |
| State: | 1.8% (324) |
Aggregate household income in Otter in 2022: $731,419
Median family income in Otter in 2022:| Otter: | $113,998 |
| Montana: | $41,048 |
Number of families with income $20k - 30k:| Otter: | 1.8% (0) |
| State: | 8.1% (932) |
Number of families with income $125k - 150k:| Otter: | 98.2% (20) |
| State: | 3.6% (415) |
Median per capita income in Otter in 2022:| Otter: | $42,932 |
| State: | $19,038 |
Change in median per capita income between 2000 and 2022:| Otter, Montana: | +129.4% |
| State: | +114.7% |