Pamelia, New York (NY) income map, earnings map, and wages data
The median household income in Pamelia, NY in 2022 was $62,220, which was 27.9% less than the median annual income of $79,557 across the entire state of New York. Compared to the median income of $37,500 in 2000 this represents an increase of 39.7%. The per capita income in 2022 was $31,153, which means an increase of 47.6% compared to 2000 when it was $16,314.
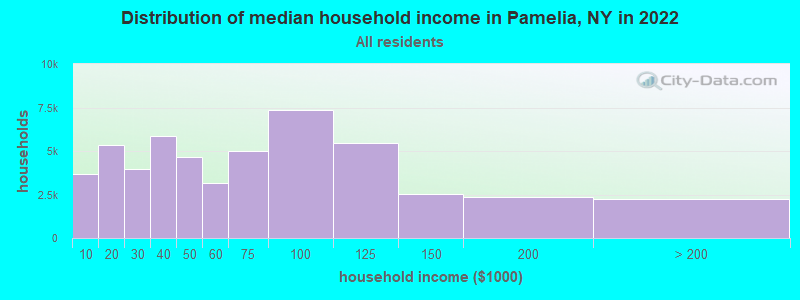
Income statistics for all residents
Median household income in Pamelia, NY in 2022:| Pamelia: | $62,220 |
| State: | $79,557 |
Change in median household income between 2000 and 2022:| Pamelia, New York: | +65.9% |
| State: | +83.3% |
Number of households with income < $10k:| Pamelia: | 7.1% (3,684) |
| State: | 6.8% (527,598) |
Number of households with income $10k - 20k:| Pamelia: | 10.3% (5,330) |
| New York: | 7.4% (574,940) |
Number of households with income $20k - 30k:| Pamelia: | 7.7% (3,968) |
| State: | 6.7% (517,718) |
Number of households with income $30k - 40k:| Pamelia: | 11.4% (5,876) |
| State: | 6.5% (506,674) |
Number of households with income $40k - 50k:| Pamelia: | 9.0% (4,653) |
| State: | 6.1% (470,439) |
Number of households with income $50k - 60k:| Pamelia: | 6.1% (3,155) |
| State: | 5.8% (454,042) |
Number of households with income $60k - 75k:| Pamelia: | 9.7% (4,993) |
| State: | 8.5% (657,508) |
Number of households with income $75k - 100k:| Pamelia: | 14.3% (7,384) |
| State: | 11.6% (899,824) |
Number of households with income $100k - 125k:| Pamelia: | 10.6% (5,451) |
| State: | 9.3% (723,825) |
Number of households with income $125k - 150k:| Pamelia: | 4.8% (2,502) |
| State: | 7.1% (552,420) |
Number of households with income $150k - 200k:| Pamelia: | 4.6% (2,372) |
| State: | 9.4% (727,051) |
Number of households with income > $200k:| Pamelia: | 4.4% (2,255) |
| State: | 15.0% (1,162,269) |
Aggregate household income in Pamelia in 2022: $94,641,254
Median family income in Pamelia in 2022:| Pamelia: | $79,726 |
| New York: | $99,066 |
Median non-family income in Pamelia in 2022:| Pamelia: | $40,893 |
| State: | $50,181 |
Change in median non-family income between 2000 and 2022:| Pamelia, New York: | +68.8% |
| New York: | +85.4% |
Median per capita income in Pamelia in 2022:| Pamelia: | $31,154 |
| State: | $47,421 |
Change in median per capita income between 2000 and 2022:| Pamelia, New York: | +91.0% |
| State: | +102.7% |
Income statistics for White residents
Median household income in Pamelia, NY in 2022:| Pamelia: | $63,318 |
| State: | $89,408 |
Change in median household income between 2000 and 2022:| Pamelia, New York: | +69.0% |
| State: | +85.5% |
Number of households with income < $10k:| Pamelia: | 6.6% (2,940) |
| New York: | 4.8% (225,550) |
Number of households with income $10k - 20k:| Pamelia: | 10.3% (4,549) |
| State: | 6.1% (289,425) |
Number of households with income $20k - 30k:| Pamelia: | 8.3% (3,654) |
| State: | 5.9% (280,254) |
Number of households with income $30k - 40k:| Pamelia: | 10.4% (4,609) |
| State: | 6.1% (288,263) |
Number of households with income $40k - 50k:| Pamelia: | 8.5% (3,742) |
| New York: | 5.9% (278,079) |
Number of households with income $50k - 60k:| Pamelia: | 6.9% (3,055) |
| State: | 5.7% (267,554) |
Number of households with income $60k - 75k:| Pamelia: | 10.8% (4,788) |
| New York: | 8.4% (398,344) |
Number of households with income $75k - 100k:| Pamelia: | 14.0% (6,202) |
| State: | 11.8% (554,841) |
Number of households with income $100k - 125k:| Pamelia: | 9.9% (4,358) |
| State: | 10.0% (469,794) |
Number of households with income $125k - 150k:| Pamelia: | 5.1% (2,241) |
| State: | 7.6% (360,467) |
Number of households with income $150k - 200k:| Pamelia: | 5.2% (2,287) |
| State: | 10.1% (477,078) |
Number of households with income > $200k:| Pamelia: | 4.1% (1,805) |
| State: | 17.6% (829,233) |
Aggregate household income in Pamelia in 2022: $83,697,991
Median family income in Pamelia in 2022:| Pamelia: | $79,749 |
| New York: | $115,170 |
Number of families with income < $10k:| Pamelia: | 4.1% (31) |
| State: | 2.5% (68,851) |
Number of families with income $10k - 20k:| Pamelia: | 3.4% (26) |
| New York: | 3.0% (83,127) |
Number of families with income $20k - 30k:| Pamelia: | 4.6% (35) |
| State: | 3.5% (97,578) |
Number of families with income $30k - 40k:| Pamelia: | 8.2% (63) |
| State: | 4.1% (114,108) |
Number of families with income $40k - 50k:| Pamelia: | 10.6% (82) |
| State: | 4.7% (130,902) |
Number of families with income $50k - 60k:| Pamelia: | 8.1% (62) |
| New York: | 4.9% (135,118) |
Number of families with income $60k - 75k:| Pamelia: | 12.3% (95) |
| State: | 7.8% (216,254) |
Number of families with income $75k - 100k:| Pamelia: | 20.4% (156) |
| State: | 12.4% (342,382) |
Number of families with income $100k - 125k:| Pamelia: | 11.9% (91) |
| New York: | 11.4% (314,917) |
Number of families with income $125k - 150k:| Pamelia: | 2.6% (20) |
| State: | 9.4% (260,489) |
Number of families with income $150k - 200k:| Pamelia: | 13.8% (106) |
| State: | 13.2% (365,586) |
Median non-family income in Pamelia in 2022:| Pamelia: | $45,224 |
| State: | $54,783 |
Change in median non-family income between 2000 and 2022:| Pamelia, New York: | +86.7% |
| State: | +87.9% |
Median per capita income in Pamelia in 2022:| Pamelia: | $31,970 |
| State: | $57,640 |
Change in median per capita income between 2000 and 2022:| Pamelia, New York: | +93.8% |
| State: | +111.6% |
Income statistics for Black or African American residents
Median household income in Pamelia, NY in 2022:| Pamelia: | $86,081 |
| New York: | $57,898 |
Change in median household income between 2000 and 2022:| Pamelia, New York: | +100.2% |
| New York: | +84.6% |
Number of households with income < $10k:| Pamelia: | 12.0% (88,157) |
| State: | 12.0% (128,500) |
Number of households with income $10k - 20k:| Pamelia: | 10.0% (73,704) |
| State: | 10.0% (107,541) |
Number of households with income $20k - 30k:| Pamelia: | 8.4% (61,858) |
| New York: | 8.4% (90,192) |
Number of households with income $30k - 40k:| Pamelia: | 7.4% (54,518) |
| State: | 7.4% (79,579) |
Number of households with income $40k - 50k:| Pamelia: | 6.8% (49,710) |
| New York: | 6.8% (72,491) |
Number of households with income $50k - 60k:| Pamelia: | 6.6% (48,754) |
| State: | 6.7% (71,309) |
Number of households with income $60k - 75k:| Pamelia: | 8.9% (65,180) |
| New York: | 8.9% (95,050) |
Number of households with income $75k - 100k:| Pamelia: | 11.5% (84,570) |
| State: | 11.5% (123,569) |
Number of households with income $100k - 125k:| Pamelia: | 8.1% (59,204) |
| State: | 8.1% (86,632) |
Number of households with income $125k - 150k:| Pamelia: | 6.1% (44,418) |
| New York: | 6.0% (64,788) |
Number of households with income $150k - 200k:| Pamelia: | 7.1% (52,412) |
| State: | 7.2% (76,644) |
Number of households with income > $200k:| Pamelia: | 7.0% (51,183) |
| New York: | 7.0% (75,062) |
Aggregate household income in Pamelia in 2022: $2,762,879
Median family income in Pamelia in 2022:| Pamelia: | $87,681 |
| State: | $72,528 |
Number of families with income $20k - 30k:| Pamelia: | 4.7% (2) |
| State: | 7.0% (44,139) |
Number of families with income $40k - 50k:| Pamelia: | 18.0% (6) |
| New York: | 6.6% (41,419) |
Number of families with income $150k - 200k:| Pamelia: | 77.2% (27) |
| State: | 9.4% (59,260) |
Median non-family income in Pamelia in 2022:| Pamelia: | $49,560 |
| State: | $37,265 |
Change in median non-family income between 2000 and 2022:| Pamelia, New York: | +104.6% |
| State: | +81.7% |
Median per capita income in Pamelia in 2022:| Pamelia: | $50,091 |
| State: | $31,947 |
Change in median per capita income between 2000 and 2022:| Pamelia, New York: | +103.0% |
| New York: | +106.1% |
Income statistics for Asian residents
Number of households with income < $10k:| Pamelia: | 6.9% (12,276) |
| New York: | 6.9% (42,537) |
Number of households with income $10k - 20k:| Pamelia: | 7.3% (12,915) |
| New York: | 7.3% (44,745) |
Number of households with income $20k - 30k:| Pamelia: | 6.2% (11,052) |
| State: | 6.2% (38,249) |
Number of households with income $30k - 40k:| Pamelia: | 5.5% (9,810) |
| New York: | 5.5% (33,993) |
Number of households with income $40k - 50k:| Pamelia: | 4.9% (8,607) |
| New York: | 4.8% (29,795) |
Number of households with income $50k - 60k:| Pamelia: | 5.2% (9,229) |
| State: | 5.2% (32,100) |
Number of households with income $60k - 75k:| Pamelia: | 7.3% (12,872) |
| New York: | 7.3% (44,615) |
Number of households with income $75k - 100k:| Pamelia: | 10.9% (19,244) |
| New York: | 10.8% (66,687) |
Number of households with income $100k - 125k:| Pamelia: | 8.2% (14,472) |
| State: | 8.2% (50,233) |
Number of households with income $125k - 150k:| Pamelia: | 7.2% (12,778) |
| State: | 7.2% (44,299) |
Number of households with income $150k - 200k:| Pamelia: | 10.4% (18,395) |
| State: | 10.4% (63,837) |
Number of households with income > $200k:| Pamelia: | 20.1% (35,699) |
| State: | 20.1% (123,891) |
Median per capita income in Pamelia in 2022:| Pamelia: | $31,401 |
| State: | $46,726 |
Income statistics for Hispanic or Latino residents
Median household income in Pamelia, NY in 2022:| Pamelia: | $43,968 |
| New York: | $60,468 |
Change in median household income between 2000 and 2022:| Pamelia, New York: | +67.5% |
| New York: | +98.3% |
Number of households with income < $10k:| Pamelia: | 10.0% (54,697) |
| State: | 9.9% (127,185) |
Number of households with income $10k - 20k:| Pamelia: | 10.7% (58,879) |
| State: | 10.7% (136,699) |
Number of households with income $20k - 30k:| Pamelia: | 8.1% (44,336) |
| State: | 8.1% (102,991) |
Number of households with income $30k - 40k:| Pamelia: | 7.8% (42,945) |
| State: | 7.8% (100,149) |
Number of households with income $40k - 50k:| Pamelia: | 6.8% (37,573) |
| State: | 6.9% (87,760) |
Number of households with income $50k - 60k:| Pamelia: | 6.3% (34,794) |
| State: | 6.3% (80,968) |
Number of households with income $60k - 75k:| Pamelia: | 8.6% (47,424) |
| State: | 8.7% (110,631) |
Number of households with income $75k - 100k:| Pamelia: | 11.2% (61,214) |
| State: | 11.2% (142,787) |
Number of households with income $100k - 125k:| Pamelia: | 8.2% (44,857) |
| State: | 8.2% (104,850) |
Number of households with income $125k - 150k:| Pamelia: | 6.3% (34,417) |
| State: | 6.3% (80,274) |
Number of households with income $150k - 200k:| Pamelia: | 7.4% (40,687) |
| State: | 7.4% (95,117) |
Number of households with income > $200k:| Pamelia: | 8.6% (46,923) |
| New York: | 8.6% (109,514) |
Aggregate household income in Pamelia in 2022: $513,232
Median family income in Pamelia in 2022:| Pamelia: | $55,666 |
| New York: | $68,770 |
Number of families with income < $10k:| Pamelia: | 8.7% (11) |
| State: | 6.9% (58,565) |
Number of families with income $10k - 20k:| Pamelia: | 11.6% (15) |
| New York: | 7.0% (59,058) |
Number of families with income $20k - 30k:| Pamelia: | 14.5% (18) |
| New York: | 8.0% (68,048) |
Number of families with income $30k - 40k:| Pamelia: | 11.2% (14) |
| State: | 8.4% (70,668) |
Number of families with income $40k - 50k:| Pamelia: | 14.2% (18) |
| State: | 7.4% (62,941) |
Number of families with income $50k - 60k:| Pamelia: | 9.7% (12) |
| New York: | 6.6% (55,592) |
Number of families with income $60k - 75k:| Pamelia: | 9.8% (12) |
| State: | 9.3% (78,564) |
Number of families with income $75k - 100k:| Pamelia: | 10.9% (14) |
| State: | 12.6% (106,685) |
Number of families with income $100k - 125k:| Pamelia: | 4.3% (5) |
| New York: | 9.4% (79,139) |
Number of families with income $125k - 150k:| Pamelia: | 0.9% (1) |
| State: | 6.9% (58,255) |
Number of families with income $150k - 200k:| Pamelia: | 4.1% (5) |
| State: | 8.3% (69,877) |
Median per capita income in Pamelia in 2022:| Pamelia: | $4,575 |
| State: | $29,761 |
Change in median per capita income between 2000 and 2022:| Pamelia, New York: | +47.3% |
| New York: | +132.7% |
Income statistics for American Indian and Alaska Native residents
Number of households with income < $10k:| Pamelia: | 8.6% (497) |
| State: | 8.6% (3,559) |
Number of households with income $10k - 20k:| Pamelia: | 6.0% (344) |
| State: | 5.9% (2,455) |
Number of households with income $20k - 30k:| Pamelia: | 8.2% (473) |
| New York: | 8.2% (3,393) |
Number of households with income $30k - 40k:| Pamelia: | 11.9% (686) |
| State: | 11.9% (4,918) |
Number of households with income $40k - 50k:| Pamelia: | 6.4% (371) |
| State: | 6.5% (2,682) |
Number of households with income $50k - 60k:| Pamelia: | 6.0% (349) |
| New York: | 6.1% (2,516) |
Number of households with income $60k - 75k:| Pamelia: | 9.9% (573) |
| New York: | 10.0% (4,125) |
Number of households with income $75k - 100k:| Pamelia: | 13.4% (771) |
| State: | 13.3% (5,517) |
Number of households with income $100k - 125k:| Pamelia: | 8.4% (482) |
| New York: | 8.4% (3,463) |
Number of households with income $125k - 150k:| Pamelia: | 7.0% (404) |
| New York: | 7.0% (2,887) |
Number of households with income $150k - 200k:| Pamelia: | 10.0% (575) |
| New York: | 9.9% (4,106) |
Number of households with income > $200k:| Pamelia: | 4.2% (244) |
| New York: | 4.2% (1,744) |
Median per capita income in Pamelia in 2022:| Pamelia: | $9,363 |
| State: | $25,837 |
Income statistics for Multirace residents
Median household income in Pamelia, NY in 2022:| Pamelia: | $258,456 |
| State: | $73,557 |
Number of households with income < $10k:| Pamelia: | 8.9% (65,098) |
| State: | 8.9% (57,924) |
Number of households with income $10k - 20k:| Pamelia: | 8.7% (63,488) |
| State: | 8.7% (56,590) |
Number of households with income $20k - 30k:| Pamelia: | 7.1% (51,895) |
| New York: | 7.1% (46,287) |
Number of households with income $30k - 40k:| Pamelia: | 6.9% (50,548) |
| New York: | 6.9% (45,132) |
Number of households with income $40k - 50k:| Pamelia: | 5.8% (42,417) |
| State: | 5.8% (37,946) |
Number of households with income $50k - 60k:| Pamelia: | 5.6% (40,754) |
| New York: | 5.6% (36,410) |
Number of households with income $60k - 75k:| Pamelia: | 7.8% (56,848) |
| New York: | 7.8% (50,819) |
Number of households with income $75k - 100k:| Pamelia: | 11.7% (85,187) |
| New York: | 11.7% (76,024) |
Number of households with income $100k - 125k:| Pamelia: | 9.3% (67,788) |
| State: | 9.3% (60,635) |
Number of households with income $125k - 150k:| Pamelia: | 6.2% (45,422) |
| State: | 6.2% (40,533) |
Number of households with income $150k - 200k:| Pamelia: | 8.6% (63,184) |
| New York: | 8.6% (56,409) |
Number of households with income > $200k:| Pamelia: | 13.4% (98,093) |
| State: | 13.4% (87,442) |
Aggregate household income in Pamelia in 2022: $6,419,367
Median family income in Pamelia in 2022:| Pamelia: | $170,067 |
| State: | $85,788 |
Number of families with income $10k - 20k:| Pamelia: | 8.4% (5) |
| State: | 5.6% (22,512) |
Number of families with income $60k - 75k:| Pamelia: | 18.3% (12) |
| State: | 7.6% (30,653) |
Number of families with income $100k - 125k:| Pamelia: | 73.3% (48) |
| New York: | 10.7% (43,036) |
Median per capita income in Pamelia in 2022:| Pamelia: | $27,283 |
| New York: | $36,931 |
Change in median per capita income between 2000 and 2022:| Pamelia, New York: | +105.1% |
| State: | +158.8% |
Income statistics for other residents
Number of households with income < $10k:| Pamelia: | 9.1% (2) |
| State: | 10.3% (69,252) |
Number of households with income $10k - 20k:| Pamelia: | 9.1% (2) |
| State: | 11.0% (73,890) |
Number of households with income $20k - 30k:| Pamelia: | 9.1% (2) |
| State: | 8.8% (59,096) |
Number of households with income $30k - 40k:| Pamelia: | 9.1% (2) |
| State: | 8.1% (54,418) |
Number of households with income $40k - 50k:| Pamelia: | 9.1% (2) |
| State: | 7.3% (49,042) |
Number of households with income $50k - 60k:| Pamelia: | 4.5% (1) |
| New York: | 6.5% (43,945) |
Number of households with income $60k - 75k:| Pamelia: | 9.1% (2) |
| State: | 9.5% (64,087) |
Number of households with income $75k - 100k:| Pamelia: | 9.1% (2) |
| State: | 10.9% (73,094) |
Number of households with income $100k - 125k:| Pamelia: | 9.1% (2) |
| New York: | 7.9% (53,055) |
Number of households with income $125k - 150k:| Pamelia: | 4.5% (1) |
| State: | 5.9% (39,446) |
Number of households with income $150k - 200k:| Pamelia: | 9.1% (2) |
| State: | 7.2% (48,653) |
Number of households with income > $200k:| Pamelia: | 9.1% (2) |
| New York: | 6.6% (44,703) |
Aggregate household income in Pamelia in 2022: $147,403
Median family income in Pamelia in 2022:| Pamelia: | $61,963 |
| New York: | $63,465 |
Median per capita income in Pamelia in 2022:| Pamelia: | $5,817 |
| State: | $26,975 |
Change in median per capita income between 2000 and 2022:| Pamelia, New York: | +58.9% |
| New York: | +144.6% |