The median household income in Paw Paw, WV in 2022 was $57,805, which was 6.0% greater than the median annual income of $54,329 across the entire state of West Virginia. Compared to the median income of $25,625 in 2000 this represents an increase of 55.7%. The per capita income in 2022 was $24,158, which means an increase of 28.1% compared to 2000 when it was $17,377.
Whole page based on the data from 2000 / 2022 when the population of Paw Paw, West Virginia was 524 / 458
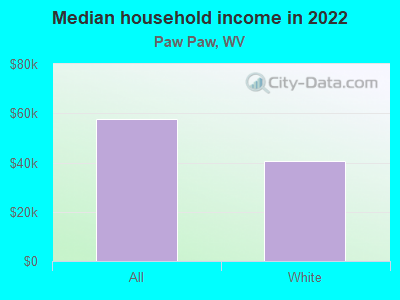
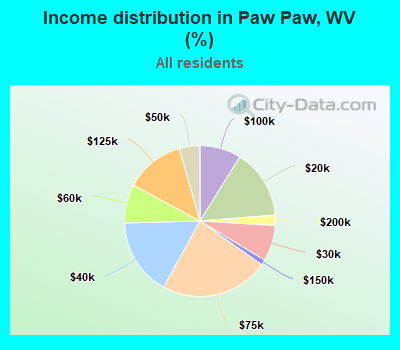
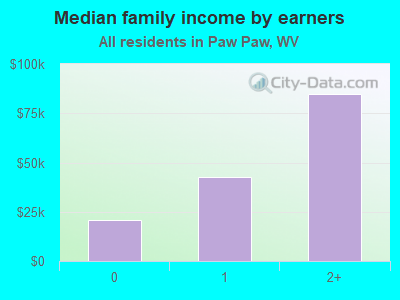
Income statistics for all residents
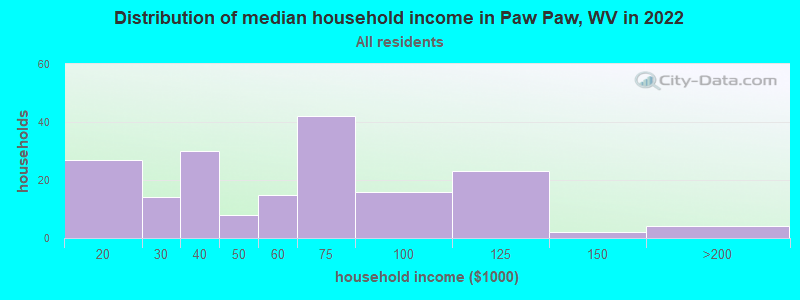
Median household income in Paw Paw, WV in 2022:
Paw Paw:
$57,805
West Virginia:
$54,329
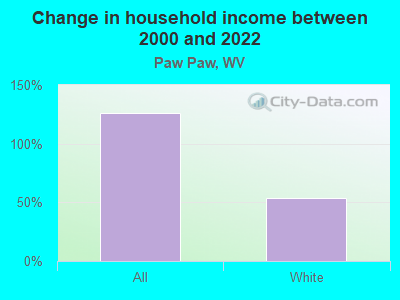
Change in median household income between 2000 and 2022:
Paw Paw, West Virginia:
+125.6%
State:
+83.0%
Number of households with income < $10k:
Paw Paw:
0.0% (0)
West Virginia:
7.1% (52,185)
Number of households with income $10k - 20k:
Paw Paw:
14.9% (27)
State:
11.0% (81,114)
Number of households with income $20k - 30k:
Paw Paw:
7.7% (14)
State:
10.5% (77,246)
Number of households with income $30k - 40k:
Paw Paw:
16.6% (30)
State:
9.6% (70,812)
Number of households with income $40k - 50k:
Paw Paw:
4.4% (8)
State:
8.2% (60,448)
Number of households with income $50k - 60k:
Paw Paw:
8.3% (15)
State:
7.5% (55,191)
Number of households with income $60k - 75k:
Paw Paw:
23.2% (42)
State:
9.9% (72,717)
Number of households with income $75k - 100k:
Paw Paw:
8.8% (16)
State:
12.2% (89,685)
Number of households with income $100k - 125k:
Paw Paw:
12.7% (23)
State:
8.8% (64,450)
Number of households with income $125k - 150k:
Paw Paw:
1.1% (2)
State:
5.4% (39,984)
Number of households with income $150k - 200k:
Paw Paw:
2.2% (4)
West Virginia:
5.1% (37,216)
Number of households with income > $200k:
Paw Paw:
0.0% (0)
State:
4.8% (35,293)
Aggregate household income in Paw Paw in 2022: $10,343,615
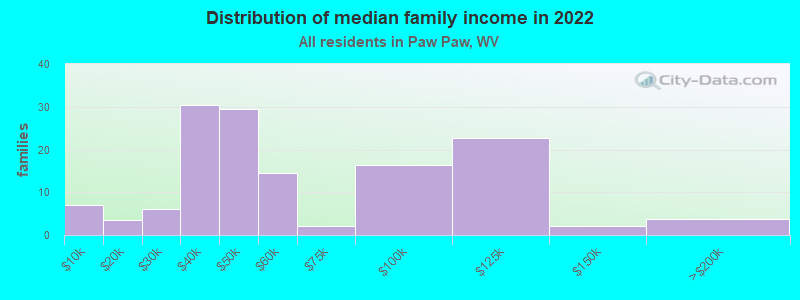
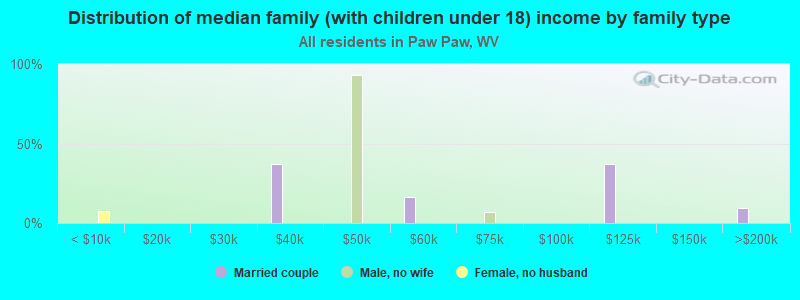
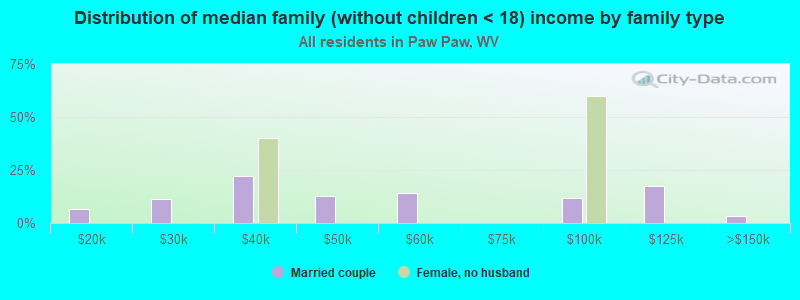
Median family income in Paw Paw in 2022:
Paw Paw:
$43,453
State:
$70,318
Number of families with income < $10k:
Paw Paw:
5.1% (7)
State:
4.7% (21,958)
Number of families with income $10k - 20k:
Paw Paw:
2.6% (4)
State:
5.6% (25,990)
Number of families with income $20k - 30k:
Paw Paw:
4.3% (6)
State:
8.1% (37,431)
Number of families with income $30k - 40k:
Paw Paw:
22.0% (30)
State:
8.2% (38,076)
Number of families with income $40k - 50k:
Paw Paw:
21.4% (29)
State:
7.8% (36,276)
Number of families with income $50k - 60k:
Paw Paw:
10.5% (15)
State:
7.7% (35,855)
Number of families with income $60k - 75k:
Paw Paw:
1.5% (2)
State:
11.1% (51,575)
Number of families with income $75k - 100k:
Paw Paw:
11.8% (16)
State:
14.7% (68,220)
Number of families with income $100k - 125k:
Paw Paw:
16.5% (23)
State:
11.2% (51,983)
Number of families with income $125k - 150k:
Paw Paw:
1.4% (2)
State:
7.2% (33,354)
Number of families with income $150k - 200k:
Paw Paw:
2.8% (4)
State:
7.1% (32,736)
Median income for 2 person families:
Paw Paw:
$46,491
State:
$61,929
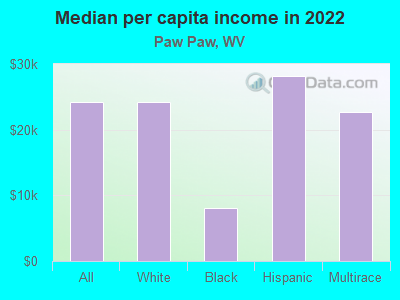
Median per capita income in Paw Paw in 2022:
Paw Paw:
$24,158
State:
$31,922
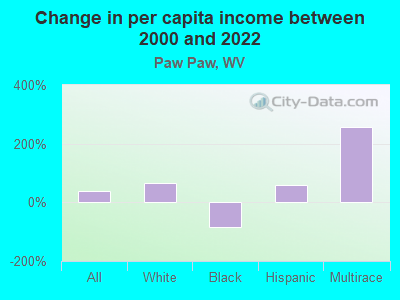
Change in median per capita income between 2000 and 2022:
Paw Paw, West Virginia:
+39.0%
State:
+93.7%
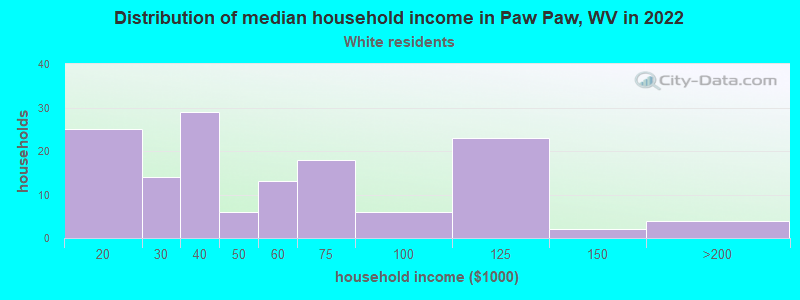
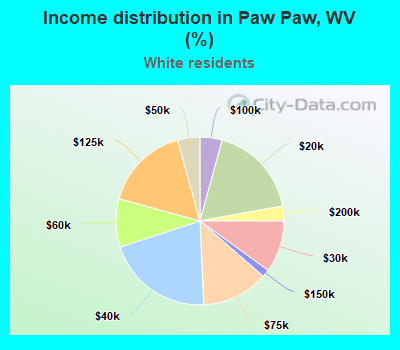
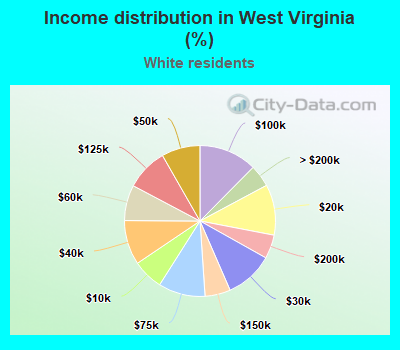
Income statistics for White residents
Median household income in Paw Paw, WV in 2022:
Paw Paw:
$40,734
State:
$55,407
Change in median household income between 2000 and 2022:
Paw Paw, West Virginia:
+54.1%
State:
+84.6%
Number of households with income < $10k:
Paw Paw:
0.0% (0)
State:
6.6% (44,487)
Number of households with income $10k - 20k:
Paw Paw:
17.9% (25)
State:
10.8% (73,331)
Number of households with income $20k - 30k:
Paw Paw:
10.0% (14)
West Virginia:
10.3% (70,092)
Number of households with income $30k - 40k:
Paw Paw:
20.7% (29)
State:
9.6% (64,693)
Number of households with income $40k - 50k:
Paw Paw:
4.3% (6)
State:
8.3% (55,937)
Number of households with income $50k - 60k:
Paw Paw:
9.3% (13)
State:
7.6% (51,718)
Number of households with income $60k - 75k:
Paw Paw:
12.9% (18)
West Virginia:
10.1% (68,097)
Number of households with income $75k - 100k:
Paw Paw:
4.3% (6)
State:
12.4% (84,323)
Number of households with income $100k - 125k:
Paw Paw:
16.4% (23)
State:
9.0% (60,937)
Number of households with income $125k - 150k:
Paw Paw:
1.4% (2)
State:
5.5% (36,957)
Number of households with income $150k - 200k:
Paw Paw:
2.9% (4)
West Virginia:
5.1% (34,631)
Number of households with income > $200k:
Paw Paw:
0.0% (0)
State:
4.7% (32,099)
Aggregate household income in Paw Paw in 2022: $7,875,505
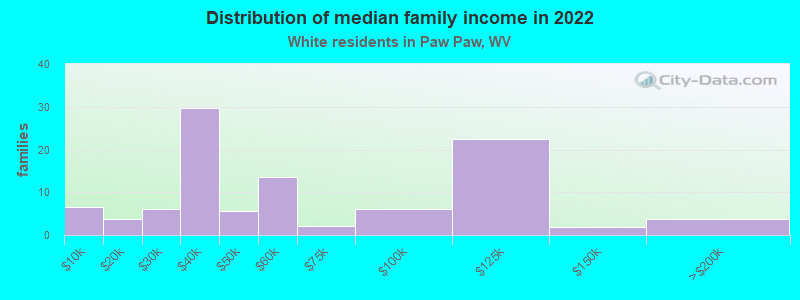
Median family income in Paw Paw in 2022:
Paw Paw:
$51,883
West Virginia:
$71,094
Number of families with income < $10k:
Paw Paw:
6.4% (7)
State:
4.2% (18,159)
Number of families with income $10k - 20k:
Paw Paw:
3.6% (4)
State:
5.5% (23,670)
Number of families with income $20k - 30k:
Paw Paw:
5.9% (6)
State:
7.7% (33,068)
Number of families with income $30k - 40k:
Paw Paw:
29.2% (30)
State:
8.1% (34,621)
Number of families with income $40k - 50k:
Paw Paw:
5.5% (6)
West Virginia:
7.9% (33,944)
Number of families with income $50k - 60k:
Paw Paw:
13.3% (14)
State:
8.0% (34,039)
Number of families with income $60k - 75k:
Paw Paw:
2.1% (2)
State:
11.3% (48,141)
Number of families with income $75k - 100k:
Paw Paw:
6.1% (6)
West Virginia:
15.1% (64,623)
Number of families with income $100k - 125k:
Paw Paw:
22.2% (23)
West Virginia:
11.4% (48,882)
Number of families with income $125k - 150k:
Paw Paw:
1.9% (2)
West Virginia:
7.3% (31,003)
Number of families with income $150k - 200k:
Paw Paw:
3.7% (4)
State:
7.1% (30,474)
Median per capita income in Paw Paw in 2022:
Paw Paw:
$24,199
State:
$32,764
Change in median per capita income between 2000 and 2022:
Paw Paw, West Virginia:
+67.1%
West Virginia:
+97.2%
Income statistics for Black or African American residents
Aggregate household income in Paw Paw in 2022: $1,498,141
Median per capita income in Paw Paw in 2022:
Paw Paw:
$8,027
State:
$22,493
Change in median per capita income between 2000 and 2022:: -84.8%
Paw Paw, West Virginia:
-84.8%
West Virginia:
+81.5%
Income statistics for Hispanic or Latino residents
Number of households with income < $10k:
Paw Paw:
0.0% (0)
State:
8.6% (763)
Number of households with income $10k - 20k:
Paw Paw:
0.0% (0)
West Virginia:
8.2% (726)
Number of households with income $20k - 30k:
Paw Paw:
0.0% (0)
State:
13.1% (1,154)
Number of households with income $30k - 40k:
Paw Paw:
0.0% (0)
State:
4.4% (388)
Number of households with income $40k - 50k:
Paw Paw:
0.0% (0)
State:
4.7% (418)
Number of households with income $50k - 60k:
Paw Paw:
0.0% (0)
State:
6.5% (572)
Number of households with income $60k - 75k:
Paw Paw:
100.0% (27)
State:
9.2% (809)
Number of households with income $75k - 100k:
Paw Paw:
0.0% (0)
State:
14.4% (1,273)
Number of households with income $100k - 125k:
Paw Paw:
0.0% (0)
State:
7.5% (660)
Number of households with income $125k - 150k:
Paw Paw:
0.0% (0)
West Virginia:
10.6% (936)
Number of households with income $150k - 200k:
Paw Paw:
0.0% (0)
State:
5.1% (449)
Number of households with income > $200k:
Paw Paw:
0.0% (0)
State:
7.7% (675)
Aggregate household income in Paw Paw in 2022: $992,793
Median per capita income in Paw Paw in 2022:
Paw Paw:
$28,189
State:
$23,238
Change in median per capita income between 2000 and 2022:
Paw Paw, West Virginia:
+59.3%
State:
+67.7%
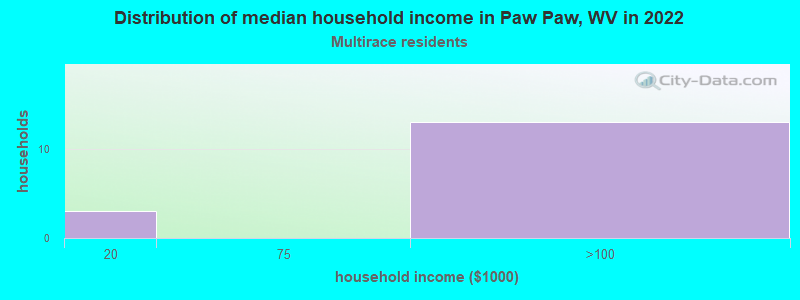
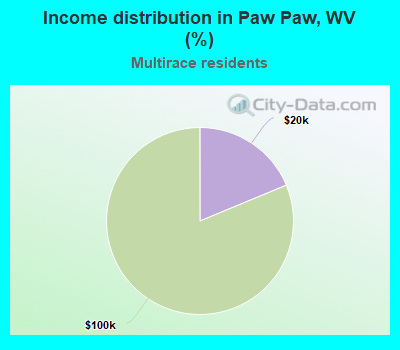
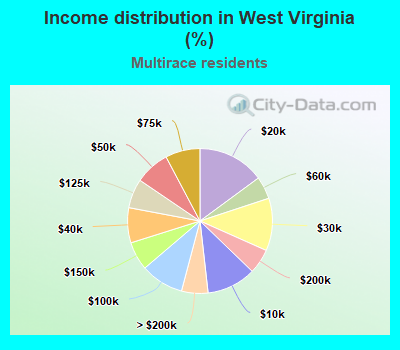
Income statistics for Multirace residents
Number of households with income < $10k:
Paw Paw:
0.0% (0)
State:
11.0% (2,990)
Number of households with income $10k - 20k:
Paw Paw:
18.8% (3)
State:
14.9% (4,055)
Number of households with income $20k - 30k:
Paw Paw:
0.0% (0)
State:
11.7% (3,191)
Number of households with income $30k - 40k:
Paw Paw:
0.0% (0)
State:
7.8% (2,129)
Number of households with income $40k - 50k:
Paw Paw:
0.0% (0)
State:
7.8% (2,111)
Number of households with income $50k - 60k:
Paw Paw:
0.0% (0)
State:
5.0% (1,367)
Number of households with income $60k - 75k:
Paw Paw:
0.0% (0)
State:
7.7% (2,106)
Number of households with income $75k - 100k:
Paw Paw:
81.2% (13)
State:
9.6% (2,621)
Number of households with income $100k - 125k:
Paw Paw:
0.0% (0)
West Virginia:
6.5% (1,773)
Number of households with income $125k - 150k:
Paw Paw:
0.0% (0)
West Virginia:
6.4% (1,732)
Number of households with income $150k - 200k:
Paw Paw:
0.0% (0)
State:
5.6% (1,510)
Number of households with income > $200k:
Paw Paw:
0.0% (0)
West Virginia:
5.9% (1,606)
Aggregate household income in Paw Paw in 2022: $1,083,116
Median per capita income in Paw Paw in 2022:
Paw Paw:
$22,766
State:
$22,284
Discuss Paw Paw, West Virginia (WV) on our hugely popular West Virginia forum.