Philema, Georgia (GA) income map, earnings map, and wages data
The median household income in Philema, GA in 2022 was $79,607, which was 8.5% greater than the median annual income of $72,837 across the entire state of Georgia. Compared to the median income of $46,560 in 2000 this represents an increase of 41.5%. The per capita income in 2022 was $34,333, which means an increase of 45.1% compared to 2000 when it was $18,859.
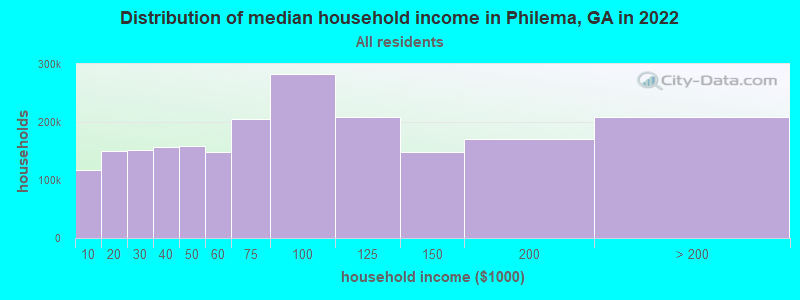
Income statistics for all residents
Median household income in Philema, GA in 2022:| Philema: | $79,608 |
| Georgia: | $72,837 |
Change in median household income between 2000 and 2022:| Philema, Georgia: | +71.0% |
| Georgia: | +71.7% |
Number of households with income < $10k:| Philema: | 5.6% (124,372) |
| Georgia: | 5.6% (229,257) |
Number of households with income $10k - 20k:| Philema: | 7.0% (156,334) |
| State: | 7.0% (285,929) |
Number of households with income $20k - 30k:| Philema: | 7.1% (158,504) |
| State: | 7.1% (290,416) |
Number of households with income $30k - 40k:| Philema: | 7.5% (165,863) |
| State: | 7.4% (304,514) |
Number of households with income $40k - 50k:| Philema: | 7.5% (166,682) |
| Georgia: | 7.5% (306,115) |
Number of households with income $50k - 60k:| Philema: | 7.0% (156,612) |
| Georgia: | 7.0% (287,636) |
Number of households with income $60k - 75k:| Philema: | 9.8% (217,336) |
| Georgia: | 9.8% (399,796) |
Number of households with income $75k - 100k:| Philema: | 13.4% (297,288) |
| State: | 13.3% (545,843) |
Number of households with income $100k - 125k:| Philema: | 9.9% (220,030) |
| Georgia: | 9.9% (404,546) |
Number of households with income $125k - 150k:| Philema: | 7.0% (155,720) |
| State: | 7.0% (286,306) |
Number of households with income $150k - 200k:| Philema: | 8.2% (181,932) |
| Georgia: | 8.2% (335,507) |
Number of households with income > $200k:| Philema: | 10.1% (224,398) |
| State: | 10.2% (416,602) |
Aggregate household income in Philema in 2022: $11,424,381,472
Median family income in Philema in 2022:| Philema: | $88,583 |
| State: | $86,642 |
Median non-family income in Philema in 2022:| Philema: | $50,781 |
| State: | $44,656 |
Change in median non-family income between 2000 and 2022:| Philema, Georgia: | +68.2% |
| State: | +68.5% |
Median per capita income in Philema in 2022:| Philema: | $34,333 |
| State: | $38,378 |
Change in median per capita income between 2000 and 2022:| Philema, Georgia: | +82.1% |
| State: | +81.4% |
Income statistics for White residents
Median household income in Philema, GA in 2022:| Philema: | $81,273 |
| Georgia: | $82,397 |
Change in median household income between 2000 and 2022:| Philema, Georgia: | +73.3% |
| Georgia: | +72.3% |
Number of households with income < $10k:| Philema: | 4.1% (45,699) |
| Georgia: | 4.1% (92,223) |
Number of households with income $10k - 20k:| Philema: | 5.8% (65,075) |
| Georgia: | 5.7% (129,017) |
Number of households with income $20k - 30k:| Philema: | 6.3% (70,264) |
| State: | 6.2% (140,832) |
Number of households with income $30k - 40k:| Philema: | 6.5% (72,566) |
| State: | 6.4% (144,887) |
Number of households with income $40k - 50k:| Philema: | 7.1% (78,729) |
| State: | 7.0% (157,922) |
Number of households with income $50k - 60k:| Philema: | 6.8% (75,936) |
| Georgia: | 6.8% (153,079) |
Number of households with income $60k - 75k:| Philema: | 9.4% (104,877) |
| Georgia: | 9.4% (211,282) |
Number of households with income $75k - 100k:| Philema: | 13.6% (151,883) |
| Georgia: | 13.6% (306,007) |
Number of households with income $100k - 125k:| Philema: | 10.5% (116,976) |
| State: | 10.5% (236,501) |
Number of households with income $125k - 150k:| Philema: | 7.9% (88,116) |
| State: | 7.9% (178,986) |
Number of households with income $150k - 200k:| Philema: | 9.5% (105,325) |
| Georgia: | 9.6% (216,095) |
Number of households with income > $200k:| Philema: | 12.4% (137,543) |
| State: | 12.7% (286,989) |
Aggregate household income in Philema in 2022: $6,251,380,234
Median family income in Philema in 2022:| Philema: | $88,804 |
| Georgia: | $99,049 |
Number of families with income < $10k:| Philema: | 3.4% (55) |
| State: | 2.2% (33,594) |
Number of families with income $10k - 20k:| Philema: | 2.6% (42) |
| Georgia: | 2.8% (42,787) |
Number of families with income $20k - 30k:| Philema: | 3.7% (60) |
| State: | 4.0% (60,599) |
Number of families with income $30k - 40k:| Philema: | 5.8% (94) |
| State: | 5.1% (78,242) |
Number of families with income $40k - 50k:| Philema: | 10.7% (174) |
| Georgia: | 6.2% (94,652) |
Number of families with income $50k - 60k:| Philema: | 8.1% (130) |
| State: | 6.2% (95,179) |
Number of families with income $60k - 75k:| Philema: | 7.5% (122) |
| Georgia: | 9.2% (141,002) |
Number of families with income $75k - 100k:| Philema: | 18.0% (291) |
| Georgia: | 14.7% (224,392) |
Number of families with income $100k - 125k:| Philema: | 12.8% (206) |
| State: | 11.9% (181,130) |
Number of families with income $125k - 150k:| Philema: | 8.4% (136) |
| Georgia: | 9.3% (141,570) |
Number of families with income $150k - 200k:| Philema: | 6.9% (112) |
| Georgia: | 11.8% (180,140) |
Number of families with income > $200k:| Philema: | 12.0% (194) |
| State: | 16.5% (251,188) |
Median non-family income in Philema in 2022:| Philema: | $53,781 |
| State: | $48,516 |
Change in median non-family income between 2000 and 2022:| Philema, Georgia: | +71.7% |
| State: | +68.6% |
Median per capita income in Philema in 2022:| Philema: | $36,367 |
| State: | $45,764 |
Change in median per capita income between 2000 and 2022:| Philema, Georgia: | +86.6% |
| State: | +85.1% |
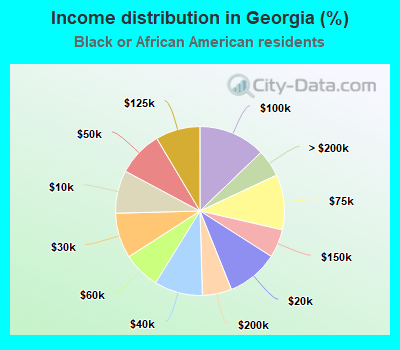
Income statistics for Black or African American residents
Median household income in Philema, GA in 2022:| Philema: | $78,420 |
| State: | $57,293 |
Change in median household income between 2000 and 2022:| Philema, Georgia: | +82.8% |
| State: | +84.8% |
Number of households with income < $10k:| Philema: | 8.3% (72,671) |
| State: | 8.2% (104,281) |
Number of households with income $10k - 20k:| Philema: | 10.0% (88,049) |
| State: | 9.9% (125,572) |
Number of households with income $20k - 30k:| Philema: | 8.7% (76,973) |
| State: | 8.7% (109,854) |
Number of households with income $30k - 40k:| Philema: | 9.3% (81,722) |
| State: | 9.3% (117,673) |
Number of households with income $40k - 50k:| Philema: | 8.6% (75,885) |
| Georgia: | 8.6% (109,631) |
Number of households with income $50k - 60k:| Philema: | 7.1% (62,530) |
| State: | 7.1% (89,835) |
Number of households with income $60k - 75k:| Philema: | 10.5% (92,324) |
| State: | 10.6% (133,810) |
Number of households with income $75k - 100k:| Philema: | 12.8% (112,674) |
| Georgia: | 12.8% (162,675) |
Number of households with income $100k - 125k:| Philema: | 8.5% (74,634) |
| State: | 8.5% (108,361) |
Number of households with income $125k - 150k:| Philema: | 5.4% (47,759) |
| State: | 5.4% (69,094) |
Number of households with income $150k - 200k:| Philema: | 5.6% (49,296) |
| State: | 5.6% (71,287) |
Number of households with income > $200k:| Philema: | 5.2% (45,320) |
| Georgia: | 5.2% (66,089) |
Aggregate household income in Philema in 2022: $263,597,996
Median family income in Philema in 2022:| Philema: | $101,332 |
| State: | $68,633 |
Number of families with income < $10k:| Philema: | 3.7% (13) |
| State: | 6.6% (51,835) |
Number of families with income $10k - 20k:| Philema: | 1.0% (4) |
| State: | 5.7% (45,319) |
Number of families with income $20k - 30k:| Philema: | 9.9% (35) |
| Georgia: | 7.6% (59,822) |
Number of families with income $30k - 40k:| Philema: | 1.9% (7) |
| Georgia: | 8.2% (64,344) |
Number of families with income $40k - 50k:| Philema: | 3.0% (10) |
| State: | 8.4% (66,235) |
Number of families with income $50k - 60k:| Philema: | 9.5% (34) |
| Georgia: | 7.3% (57,291) |
Number of families with income $60k - 75k:| Philema: | 19.0% (67) |
| State: | 10.9% (85,758) |
Number of families with income $75k - 100k:| Philema: | 12.0% (43) |
| State: | 13.8% (108,499) |
Number of families with income $100k - 125k:| Philema: | 12.4% (44) |
| Georgia: | 10.4% (81,983) |
Number of families with income $150k - 200k:| Philema: | 27.5% (97) |
| Georgia: | 7.3% (57,526) |
Median non-family income in Philema in 2022:| Philema: | $28,660 |
| Georgia: | $37,692 |
Change in median non-family income between 2000 and 2022:| Philema, Georgia: | +85.9% |
| State: | +80.0% |
Median per capita income in Philema in 2022:| Philema: | $33,829 |
| State: | $29,935 |
Change in median per capita income between 2000 and 2022:| Philema, Georgia: | +105.0% |
| State: | +108.3% |
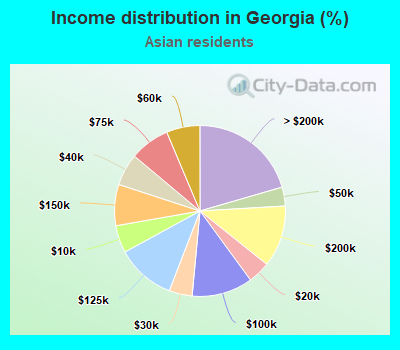
Income statistics for Asian residents
Median household income in Philema, GA in 2022:| Philema: | $46,932 |
| State: | $102,973 |
Change in median household income between 2000 and 2022:| Philema, Georgia: | +111.5% |
| Georgia: | +103.9% |
Number of households with income < $10k:| Philema: | 5.2% (1,881) |
| State: | 5.2% (8,565) |
Number of households with income $10k - 20k:| Philema: | 4.2% (1,531) |
| State: | 4.2% (6,959) |
Number of households with income $20k - 30k:| Philema: | 4.4% (1,585) |
| Georgia: | 4.4% (7,214) |
Number of households with income $30k - 40k:| Philema: | 6.1% (2,200) |
| Georgia: | 6.1% (10,007) |
Number of households with income $40k - 50k:| Philema: | 3.6% (1,292) |
| State: | 3.6% (5,876) |
Number of households with income $50k - 60k:| Philema: | 6.3% (2,292) |
| State: | 6.3% (10,440) |
Number of households with income $60k - 75k:| Philema: | 7.6% (2,737) |
| Georgia: | 7.6% (12,457) |
Number of households with income $75k - 100k:| Philema: | 11.5% (4,173) |
| State: | 11.5% (18,974) |
Number of households with income $100k - 125k:| Philema: | 11.2% (4,055) |
| State: | 11.2% (18,431) |
Number of households with income $125k - 150k:| Philema: | 7.8% (2,814) |
| State: | 7.8% (12,835) |
Number of households with income $150k - 200k:| Philema: | 11.7% (4,236) |
| State: | 11.7% (19,219) |
Number of households with income > $200k:| Philema: | 20.5% (7,425) |
| State: | 20.5% (33,791) |
Aggregate household income in Philema in 2022: $6,466,400
Median family income in Philema in 2022:| Philema: | $45,319 |
| Georgia: | $114,577 |
Number of families with income $20k - 30k:| Philema: | 40.6% (13) |
| State: | 3.9% (4,912) |
Number of families with income $60k - 75k:| Philema: | 59.4% (19) |
| Georgia: | 7.5% (9,540) |
Median per capita income in Philema in 2022:| Philema: | $27,998 |
| State: | $47,657 |
Change in median per capita income between 2000 and 2022:| Philema, Georgia: | +136.5% |
| Georgia: | +136.5% |
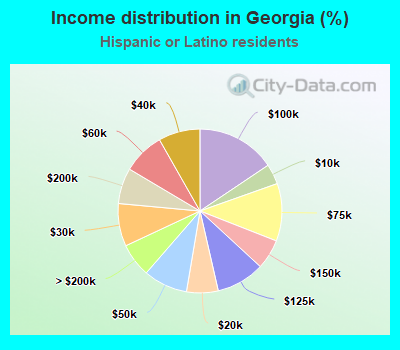
Income statistics for Hispanic or Latino residents
Median household income in Philema, GA in 2022:| Philema: | $91,961 |
| State: | $67,547 |
Change in median household income between 2000 and 2022:| Philema, Georgia: | +80.9% |
| State: | +73.0% |
Number of households with income < $10k:| Philema: | 4.0% (8,049) |
| State: | 4.0% (12,188) |
Number of households with income $10k - 20k:| Philema: | 6.3% (12,571) |
| State: | 6.2% (19,063) |
Number of households with income $20k - 30k:| Philema: | 8.5% (16,884) |
| State: | 8.4% (25,797) |
Number of households with income $30k - 40k:| Philema: | 8.2% (16,372) |
| Georgia: | 8.2% (25,127) |
Number of households with income $40k - 50k:| Philema: | 8.8% (17,521) |
| State: | 8.7% (26,632) |
Number of households with income $50k - 60k:| Philema: | 8.2% (16,475) |
| State: | 8.2% (25,168) |
Number of households with income $60k - 75k:| Philema: | 11.3% (22,584) |
| Georgia: | 11.4% (34,734) |
Number of households with income $75k - 100k:| Philema: | 15.5% (31,047) |
| State: | 15.6% (47,647) |
Number of households with income $100k - 125k:| Philema: | 9.6% (19,104) |
| Georgia: | 9.6% (29,177) |
Number of households with income $125k - 150k:| Philema: | 5.9% (11,759) |
| State: | 5.9% (18,075) |
Number of households with income $150k - 200k:| Philema: | 7.0% (14,070) |
| State: | 7.1% (21,562) |
Number of households with income > $200k:| Philema: | 6.7% (13,314) |
| State: | 6.7% (20,315) |
Aggregate household income in Philema in 2022: $9,998,778
Median family income in Philema in 2022:| Philema: | $100,905 |
| State: | $68,723 |
Number of families with income < $10k:| Philema: | 6.6% (16) |
| Georgia: | 4.3% (10,281) |
Number of families with income $10k - 20k:| Philema: | 5.9% (14) |
| State: | 5.4% (12,876) |
Number of families with income $20k - 30k:| Philema: | 8.4% (20) |
| State: | 8.3% (19,945) |
Number of families with income $30k - 40k:| Philema: | 10.3% (25) |
| State: | 8.6% (20,624) |
Number of families with income $40k - 50k:| Philema: | 14.1% (34) |
| State: | 8.2% (19,591) |
Number of families with income $50k - 60k:| Philema: | 10.4% (25) |
| Georgia: | 8.2% (19,635) |
Number of families with income $60k - 75k:| Philema: | 8.1% (19) |
| Georgia: | 11.5% (27,479) |
Number of families with income $75k - 100k:| Philema: | 16.7% (40) |
| Georgia: | 16.1% (38,405) |
Number of families with income $100k - 125k:| Philema: | 7.8% (19) |
| Georgia: | 9.2% (21,972) |
Number of families with income $125k - 150k:| Philema: | 3.8% (9) |
| Georgia: | 5.9% (14,144) |
Number of families with income $150k - 200k:| Philema: | 3.5% (8) |
| Georgia: | 7.7% (18,324) |
Number of families with income > $200k:| Philema: | 4.4% (11) |
| State: | 6.6% (15,814) |
Median per capita income in Philema in 2022:| Philema: | $25,328 |
| State: | $25,080 |
Change in median per capita income between 2000 and 2022:| Philema, Georgia: | +99.4% |
| State: | +99.4% |
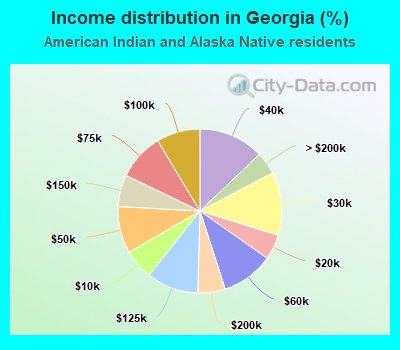
Income statistics for American Indian and Alaska Native residents
Median household income in Philema, GA in 2022:| Philema: | $66,514 |
| State: | $56,084 |
Change in median household income between 2000 and 2022:| Philema, Georgia: | +19.9% |
| State: | +51.3% |
Number of households with income < $10k:| Philema: | 5.9% (1,364) |
| Georgia: | 6.0% (912) |
Number of households with income $10k - 20k:| Philema: | 5.0% (1,137) |
| State: | 5.0% (760) |
Number of households with income $20k - 30k:| Philema: | 12.5% (2,866) |
| State: | 12.5% (1,916) |
Number of households with income $30k - 40k:| Philema: | 12.9% (2,954) |
| State: | 12.9% (1,975) |
Number of households with income $40k - 50k:| Philema: | 9.3% (2,123) |
| State: | 9.3% (1,419) |
Number of households with income $50k - 60k:| Philema: | 10.3% (2,354) |
| State: | 10.3% (1,574) |
Number of households with income $60k - 75k:| Philema: | 9.2% (2,112) |
| State: | 9.2% (1,412) |
Number of households with income $75k - 100k:| Philema: | 8.6% (1,976) |
| State: | 8.6% (1,321) |
Number of households with income $100k - 125k:| Philema: | 10.2% (2,342) |
| State: | 10.2% (1,566) |
Number of households with income $125k - 150k:| Philema: | 6.3% (1,442) |
| Georgia: | 6.3% (964) |
Number of households with income $150k - 200k:| Philema: | 5.4% (1,240) |
| State: | 5.4% (829) |
Number of households with income > $200k:| Philema: | 4.4% (1,016) |
| State: | 4.4% (679) |
Aggregate household income in Philema in 2022: $1,951,646
Median family income in Philema in 2022:| Philema: | $70,282 |
| Georgia: | $56,087 |
Number of families with income $30k - 40k:| Philema: | 29.2% (9) |
| State: | 10.5% (1,265) |
Number of families with income $50k - 60k:| Philema: | 70.8% (21) |
| State: | 10.5% (1,254) |
Median per capita income in Philema in 2022:| Philema: | $16,009 |
| State: | $21,409 |
Change in median per capita income between 2000 and 2022:| Philema, Georgia: | +16.3% |
| Georgia: | +23.5% |
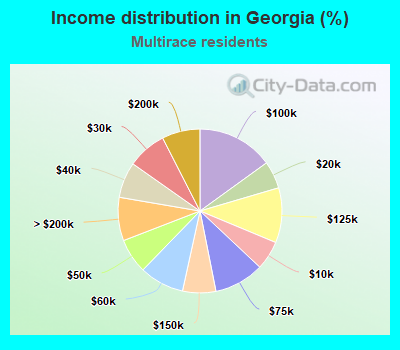
Income statistics for Multirace residents
Median household income in Philema, GA in 2022:| Philema: | $38,871 |
| State: | $72,520 |
Change in median household income between 2000 and 2022:| Philema, Georgia: | +89.4% |
| State: | +85.4% |
Number of households with income < $10k:| Philema: | 5.7% (3,960) |
| State: | 5.7% (14,963) |
Number of households with income $10k - 20k:| Philema: | 5.4% (3,774) |
| Georgia: | 5.4% (14,136) |
Number of households with income $20k - 30k:| Philema: | 7.8% (5,388) |
| State: | 7.7% (20,123) |
Number of households with income $30k - 40k:| Philema: | 7.1% (4,896) |
| Georgia: | 7.1% (18,449) |
Number of households with income $40k - 50k:| Philema: | 6.9% (4,799) |
| State: | 6.9% (17,943) |
Number of households with income $50k - 60k:| Philema: | 8.9% (6,135) |
| Georgia: | 8.8% (22,996) |
Number of households with income $60k - 75k:| Philema: | 9.8% (6,803) |
| Georgia: | 9.9% (25,722) |
Number of households with income $75k - 100k:| Philema: | 15.0% (10,421) |
| State: | 15.0% (39,219) |
Number of households with income $100k - 125k:| Philema: | 10.8% (7,509) |
| State: | 10.8% (28,252) |
Number of households with income $125k - 150k:| Philema: | 6.6% (4,563) |
| State: | 6.6% (17,124) |
Number of households with income $150k - 200k:| Philema: | 7.4% (5,152) |
| State: | 7.5% (19,615) |
Number of households with income > $200k:| Philema: | 8.5% (5,904) |
| State: | 8.6% (22,328) |
Aggregate household income in Philema in 2022: $4,195,024
Median family income in Philema in 2022:| Philema: | $40,422 |
| State: | $79,509 |
Number of families with income $20k - 30k:| Philema: | 100.0% (59) |
| State: | 6.7% (12,255) |
Median non-family income in Philema in 2022:| Philema: | $4,360 |
| Georgia: | $47,017 |
Change in median non-family income between 2000 and 2022:| Philema, Georgia: | +74.5% |
| State: | +77.1% |
Median per capita income in Philema in 2022:| Philema: | $8,162 |
| Georgia: | $28,402 |
Change in median per capita income between 2000 and 2022:| Philema, Georgia: | +104.1% |
| Georgia: | +102.0% |
Income statistics for other residents
Number of households with income < $10k:| Philema: | 8.7% (2) |
| State: | 6.3% (7,985) |
Number of households with income $10k - 20k:| Philema: | 8.7% (2) |
| State: | 7.4% (9,485) |
Number of households with income $20k - 30k:| Philema: | 8.7% (2) |
| State: | 8.2% (10,477) |
Number of households with income $30k - 40k:| Philema: | 8.7% (2) |
| Georgia: | 9.0% (11,439) |
Number of households with income $40k - 50k:| Philema: | 8.7% (2) |
| Georgia: | 10.3% (13,166) |
Number of households with income $50k - 60k:| Philema: | 4.3% (1) |
| State: | 7.5% (9,494) |
Number of households with income $60k - 75k:| Philema: | 13.0% (3) |
| State: | 11.5% (14,661) |
Number of households with income $75k - 100k:| Philema: | 13.0% (3) |
| Georgia: | 13.6% (17,309) |
Number of households with income $100k - 125k:| Philema: | 8.7% (2) |
| State: | 9.0% (11,418) |
Number of households with income $125k - 150k:| Philema: | 4.3% (1) |
| Georgia: | 5.6% (7,128) |
Number of households with income $150k - 200k:| Philema: | 8.7% (2) |
| Georgia: | 6.5% (8,311) |
Number of households with income > $200k:| Philema: | 4.3% (1) |
| State: | 5.1% (6,490) |
Aggregate household income in Philema in 2022: $1,795,464
Median family income in Philema in 2022:| Philema: | $108,500 |
| Georgia: | $61,715 |
Median per capita income in Philema in 2022:| Philema: | $55,800 |
| State: | $23,261 |
Change in median per capita income between 2000 and 2022:| Philema, Georgia: | +107.8% |
| Georgia: | +110.6% |