Plymouth, Maine (ME) income map, earnings map, and wages data
The median household income in Plymouth, ME in 2022 was $58,447, which was 19.0% less than the median annual income of $69,543 across the entire state of Maine. Compared to the median income of $32,768 in 2000 this represents an increase of 43.9%. The per capita income in 2022 was $31,225, which means an increase of 50.3% compared to 2000 when it was $15,533.
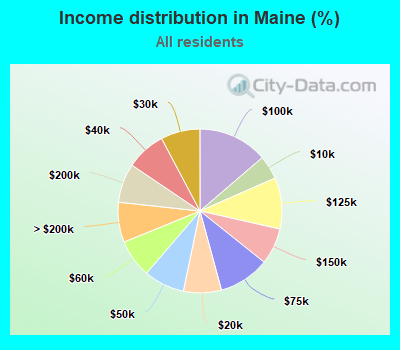
Income statistics for all residents
Median household income in Plymouth, ME in 2022:| Plymouth: | $58,448 |
| State: | $69,543 |
Change in median household income between 2000 and 2022:| Plymouth, Maine: | +78.4% |
| Maine: | +86.7% |
Number of households with income < $10k:| Plymouth: | 5.9% (3,695) |
| Maine: | 4.7% (28,445) |
Number of households with income $10k - 20k:| Plymouth: | 9.9% (6,212) |
| Maine: | 7.5% (45,280) |
Number of households with income $20k - 30k:| Plymouth: | 9.5% (6,004) |
| State: | 7.7% (46,813) |
Number of households with income $30k - 40k:| Plymouth: | 10.3% (6,525) |
| Maine: | 7.8% (47,357) |
Number of households with income $40k - 50k:| Plymouth: | 6.3% (3,943) |
| State: | 8.0% (48,625) |
Number of households with income $50k - 60k:| Plymouth: | 7.3% (4,588) |
| Maine: | 7.5% (45,566) |
Number of households with income $60k - 75k:| Plymouth: | 10.0% (6,287) |
| Maine: | 10.1% (60,924) |
Number of households with income $75k - 100k:| Plymouth: | 12.4% (7,805) |
| Maine: | 13.7% (83,142) |
Number of households with income $100k - 125k:| Plymouth: | 9.4% (5,925) |
| State: | 10.1% (61,186) |
Number of households with income $125k - 150k:| Plymouth: | 7.8% (4,947) |
| Maine: | 7.2% (43,500) |
Number of households with income $150k - 200k:| Plymouth: | 4.8% (3,002) |
| State: | 7.7% (46,696) |
Number of households with income > $200k:| Plymouth: | 6.5% (4,111) |
| Maine: | 7.9% (47,804) |
Aggregate household income in Plymouth in 2022: $49,964,791
Median family income in Plymouth in 2022:| Plymouth: | $69,468 |
| State: | $88,063 |
Median non-family income in Plymouth in 2022:| Plymouth: | $32,252 |
| Maine: | $40,639 |
Change in median non-family income between 2000 and 2022:| Plymouth, Maine: | +58.3% |
| Maine: | +87.1% |
Median per capita income in Plymouth in 2022:| Plymouth: | $31,226 |
| State: | $41,188 |
Change in median per capita income between 2000 and 2022:| Plymouth, Maine: | +101.0% |
| Maine: | +110.9% |
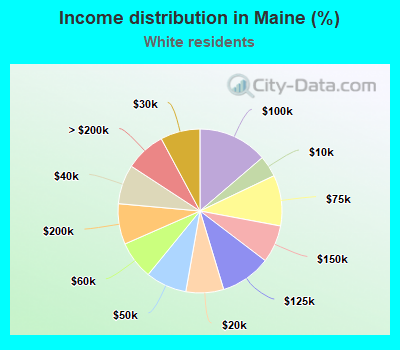
Income statistics for White residents
Median household income in Plymouth, ME in 2022:| Plymouth: | $58,533 |
| State: | $70,228 |
Change in median household income between 2000 and 2022:| Plymouth, Maine: | +77.9% |
| State: | +87.7% |
Number of households with income < $10k:| Plymouth: | 5.4% (3,187) |
| Maine: | 4.2% (23,567) |
Number of households with income $10k - 20k:| Plymouth: | 9.2% (5,401) |
| State: | 7.4% (41,770) |
Number of households with income $20k - 30k:| Plymouth: | 9.6% (5,612) |
| State: | 7.8% (43,842) |
Number of households with income $30k - 40k:| Plymouth: | 10.8% (6,301) |
| State: | 7.8% (43,575) |
Number of households with income $40k - 50k:| Plymouth: | 6.5% (3,779) |
| Maine: | 8.1% (45,444) |
Number of households with income $50k - 60k:| Plymouth: | 7.5% (4,385) |
| State: | 7.5% (42,240) |
Number of households with income $60k - 75k:| Plymouth: | 9.9% (5,770) |
| Maine: | 10.0% (56,153) |
Number of households with income $75k - 100k:| Plymouth: | 11.8% (6,935) |
| State: | 13.7% (76,982) |
Number of households with income $100k - 125k:| Plymouth: | 9.6% (5,650) |
| State: | 10.0% (55,945) |
Number of households with income $125k - 150k:| Plymouth: | 8.4% (4,895) |
| Maine: | 7.4% (41,559) |
Number of households with income $150k - 200k:| Plymouth: | 4.9% (2,881) |
| State: | 8.0% (44,909) |
Number of households with income > $200k:| Plymouth: | 6.4% (3,759) |
| State: | 8.0% (44,738) |
Aggregate household income in Plymouth in 2022: $46,073,873
Median family income in Plymouth in 2022:| Plymouth: | $71,158 |
| Maine: | $89,589 |
Number of families with income < $10k:| Plymouth: | 4.1% (13) |
| State: | 1.7% (5,845) |
Number of families with income $10k - 20k:| Plymouth: | 7.4% (23) |
| Maine: | 3.2% (10,865) |
Number of families with income $20k - 30k:| Plymouth: | 5.6% (17) |
| State: | 4.4% (15,170) |
Number of families with income $30k - 40k:| Plymouth: | 10.2% (32) |
| State: | 6.2% (21,234) |
Number of families with income $40k - 50k:| Plymouth: | 4.9% (15) |
| Maine: | 7.0% (23,965) |
Number of families with income $50k - 60k:| Plymouth: | 6.6% (21) |
| Maine: | 7.6% (26,226) |
Number of families with income $60k - 75k:| Plymouth: | 12.3% (38) |
| State: | 10.6% (36,513) |
Number of families with income $75k - 100k:| Plymouth: | 9.0% (28) |
| Maine: | 15.3% (52,781) |
Number of families with income $100k - 125k:| Plymouth: | 9.9% (31) |
| State: | 12.7% (43,845) |
Number of families with income $125k - 150k:| Plymouth: | 25.6% (80) |
| State: | 9.4% (32,319) |
Number of families with income > $200k:| Plymouth: | 4.4% (14) |
| State: | 11.3% (39,003) |
Median non-family income in Plymouth in 2022:| Plymouth: | $32,600 |
| Maine: | $40,779 |
Change in median non-family income between 2000 and 2022:| Plymouth, Maine: | +60.0% |
| State: | +87.4% |
Median per capita income in Plymouth in 2022:| Plymouth: | $31,134 |
| State: | $41,797 |
Change in median per capita income between 2000 and 2022:| Plymouth, Maine: | +98.7% |
| State: | +111.9% |
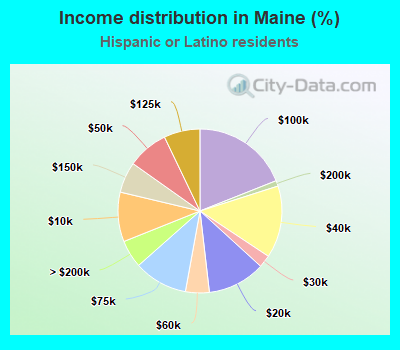
Income statistics for Hispanic or Latino residents
Median household income in Plymouth, ME in 2022:| Plymouth: | $28,630 |
| Maine: | $58,750 |
Change in median household income between 2000 and 2022:| Plymouth, Maine: | +108.2% |
| State: | +62.2% |
Number of households with income < $10k:| Plymouth: | 9.8% (335) |
| State: | 9.8% (882) |
Number of households with income $10k - 20k:| Plymouth: | 11.4% (389) |
| Maine: | 11.4% (1,027) |
Number of households with income $20k - 30k:| Plymouth: | 2.5% (84) |
| State: | 2.5% (221) |
Number of households with income $30k - 40k:| Plymouth: | 14.2% (487) |
| State: | 14.2% (1,284) |
Number of households with income $40k - 50k:| Plymouth: | 8.1% (276) |
| State: | 8.1% (727) |
Number of households with income $50k - 60k:| Plymouth: | 4.7% (161) |
| State: | 4.7% (423) |
Number of households with income $60k - 75k:| Plymouth: | 10.6% (363) |
| State: | 10.6% (956) |
Number of households with income $75k - 100k:| Plymouth: | 19.0% (649) |
| State: | 19.0% (1,711) |
Number of households with income $100k - 125k:| Plymouth: | 7.1% (244) |
| State: | 7.1% (642) |
Number of households with income $125k - 150k:| Plymouth: | 6.1% (208) |
| State: | 6.1% (549) |
Number of households with income $150k - 200k:| Plymouth: | 1.1% (38) |
| Maine: | 1.1% (99) |
Number of households with income > $200k:| Plymouth: | 5.5% (187) |
| State: | 5.5% (493) |
Aggregate household income in Plymouth in 2022: $208,102
Median family income in Plymouth in 2022:| Plymouth: | $12,391 |
| State: | $60,202 |
Median per capita income in Plymouth in 2022:| Plymouth: | $23,706 |
| Maine: | $31,794 |
Change in median per capita income between 2000 and 2022:| Plymouth, Maine: | +89.1% |
| State: | +114.2% |
Income statistics for American Indian and Alaska Native residents
Number of households with income < $10k:| Plymouth: | 15.5% (176) |
| State: | 15.5% (498) |
Number of households with income $10k - 20k:| Plymouth: | 10.9% (124) |
| State: | 11.0% (351) |
Number of households with income $20k - 30k:| Plymouth: | 10.0% (113) |
| State: | 10.0% (319) |
Number of households with income $30k - 40k:| Plymouth: | 4.1% (47) |
| State: | 4.1% (131) |
Number of households with income $40k - 50k:| Plymouth: | 1.5% (17) |
| State: | 1.5% (49) |
Number of households with income $50k - 60k:| Plymouth: | 2.4% (27) |
| Maine: | 2.4% (76) |
Number of households with income $60k - 75k:| Plymouth: | 22.4% (254) |
| Maine: | 22.4% (718) |
Number of households with income $75k - 100k:| Plymouth: | 17.0% (193) |
| State: | 17.0% (546) |
Number of households with income $100k - 125k:| Plymouth: | 5.4% (61) |
| State: | 5.4% (172) |
Number of households with income $125k - 150k:| Plymouth: | 5.8% (66) |
| Maine: | 5.8% (186) |
Number of households with income $150k - 200k:| Plymouth: | 1.1% (12) |
| Maine: | 1.1% (34) |
Number of households with income > $200k:| Plymouth: | 3.9% (44) |
| State: | 3.8% (123) |
Median per capita income in Plymouth in 2022:| Plymouth: | $9,925 |
| State: | $30,025 |
Change in median per capita income between 2000 and 2022:| Plymouth, Maine: | +120.6% |
| State: | +136.4% |
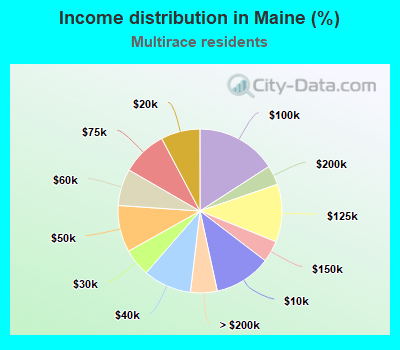
Income statistics for Multirace residents
Median household income in Plymouth, ME in 2022:| Plymouth: | $26,818 |
| State: | $59,540 |
Change in median household income between 2000 and 2022:| Plymouth, Maine: | +16.0% |
| State: | +118.6% |
Number of households with income < $10k:| Plymouth: | 11.3% (1,242) |
| State: | 11.2% (2,930) |
Number of households with income $10k - 20k:| Plymouth: | 7.7% (845) |
| State: | 7.7% (2,015) |
Number of households with income $20k - 30k:| Plymouth: | 5.5% (605) |
| State: | 5.5% (1,422) |
Number of households with income $30k - 40k:| Plymouth: | 9.6% (1,054) |
| Maine: | 9.5% (2,484) |
Number of households with income $40k - 50k:| Plymouth: | 9.1% (998) |
| State: | 9.2% (2,405) |
Number of households with income $50k - 60k:| Plymouth: | 7.2% (796) |
| State: | 7.3% (1,893) |
Number of households with income $60k - 75k:| Plymouth: | 8.9% (981) |
| State: | 8.9% (2,330) |
Number of households with income $75k - 100k:| Plymouth: | 15.9% (1,744) |
| Maine: | 15.9% (4,140) |
Number of households with income $100k - 125k:| Plymouth: | 11.4% (1,251) |
| State: | 11.4% (2,972) |
Number of households with income $125k - 150k:| Plymouth: | 4.2% (467) |
| State: | 4.2% (1,106) |
Number of households with income $150k - 200k:| Plymouth: | 3.9% (427) |
| Maine: | 3.9% (1,008) |
Number of households with income > $200k:| Plymouth: | 5.3% (581) |
| Maine: | 5.3% (1,377) |
Aggregate household income in Plymouth in 2022: $2,342,122
Median family income in Plymouth in 2022:| Plymouth: | $47,828 |
| State: | $74,759 |
Number of families with income < $10k:| Plymouth: | 20.6% (11) |
| Maine: | 6.9% (1,010) |
Number of families with income $20k - 30k:| Plymouth: | 6.4% (3) |
| State: | 5.9% (858) |
Number of families with income $100k - 125k:| Plymouth: | 73.1% (40) |
| Maine: | 11.5% (1,684) |
Median per capita income in Plymouth in 2022:| Plymouth: | $36,804 |
| Maine: | $32,995 |