The median household income in Red Boiling Springs, TN in 2022 was $30,617, which was 113.1% less than the median annual income of $65,254 across the entire state of Tennessee. Compared to the median income of $19,868 in 2000 this represents an increase of 35.1%. The per capita income in 2022 was $12,985, which means a decrease of 9.9% compared to 2000 when it was $14,274.
Whole page based on the data from 2000 / 2022 when the population of Red Boiling Springs, Tennessee was 1,023 / 1,372
Income statistics for all residents
Median household income in Red Boiling Springs, TN in 2022:
Red Boiling Springs:
$30,618
State:
$65,254
Change in median household income between 2000 and 2022:
Red Boiling Springs, Tennessee:
+54.1%
State:
+79.5%
Number of households with income < $10k:
Red Boiling Springs:
8.2% (34)
State:
5.4% (154,793)
Number of households with income $10k - 20k:
Red Boiling Springs:
23.0% (96)
State:
8.0% (228,599)
Number of households with income $20k - 30k:
Red Boiling Springs:
17.0% (71)
State:
7.9% (224,908)
Number of households with income $30k - 40k:
Red Boiling Springs:
14.6% (61)
Tennessee:
8.6% (244,297)
Number of households with income $40k - 50k:
Red Boiling Springs:
7.0% (29)
Tennessee:
8.4% (238,949)
Number of households with income $50k - 60k:
Red Boiling Springs:
10.1% (42)
State:
7.7% (218,438)
Number of households with income $60k - 75k:
Red Boiling Springs:
8.6% (36)
State:
10.3% (294,172)
Number of households with income $75k - 100k:
Red Boiling Springs:
6.5% (27)
State:
13.3% (377,310)
Number of households with income $100k - 125k:
Red Boiling Springs:
4.1% (17)
State:
9.5% (269,124)
Number of households with income $125k - 150k:
Red Boiling Springs:
1.0% (4)
Tennessee:
6.3% (178,328)
Number of households with income $150k - 200k:
Red Boiling Springs:
0.0% (0)
State:
7.2% (204,030)
Number of households with income > $200k:
Red Boiling Springs:
0.0% (0)
Tennessee:
7.5% (213,736)
Aggregate household income in Red Boiling Springs in 2022: $15,900,234
Median family income in Red Boiling Springs in 2022:
Red Boiling Springs:
$33,710
Tennessee:
$80,910
Number of families with income < $10k:
Red Boiling Springs:
13.9% (40)
State:
3.9% (72,917)
Number of families with income $10k - 20k:
Red Boiling Springs:
9.5% (27)
Tennessee:
4.0% (73,770)
Number of families with income $20k - 30k:
Red Boiling Springs:
16.4% (47)
Tennessee:
5.6% (104,070)
Number of families with income $30k - 40k:
Red Boiling Springs:
22.9% (65)
Tennessee:
7.2% (133,292)
Number of families with income $40k - 50k:
Red Boiling Springs:
6.7% (19)
State:
7.4% (136,997)
Number of families with income $50k - 60k:
Red Boiling Springs:
6.0% (17)
State:
7.1% (131,374)
Number of families with income $60k - 75k:
Red Boiling Springs:
9.2% (26)
State:
10.8% (198,685)
Number of families with income $75k - 100k:
Red Boiling Springs:
9.5% (27)
Tennessee:
15.1% (279,195)
Number of families with income $100k - 125k:
Red Boiling Springs:
4.4% (12)
State:
11.7% (216,356)
Number of families with income $125k - 150k:
Red Boiling Springs:
1.4% (4)
Tennessee:
7.8% (144,000)
Median non-family income in Red Boiling Springs in 2022:
Red Boiling Springs:
$20,278
State:
$40,285
Change in median non-family income between 2000 and 2022:
Red Boiling Springs, Tennessee:
+97.3%
State:
+91.5%
Median per capita income in Red Boiling Springs in 2022:
Red Boiling Springs:
$12,986
State:
$36,704
Change in median per capita income between 2000 and 2022:: -9.0%
Red Boiling Springs, Tennessee:
-9.0%
State:
+89.3%
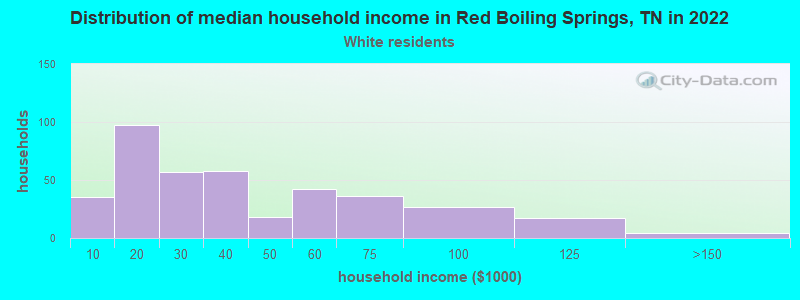
Income statistics for White residents
Median household income in Red Boiling Springs, TN in 2022:
Red Boiling Springs:
$30,763
State:
$69,826
Change in median household income between 2000 and 2022:
Red Boiling Springs, Tennessee:
+61.8%
Tennessee:
+82.9%
Number of households with income < $10k:
Red Boiling Springs:
9.0% (35)
Tennessee:
4.6% (100,279)
Number of households with income $10k - 20k:
Red Boiling Springs:
24.8% (97)
State:
7.6% (165,031)
Number of households with income $20k - 30k:
Red Boiling Springs:
14.6% (57)
Tennessee:
7.4% (160,229)
Number of households with income $30k - 40k:
Red Boiling Springs:
14.8% (58)
State:
8.1% (174,784)
Number of households with income $40k - 50k:
Red Boiling Springs:
4.6% (18)
State:
7.8% (169,622)
Number of households with income $50k - 60k:
Red Boiling Springs:
10.7% (42)
State:
7.6% (165,508)
Number of households with income $60k - 75k:
Red Boiling Springs:
9.2% (36)
State:
10.3% (223,937)
Number of households with income $75k - 100k:
Red Boiling Springs:
6.9% (27)
State:
13.5% (292,688)
Number of households with income $100k - 125k:
Red Boiling Springs:
4.3% (17)
State:
10.1% (219,251)
Number of households with income $125k - 150k:
Red Boiling Springs:
1.0% (4)
State:
6.6% (142,574)
Number of households with income $150k - 200k:
Red Boiling Springs:
0.0% (0)
Tennessee:
7.7% (166,039)
Number of households with income > $200k:
Red Boiling Springs:
0.0% (0)
State:
8.5% (184,546)
Aggregate household income in Red Boiling Springs in 2022: $14,921,102
Median family income in Red Boiling Springs in 2022:
Red Boiling Springs:
$34,672
Tennessee:
$86,015
Number of families with income < $10k:
Red Boiling Springs:
15.5% (40)
State:
3.1% (43,751)
Number of families with income $10k - 20k:
Red Boiling Springs:
10.6% (27)
State:
3.5% (49,925)
Number of families with income $20k - 30k:
Red Boiling Springs:
13.0% (34)
Tennessee:
5.0% (70,431)
Number of families with income $30k - 40k:
Red Boiling Springs:
24.0% (62)
State:
6.6% (93,498)
Number of families with income $40k - 50k:
Red Boiling Springs:
3.6% (9)
Tennessee:
6.8% (96,726)
Number of families with income $50k - 60k:
Red Boiling Springs:
6.7% (17)
Tennessee:
7.2% (101,879)
Number of families with income $60k - 75k:
Red Boiling Springs:
10.0% (26)
State:
10.7% (151,997)
Number of families with income $75k - 100k:
Red Boiling Springs:
10.2% (26)
State:
15.4% (218,373)
Number of families with income $100k - 125k:
Red Boiling Springs:
4.8% (12)
State:
12.6% (178,761)
Number of families with income $125k - 150k:
Red Boiling Springs:
1.6% (4)
State:
8.2% (116,575)
Median non-family income in Red Boiling Springs in 2022:
Red Boiling Springs:
$20,032
Tennessee:
$41,178
Change in median non-family income between 2000 and 2022:
Red Boiling Springs, Tennessee:
+94.9%
Tennessee:
+91.1%
Median per capita income in Red Boiling Springs in 2022:
Red Boiling Springs:
$14,797
State:
$40,126
Change in median per capita income between 2000 and 2022:
Red Boiling Springs, Tennessee:
+6.6%
State:
+92.6%
Income statistics for Black or African American residents
Median per capita income in Red Boiling Springs in 2022:
Red Boiling Springs:
$10,362
State:
$27,306
Income statistics for Hispanic or Latino residents
Aggregate household income in Red Boiling Springs in 2022: $2,978,538
Median per capita income in Red Boiling Springs in 2022:
Red Boiling Springs:
$7,527
State:
$21,276
Change in median per capita income between 2000 and 2022:
Red Boiling Springs, Tennessee:
+30.3%
State:
+76.0%
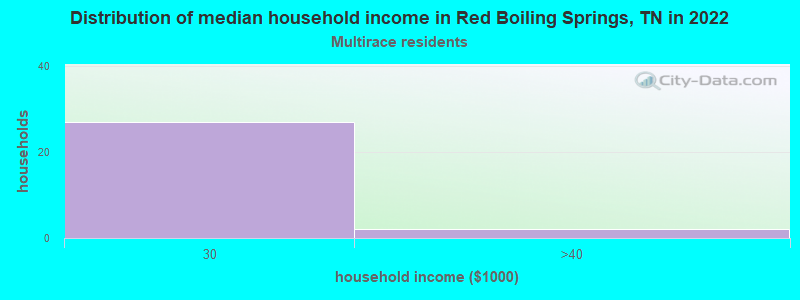
Income statistics for Multirace residents
Median household income in Red Boiling Springs, TN in 2022:
Red Boiling Springs:
$21,569
State:
$57,741
Change in median household income between 2000 and 2022:: -17.8%
Red Boiling Springs, Tennessee:
-17.8%
State:
+87.1%
Number of households with income < $10k:
Red Boiling Springs:
0.0% (0)
State:
6.7% (9,867)
Number of households with income $10k - 20k:
Red Boiling Springs:
0.0% (0)
State:
8.6% (12,639)
Number of households with income $20k - 30k:
Red Boiling Springs:
93.1% (27)
State:
9.2% (13,555)
Number of households with income $30k - 40k:
Red Boiling Springs:
6.9% (2)
State:
10.3% (15,117)
Number of households with income $40k - 50k:
Red Boiling Springs:
0.0% (0)
Tennessee:
9.4% (13,829)
Number of households with income $50k - 60k:
Red Boiling Springs:
0.0% (0)
Tennessee:
7.5% (10,969)
Number of households with income $60k - 75k:
Red Boiling Springs:
0.0% (0)
Tennessee:
9.2% (13,568)
Number of households with income $75k - 100k:
Red Boiling Springs:
0.0% (0)
State:
12.6% (18,516)
Number of households with income $100k - 125k:
Red Boiling Springs:
0.0% (0)
Tennessee:
8.6% (12,656)
Number of households with income $125k - 150k:
Red Boiling Springs:
0.0% (0)
State:
5.9% (8,674)
Number of households with income $150k - 200k:
Red Boiling Springs:
0.0% (0)
State:
7.2% (10,611)
Number of households with income > $200k:
Red Boiling Springs:
0.0% (0)
State:
4.8% (6,986)
Aggregate household income in Red Boiling Springs in 2022: $468,317
Median family income in Red Boiling Springs in 2022:
Red Boiling Springs:
$22,856
State:
$70,058
Number of families with income $20k - 30k:
Red Boiling Springs:
95.2% (28)
Tennessee:
7.7% (7,412)
Number of families with income $30k - 40k:
Red Boiling Springs:
4.8% (1)
State:
9.0% (8,699)
Median per capita income in Red Boiling Springs in 2022:
Red Boiling Springs:
$6,065
State:
$24,436
Change in median per capita income between 2000 and 2022:: -65.0%
Red Boiling Springs, Tennessee:
-65.0%
State:
+84.3%
Income statistics for other residents
Aggregate household income in Red Boiling Springs in 2022: $266,965
Median per capita income in Red Boiling Springs in 2022:
Red Boiling Springs:
$7,332
State:
$21,430
Change in median per capita income between 2000 and 2022:: -13.5%
Red Boiling Springs, Tennessee:
-13.5%
State:
+105.6%
Discuss Red Boiling Springs, Tennessee (TN) on our hugely popular Tennessee forum.