Rossmore, West Virginia (WV) income map, earnings map, and wages data

Data:
The per capita income in 2022 was $31,533, which means an increase of 55.3% compared to 2000 when it was $14,102.
Whole page based on the data from 2000 / 2022 when the population of Rossmore, West Virginia was 301 / 84
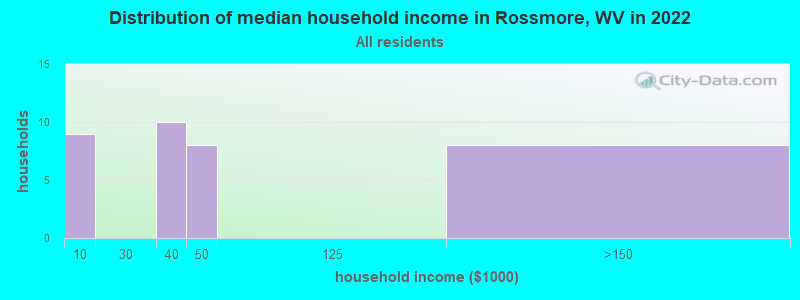
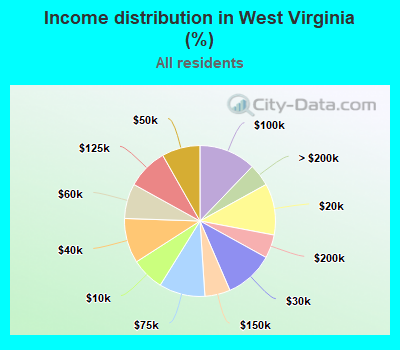
Income statistics for all residents
Number of households with income < $10k:| Rossmore: | 25.7% (9) |
| State: | 7.1% (52,185) |
Number of households with income $10k - 20k:| Rossmore: | 0.0% (0) |
| State: | 11.0% (81,114) |
Number of households with income $20k - 30k:| Rossmore: | 0.0% (0) |
| State: | 10.5% (77,246) |
Number of households with income $30k - 40k:| Rossmore: | 28.6% (10) |
| West Virginia: | 9.6% (70,812) |
Number of households with income $40k - 50k:| Rossmore: | 22.9% (8) |
| West Virginia: | 8.2% (60,448) |
Number of households with income $50k - 60k:| Rossmore: | 0.0% (0) |
| State: | 7.5% (55,191) |
Number of households with income $60k - 75k:| Rossmore: | 0.0% (0) |
| State: | 9.9% (72,717) |
Number of households with income $75k - 100k:| Rossmore: | 0.0% (0) |
| West Virginia: | 12.2% (89,685) |
Number of households with income $100k - 125k:| Rossmore: | 0.0% (0) |
| West Virginia: | 8.8% (64,450) |
Number of households with income $125k - 150k:| Rossmore: | 22.9% (8) |
| West Virginia: | 5.4% (39,984) |
Number of households with income $150k - 200k:| Rossmore: | 0.0% (0) |
| State: | 5.1% (37,216) |
Number of households with income > $200k:| Rossmore: | 0.0% (0) |
| West Virginia: | 4.8% (35,293) |
Aggregate household income in Rossmore in 2022: $1,902,341
Median per capita income in Rossmore in 2022:| Rossmore: | $31,533 |
| State: | $31,922 |
Change in median per capita income between 2000 and 2022:| Rossmore, West Virginia: | +123.6% |
| State: | +93.7% |
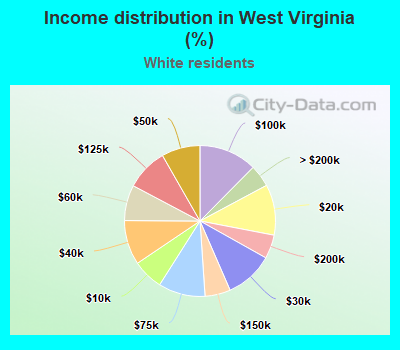
Income statistics for White residents
Number of households with income < $10k:| Rossmore: | 25.7% (9) |
| State: | 6.6% (44,487) |
Number of households with income $10k - 20k:| Rossmore: | 0.0% (0) |
| State: | 10.8% (73,331) |
Number of households with income $20k - 30k:| Rossmore: | 0.0% (0) |
| West Virginia: | 10.3% (70,092) |
Number of households with income $30k - 40k:| Rossmore: | 28.6% (10) |
| State: | 9.6% (64,693) |
Number of households with income $40k - 50k:| Rossmore: | 22.9% (8) |
| State: | 8.3% (55,937) |
Number of households with income $50k - 60k:| Rossmore: | 0.0% (0) |
| West Virginia: | 7.6% (51,718) |
Number of households with income $60k - 75k:| Rossmore: | 0.0% (0) |
| State: | 10.1% (68,097) |
Number of households with income $75k - 100k:| Rossmore: | 0.0% (0) |
| West Virginia: | 12.4% (84,323) |
Number of households with income $100k - 125k:| Rossmore: | 0.0% (0) |
| State: | 9.0% (60,937) |
Number of households with income $125k - 150k:| Rossmore: | 22.9% (8) |
| West Virginia: | 5.5% (36,957) |
Number of households with income $150k - 200k:| Rossmore: | 0.0% (0) |
| West Virginia: | 5.1% (34,631) |
Number of households with income > $200k:| Rossmore: | 0.0% (0) |
| State: | 4.7% (32,099) |
Aggregate household income in Rossmore in 2022: $1,889,702
Median per capita income in Rossmore in 2022:| Rossmore: | $31,712 |
| West Virginia: | $32,764 |
Change in median per capita income between 2000 and 2022:| Rossmore, West Virginia: | +124.0% |
| State: | +97.2% |