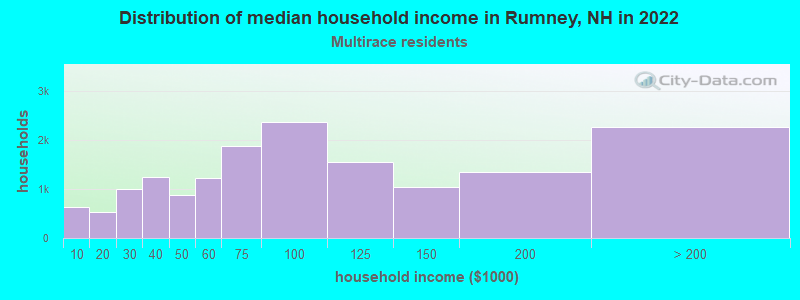
Rumney, New Hampshire (NH) income map, earnings map, and wages data
The median household income in Rumney, NH in 2022 was $74,542, which was 20.7% less than the median annual income of $89,992 across the entire state of New Hampshire. Compared to the median income of $38,125 in 2000 this represents an increase of 48.9%. The per capita income in 2022 was $39,042, which means an increase of 56.0% compared to 2000 when it was $17,169.
Income statistics for all residents
Median household income in Rumney, NH in 2022:| Rumney: | $74,543 |
| State: | $89,992 |
Change in median household income between 2000 and 2022:| Rumney, New Hampshire: | +95.5% |
| State: | +81.9% |
Number of households with income < $10k:| Rumney: | 4.8% (1,638) |
| State: | 3.1% (17,541) |
Number of households with income $10k - 20k:| Rumney: | 6.5% (2,248) |
| New Hampshire: | 5.4% (29,916) |
Number of households with income $20k - 30k:| Rumney: | 5.9% (2,044) |
| State: | 5.5% (30,783) |
Number of households with income $30k - 40k:| Rumney: | 8.3% (2,837) |
| State: | 5.9% (32,868) |
Number of households with income $40k - 50k:| Rumney: | 5.8% (1,984) |
| New Hampshire: | 5.9% (32,728) |
Number of households with income $50k - 60k:| Rumney: | 6.9% (2,387) |
| State: | 6.9% (38,422) |
Number of households with income $60k - 75k:| Rumney: | 6.9% (2,380) |
| New Hampshire: | 9.1% (50,552) |
Number of households with income $75k - 100k:| Rumney: | 13.6% (4,693) |
| State: | 13.1% (73,145) |
Number of households with income $100k - 125k:| Rumney: | 11.6% (3,997) |
| State: | 10.5% (58,593) |
Number of households with income $125k - 150k:| Rumney: | 6.2% (2,144) |
| State: | 8.1% (44,878) |
Number of households with income $150k - 200k:| Rumney: | 7.8% (2,673) |
| State: | 11.5% (64,340) |
Number of households with income > $200k:| Rumney: | 15.6% (5,361) |
| State: | 15.0% (83,454) |
Aggregate household income in Rumney in 2022: $67,479,898
Median family income in Rumney in 2022:| Rumney: | $86,668 |
| New Hampshire: | $112,950 |
Median non-family income in Rumney in 2022:| Rumney: | $42,691 |
| New Hampshire: | $52,292 |
Change in median non-family income between 2000 and 2022:| Rumney, New Hampshire: | +96.3% |
| State: | +80.7% |
Median per capita income in Rumney in 2022:| Rumney: | $39,042 |
| New Hampshire: | $49,281 |
Change in median per capita income between 2000 and 2022:| Rumney, New Hampshire: | +127.4% |
| New Hampshire: | +106.7% |
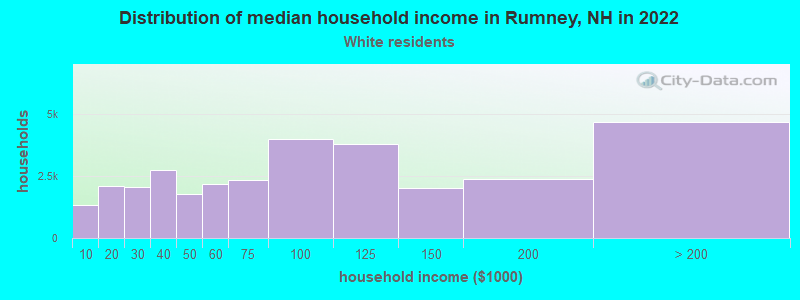
Income statistics for White residents
Median household income in Rumney, NH in 2022:| Rumney: | $73,995 |
| State: | $90,839 |
Change in median household income between 2000 and 2022:| Rumney, New Hampshire: | +91.6% |
| State: | +82.8% |
Number of households with income < $10k:| Rumney: | 4.3% (1,341) |
| State: | 3.1% (15,499) |
Number of households with income $10k - 20k:| Rumney: | 6.7% (2,089) |
| State: | 5.6% (27,915) |
Number of households with income $20k - 30k:| Rumney: | 6.6% (2,062) |
| New Hampshire: | 5.4% (27,382) |
Number of households with income $30k - 40k:| Rumney: | 8.8% (2,754) |
| New Hampshire: | 5.9% (29,681) |
Number of households with income $40k - 50k:| Rumney: | 5.7% (1,783) |
| State: | 5.7% (28,456) |
Number of households with income $50k - 60k:| Rumney: | 6.9% (2,156) |
| State: | 6.9% (34,641) |
Number of households with income $60k - 75k:| Rumney: | 7.4% (2,323) |
| New Hampshire: | 9.0% (45,144) |
Number of households with income $75k - 100k:| Rumney: | 12.7% (3,978) |
| New Hampshire: | 13.0% (65,259) |
Number of households with income $100k - 125k:| Rumney: | 12.1% (3,783) |
| State: | 10.7% (53,931) |
Number of households with income $125k - 150k:| Rumney: | 6.5% (2,028) |
| State: | 8.1% (40,466) |
Number of households with income $150k - 200k:| Rumney: | 7.6% (2,368) |
| State: | 11.9% (59,781) |
Number of households with income > $200k:| Rumney: | 14.9% (4,666) |
| New Hampshire: | 14.8% (74,387) |
Aggregate household income in Rumney in 2022: $60,878,832
Median family income in Rumney in 2022:| Rumney: | $85,055 |
| State: | $115,125 |
Number of families with income < $10k:| Rumney: | 1.5% (5) |
| State: | 1.5% (4,767) |
Number of families with income $10k - 20k:| Rumney: | 6.9% (21) |
| State: | 2.1% (6,602) |
Number of families with income $20k - 30k:| Rumney: | 8.1% (25) |
| New Hampshire: | 2.7% (8,511) |
Number of families with income $30k - 40k:| Rumney: | 12.4% (38) |
| New Hampshire: | 4.0% (12,696) |
Number of families with income $40k - 50k:| Rumney: | 12.1% (37) |
| State: | 4.3% (13,626) |
Number of families with income $50k - 60k:| Rumney: | 5.9% (18) |
| New Hampshire: | 5.6% (17,792) |
Number of families with income $60k - 75k:| Rumney: | 12.4% (38) |
| State: | 8.4% (26,945) |
Number of families with income $75k - 100k:| Rumney: | 7.2% (22) |
| New Hampshire: | 13.8% (44,284) |
Number of families with income $100k - 125k:| Rumney: | 9.7% (30) |
| State: | 12.5% (39,959) |
Number of families with income $125k - 150k:| Rumney: | 9.8% (30) |
| State: | 10.3% (33,038) |
Number of families with income $150k - 200k:| Rumney: | 5.5% (17) |
| New Hampshire: | 15.4% (49,456) |
Number of families with income > $200k:| Rumney: | 8.5% (26) |
| State: | 19.5% (62,442) |
Median non-family income in Rumney in 2022:| Rumney: | $41,659 |
| New Hampshire: | $51,861 |
Change in median non-family income between 2000 and 2022:| Rumney, New Hampshire: | +82.6% |
| State: | +79.2% |
Median per capita income in Rumney in 2022:| Rumney: | $39,360 |
| State: | $50,469 |
Change in median per capita income between 2000 and 2022:| Rumney, New Hampshire: | +127.5% |
| New Hampshire: | +109.2% |
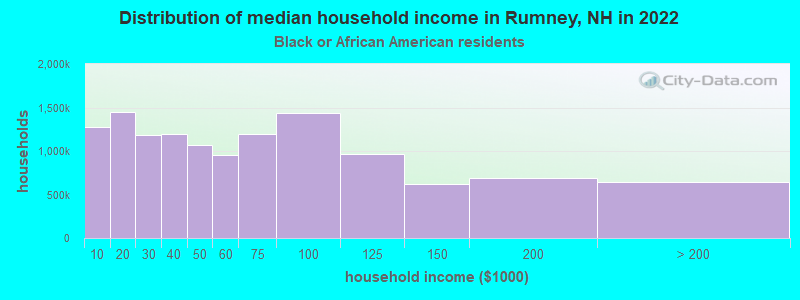
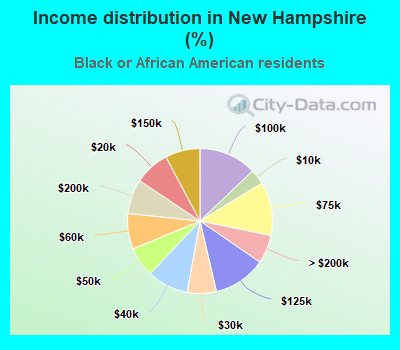
Income statistics for Black or African American residents
Number of households with income < $10k:| Rumney: | 9.9% (35) |
| New Hampshire: | 3.4% (202) |
Number of households with income $10k - 20k:| Rumney: | 11.4% (40) |
| State: | 7.8% (463) |
Number of households with income $20k - 30k:| Rumney: | 9.4% (33) |
| State: | 6.5% (384) |
Number of households with income $30k - 40k:| Rumney: | 9.7% (34) |
| New Hampshire: | 9.2% (544) |
Number of households with income $40k - 50k:| Rumney: | 8.5% (30) |
| New Hampshire: | 6.7% (394) |
Number of households with income $50k - 60k:| Rumney: | 7.4% (26) |
| State: | 7.9% (469) |
Number of households with income $60k - 75k:| Rumney: | 9.4% (33) |
| State: | 11.9% (705) |
Number of households with income $75k - 100k:| Rumney: | 11.4% (40) |
| State: | 12.9% (761) |
Number of households with income $100k - 125k:| Rumney: | 7.7% (27) |
| State: | 11.7% (694) |
Number of households with income $125k - 150k:| Rumney: | 4.8% (17) |
| State: | 7.8% (459) |
Number of households with income $150k - 200k:| Rumney: | 5.4% (19) |
| State: | 7.7% (456) |
Number of households with income > $200k:| Rumney: | 5.1% (18) |
| State: | 6.4% (377) |
Aggregate household income in Rumney in 2022: $182,582
Median per capita income in Rumney in 2022:| Rumney: | $16,559 |
| State: | $31,675 |
Change in median per capita income between 2000 and 2022:| Rumney, New Hampshire: | +72.5% |
| New Hampshire: | +85.9% |
Income statistics for Asian residents
Number of households with income < $10k:| Rumney: | 2.1% (71) |
| State: | 2.1% (271) |
Number of households with income $10k - 20k:| Rumney: | 3.0% (102) |
| State: | 3.0% (393) |
Number of households with income $20k - 30k:| Rumney: | 5.5% (190) |
| State: | 5.5% (729) |
Number of households with income $30k - 40k:| Rumney: | 3.9% (133) |
| State: | 3.9% (510) |
Number of households with income $40k - 50k:| Rumney: | 6.4% (220) |
| State: | 6.4% (842) |
Number of households with income $50k - 60k:| Rumney: | 2.0% (68) |
| State: | 2.0% (261) |
Number of households with income $60k - 75k:| Rumney: | 4.5% (156) |
| New Hampshire: | 4.5% (597) |
Number of households with income $75k - 100k:| Rumney: | 11.8% (407) |
| New Hampshire: | 11.8% (1,559) |
Number of households with income $100k - 125k:| Rumney: | 10.1% (348) |
| State: | 10.1% (1,334) |
Number of households with income $125k - 150k:| Rumney: | 11.1% (382) |
| State: | 11.1% (1,463) |
Number of households with income $150k - 200k:| Rumney: | 8.3% (286) |
| State: | 8.3% (1,095) |
Number of households with income > $200k:| Rumney: | 31.2% (1,074) |
| New Hampshire: | 31.2% (4,111) |
Median per capita income in Rumney in 2022:| Rumney: | $23,122 |
| State: | $64,014 |
Income statistics for Hispanic or Latino residents
Number of households with income < $10k:| Rumney: | 4.0% (70) |
| New Hampshire: | 4.0% (695) |
Number of households with income $10k - 20k:| Rumney: | 3.7% (64) |
| New Hampshire: | 3.7% (639) |
Number of households with income $20k - 30k:| Rumney: | 5.7% (100) |
| State: | 5.7% (998) |
Number of households with income $30k - 40k:| Rumney: | 6.6% (115) |
| State: | 6.6% (1,151) |
Number of households with income $40k - 50k:| Rumney: | 8.7% (153) |
| State: | 8.7% (1,521) |
Number of households with income $50k - 60k:| Rumney: | 10.0% (175) |
| State: | 10.0% (1,751) |
Number of households with income $60k - 75k:| Rumney: | 13.1% (229) |
| New Hampshire: | 13.1% (2,284) |
Number of households with income $75k - 100k:| Rumney: | 17.2% (301) |
| New Hampshire: | 17.2% (3,004) |
Number of households with income $100k - 125k:| Rumney: | 8.2% (143) |
| New Hampshire: | 8.2% (1,430) |
Number of households with income $125k - 150k:| Rumney: | 6.6% (116) |
| State: | 6.6% (1,154) |
Number of households with income $150k - 200k:| Rumney: | 8.3% (146) |
| State: | 8.4% (1,462) |
Number of households with income > $200k:| Rumney: | 7.8% (137) |
| State: | 7.9% (1,371) |
Median per capita income in Rumney in 2022:| Rumney: | $3,220 |
| State: | $32,911 |
Change in median per capita income between 2000 and 2022:| Rumney, New Hampshire: | +122.1% |
| State: | +127.3% |
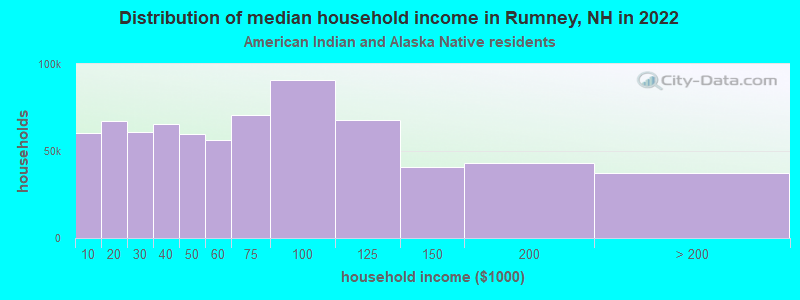
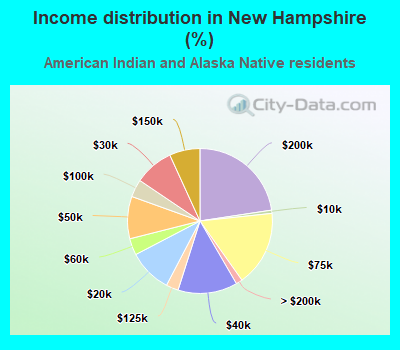
Income statistics for American Indian and Alaska Native residents
Number of households with income < $10k:| Rumney: | 10.0% (3) |
| New Hampshire: | 0.7% (6) |
Number of households with income $10k - 20k:| Rumney: | 10.0% (3) |
| State: | 9.7% (81) |
Number of households with income $20k - 30k:| Rumney: | 6.7% (2) |
| New Hampshire: | 8.7% (73) |
Number of households with income $30k - 40k:| Rumney: | 6.7% (2) |
| New Hampshire: | 13.3% (111) |
Number of households with income $40k - 50k:| Rumney: | 6.7% (2) |
| New Hampshire: | 9.4% (79) |
Number of households with income $50k - 60k:| Rumney: | 6.7% (2) |
| New Hampshire: | 3.7% (31) |
Number of households with income $60k - 75k:| Rumney: | 10.0% (3) |
| State: | 16.9% (141) |
Number of households with income $75k - 100k:| Rumney: | 13.3% (4) |
| State: | 3.9% (33) |
Number of households with income $100k - 125k:| Rumney: | 10.0% (3) |
| New Hampshire: | 2.8% (23) |
Number of households with income $125k - 150k:| Rumney: | 6.7% (2) |
| New Hampshire: | 6.8% (57) |
Number of households with income $150k - 200k:| Rumney: | 6.7% (2) |
| State: | 22.6% (189) |
Number of households with income > $200k:| Rumney: | 6.7% (2) |
| State: | 1.4% (12) |
Aggregate household income in Rumney in 2022: $2,433,387
Median per capita income in Rumney in 2022:| Rumney: | $39,433 |
| State: | $75,805 |
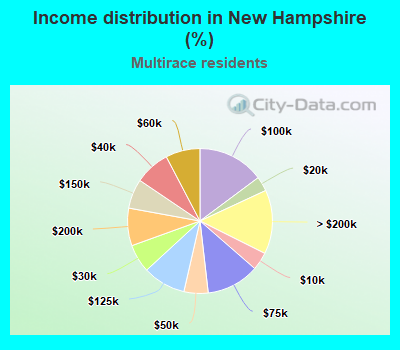
Income statistics for Multirace residents
Median household income in Rumney, NH in 2022:| Rumney: | $140,021 |
| State: | $81,037 |
Number of households with income < $10k:| Rumney: | 4.0% (643) |
| State: | 4.0% (1,057) |
Number of households with income $10k - 20k:| Rumney: | 3.3% (522) |
| State: | 3.3% (864) |
Number of households with income $20k - 30k:| Rumney: | 6.3% (1,010) |
| New Hampshire: | 6.3% (1,664) |
Number of households with income $30k - 40k:| Rumney: | 7.9% (1,255) |
| State: | 7.9% (2,072) |
Number of households with income $40k - 50k:| Rumney: | 5.4% (870) |
| State: | 5.4% (1,422) |
Number of households with income $50k - 60k:| Rumney: | 7.7% (1,224) |
| State: | 7.7% (2,024) |
Number of households with income $60k - 75k:| Rumney: | 11.8% (1,882) |
| New Hampshire: | 11.8% (3,109) |
Number of households with income $75k - 100k:| Rumney: | 14.8% (2,371) |
| State: | 14.8% (3,906) |
Number of households with income $100k - 125k:| Rumney: | 9.7% (1,552) |
| New Hampshire: | 9.6% (2,523) |
Number of households with income $125k - 150k:| Rumney: | 6.5% (1,046) |
| State: | 6.6% (1,734) |
Number of households with income $150k - 200k:| Rumney: | 8.4% (1,340) |
| New Hampshire: | 8.4% (2,213) |
Number of households with income > $200k:| Rumney: | 14.2% (2,272) |
| State: | 14.3% (3,765) |
Aggregate household income in Rumney in 2022: $4,007,677
Median family income in Rumney in 2022:| Rumney: | $134,301 |
| State: | $87,413 |
Number of families with income $40k - 50k:| Rumney: | 39.0% (11) |
| New Hampshire: | 5.1% (979) |
Number of families with income $50k - 60k:| Rumney: | 61.0% (17) |
| State: | 7.4% (1,409) |
Median non-family income in Rumney in 2022:| Rumney: | $69,469 |
| State: | $60,494 |
Median per capita income in Rumney in 2022:| Rumney: | $34,368 |
| New Hampshire: | $34,906 |
Change in median per capita income between 2000 and 2022:| Rumney, New Hampshire: | +136.3% |
| State: | +135.6% |