The median household income in San Ygnacio, TX in 2022 was $34,985, which was 106.6% less than the median annual income of $72,284 across the entire state of Texas. Compared to the median income of $18,977 in 2000 this represents an increase of 45.8%. The per capita income in 2022 was $14,979, which means an increase of 48.5% compared to 2000 when it was $7,713.
Income statistics for all residents
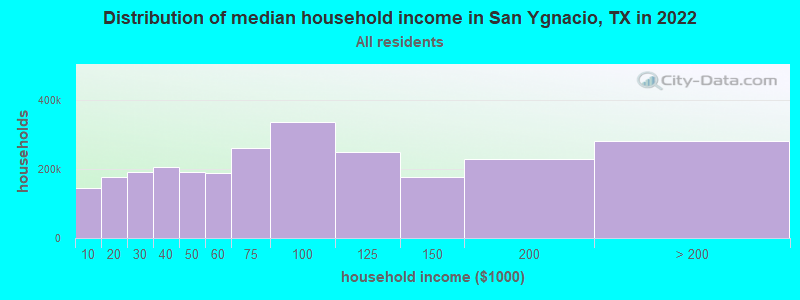
Median household income in San Ygnacio, TX in 2022:
San Ygnacio:
$34,986
State:
$72,284
Change in median household income between 2000 and 2022:
San Ygnacio, Texas:
+84.4%
State:
+81.0%
Number of households with income < $10k:
San Ygnacio:
5.5% (145,125)
Texas:
5.5% (611,011)
Number of households with income $10k - 20k:
San Ygnacio:
6.7% (176,603)
Texas:
6.7% (743,157)
Number of households with income $20k - 30k:
San Ygnacio:
7.2% (190,921)
State:
7.2% (803,381)
Number of households with income $30k - 40k:
San Ygnacio:
7.8% (205,798)
State:
7.8% (866,080)
Number of households with income $40k - 50k:
San Ygnacio:
7.3% (192,584)
Texas:
7.3% (810,440)
Number of households with income $50k - 60k:
San Ygnacio:
7.2% (190,026)
State:
7.2% (799,783)
Number of households with income $60k - 75k:
San Ygnacio:
9.9% (260,274)
State:
9.9% (1,095,384)
Number of households with income $75k - 100k:
San Ygnacio:
12.8% (337,273)
Texas:
12.8% (1,419,057)
Number of households with income $100k - 125k:
San Ygnacio:
9.5% (250,671)
State:
9.5% (1,054,577)
Number of households with income $125k - 150k:
San Ygnacio:
6.7% (176,302)
State:
6.7% (741,518)
Number of households with income $150k - 200k:
San Ygnacio:
8.7% (228,542)
State:
8.7% (961,776)
Number of households with income > $200k:
San Ygnacio:
10.7% (280,648)
Texas:
10.7% (1,181,544)
Aggregate household income in San Ygnacio in 2022: $2,138,509,664
Median family income in San Ygnacio in 2022:
San Ygnacio:
$40,114
State:
$86,267
Median non-family income in San Ygnacio in 2022:
San Ygnacio:
$22,433
State:
$45,999
Change in median non-family income between 2000 and 2022:
San Ygnacio, Texas:
+85.2%
State:
+79.5%
Median per capita income in San Ygnacio in 2022:
San Ygnacio:
$14,980
State:
$38,123
Change in median per capita income between 2000 and 2022:
San Ygnacio, Texas:
+94.2%
State:
+94.3%
Income statistics for White residents
Median household income in San Ygnacio, TX in 2022:
San Ygnacio:
$37,602
State:
$82,032
Change in median household income between 2000 and 2022:
San Ygnacio, Texas:
+90.4%
State:
+91.0%
Number of households with income < $10k:
San Ygnacio:
4.7% (62,751)
Texas:
4.7% (273,716)
Number of households with income $10k - 20k:
San Ygnacio:
5.5% (74,116)
State:
5.5% (322,702)
Number of households with income $20k - 30k:
San Ygnacio:
6.2% (83,635)
State:
6.2% (363,947)
Number of households with income $30k - 40k:
San Ygnacio:
6.8% (91,674)
Texas:
6.8% (399,275)
Number of households with income $40k - 50k:
San Ygnacio:
6.5% (88,002)
Texas:
6.5% (383,417)
Number of households with income $50k - 60k:
San Ygnacio:
6.6% (89,160)
State:
6.6% (388,535)
Number of households with income $60k - 75k:
San Ygnacio:
9.6% (129,781)
State:
9.7% (566,295)
Number of households with income $75k - 100k:
San Ygnacio:
13.0% (174,403)
State:
13.0% (760,276)
Number of households with income $100k - 125k:
San Ygnacio:
10.2% (137,088)
State:
10.2% (597,596)
Number of households with income $125k - 150k:
San Ygnacio:
7.4% (100,180)
State:
7.4% (436,830)
Number of households with income $150k - 200k:
San Ygnacio:
9.9% (133,611)
State:
9.9% (583,067)
Number of households with income > $200k:
San Ygnacio:
13.5% (181,163)
State:
13.5% (792,647)
Aggregate household income in San Ygnacio in 2022: $1,053,234,230
Median family income in San Ygnacio in 2022:
San Ygnacio:
$44,661
State:
$101,788
Number of families with income < $10k:
San Ygnacio:
22.0% (20)
Texas:
2.8% (108,142)
Number of families with income $10k - 20k:
San Ygnacio:
12.5% (12)
Texas:
2.9% (113,421)
Number of families with income $20k - 30k:
San Ygnacio:
11.7% (11)
State:
4.1% (157,688)
Number of families with income $30k - 40k:
San Ygnacio:
12.9% (12)
Texas:
5.2% (198,847)
Number of families with income $40k - 50k:
San Ygnacio:
9.5% (9)
Texas:
5.6% (216,490)
Number of families with income $50k - 60k:
San Ygnacio:
5.8% (5)
Texas:
5.7% (220,689)
Number of families with income $75k - 100k:
San Ygnacio:
25.5% (24)
Texas:
13.7% (527,363)
Median non-family income in San Ygnacio in 2022:
San Ygnacio:
$22,513
State:
$50,587
Change in median non-family income between 2000 and 2022:
San Ygnacio, Texas:
+85.8%
Texas:
+87.7%
Median per capita income in San Ygnacio in 2022:
San Ygnacio:
$18,114
State:
$47,740
Change in median per capita income between 2000 and 2022:
San Ygnacio, Texas:
+112.1%
Texas:
+114.3%
Income statistics for Hispanic or Latino residents
Median household income in San Ygnacio, TX in 2022:
San Ygnacio:
$36,258
Texas:
$60,504
Change in median household income between 2000 and 2022:
San Ygnacio, Texas:
+112.9%
State:
+102.5%
Number of households with income < $10k:
San Ygnacio:
5.8% (61,056)
State:
5.8% (213,953)
Number of households with income $10k - 20k:
San Ygnacio:
8.0% (84,915)
State:
8.0% (297,456)
Number of households with income $20k - 30k:
San Ygnacio:
9.2% (97,021)
State:
9.2% (340,166)
Number of households with income $30k - 40k:
San Ygnacio:
9.5% (101,154)
State:
9.5% (354,336)
Number of households with income $40k - 50k:
San Ygnacio:
8.8% (93,291)
State:
8.8% (327,013)
Number of households with income $50k - 60k:
San Ygnacio:
8.3% (88,048)
State:
8.3% (308,818)
Number of households with income $60k - 75k:
San Ygnacio:
10.9% (115,604)
Texas:
10.9% (405,109)
Number of households with income $75k - 100k:
San Ygnacio:
13.8% (146,069)
Texas:
13.8% (511,639)
Number of households with income $100k - 125k:
San Ygnacio:
8.6% (91,286)
State:
8.6% (319,728)
Number of households with income $125k - 150k:
San Ygnacio:
5.7% (60,276)
Texas:
5.7% (210,932)
Number of households with income $150k - 200k:
San Ygnacio:
6.4% (67,317)
State:
6.4% (236,055)
Number of households with income > $200k:
San Ygnacio:
5.1% (54,046)
Texas:
5.1% (189,259)
Aggregate household income in San Ygnacio in 2022: $485,739,914
Median family income in San Ygnacio in 2022:
San Ygnacio:
$43,005
Texas:
$65,080
Number of families with income $20k - 30k:
San Ygnacio:
45.8% (6)
Texas:
8.6% (238,528)
Number of families with income $40k - 50k:
San Ygnacio:
54.2% (7)
State:
8.6% (240,188)
Median non-family income in San Ygnacio in 2022:
San Ygnacio:
$24,630
Texas:
$39,934
Change in median non-family income between 2000 and 2022:
San Ygnacio, Texas:
+120.8%
State:
+109.1%
Median per capita income in San Ygnacio in 2022:
San Ygnacio:
$16,498
State:
$24,862
Change in median per capita income between 2000 and 2022:
San Ygnacio, Texas:
+128.5%
Texas:
+130.8%
Income statistics for Multirace residents
Median household income in San Ygnacio, TX in 2022:
San Ygnacio:
$19,519
Texas:
$62,748
Change in median household income between 2000 and 2022:
San Ygnacio, Texas:
+97.9%
State:
+92.3%
Number of households with income < $10k:
San Ygnacio:
5.5% (18,465)
State:
5.5% (122,324)
Number of households with income $10k - 20k:
San Ygnacio:
8.2% (27,509)
Texas:
8.2% (182,232)
Number of households with income $20k - 30k:
San Ygnacio:
8.5% (28,570)
Texas:
8.5% (189,456)
Number of households with income $30k - 40k:
San Ygnacio:
8.9% (29,806)
State:
8.9% (197,499)
Number of households with income $40k - 50k:
San Ygnacio:
8.7% (28,951)
State:
8.7% (191,735)
Number of households with income $50k - 60k:
San Ygnacio:
8.0% (26,777)
State:
8.0% (177,535)
Number of households with income $60k - 75k:
San Ygnacio:
10.5% (35,097)
State:
10.5% (232,479)
Number of households with income $75k - 100k:
San Ygnacio:
13.1% (43,834)
State:
13.1% (290,448)
Number of households with income $100k - 125k:
San Ygnacio:
8.6% (28,928)
State:
8.6% (191,595)
Number of households with income $125k - 150k:
San Ygnacio:
6.0% (20,149)
Texas:
6.0% (133,361)
Number of households with income $150k - 200k:
San Ygnacio:
7.2% (23,999)
State:
7.2% (159,195)
Number of households with income > $200k:
San Ygnacio:
6.7% (22,344)
Texas:
6.7% (148,064)
Aggregate household income in San Ygnacio in 2022: $26,023,767
Median family income in San Ygnacio in 2022:
San Ygnacio:
$19,426
Texas:
$69,780
Number of families with income < $10k:
San Ygnacio:
36.3% (61)
State:
4.4% (70,825)
Number of families with income $50k - 60k:
San Ygnacio:
63.7% (107)
State:
7.9% (127,739)
Median per capita income in San Ygnacio in 2022:
San Ygnacio:
$24,318
State:
$26,785
Change in median per capita income between 2000 and 2022:
San Ygnacio, Texas:
+108.4%
State:
+110.9%
Income statistics for other residents
Number of households with income < $10k:
San Ygnacio:
5.9% (13)
Texas:
5.9% (54,162)
Number of households with income $10k - 20k:
San Ygnacio:
6.4% (14)
State:
6.8% (62,891)
Number of households with income $20k - 30k:
San Ygnacio:
10.5% (23)
State:
10.6% (97,294)
Number of households with income $30k - 40k:
San Ygnacio:
10.9% (24)
State:
10.8% (99,670)
Number of households with income $40k - 50k:
San Ygnacio:
9.5% (21)
Texas:
9.3% (85,548)
Number of households with income $50k - 60k:
San Ygnacio:
9.1% (20)
State:
9.0% (82,757)
Number of households with income $60k - 75k:
San Ygnacio:
10.9% (24)
State:
10.9% (100,326)
Number of households with income $75k - 100k:
San Ygnacio:
14.1% (31)
State:
14.0% (128,767)
Number of households with income $100k - 125k:
San Ygnacio:
8.2% (18)
Texas:
8.2% (75,218)
Number of households with income $125k - 150k:
San Ygnacio:
5.0% (11)
State:
4.8% (44,223)
Number of households with income $150k - 200k:
San Ygnacio:
5.5% (12)
State:
5.6% (51,376)
Number of households with income > $200k:
San Ygnacio:
4.1% (9)
State:
4.0% (36,393)
Aggregate household income in San Ygnacio in 2022: $16,017,113
Median family income in San Ygnacio in 2022:
San Ygnacio:
$34,094
Texas:
$60,064
Number of families with income < $10k:
San Ygnacio:
16.4% (5)
State:
6.8% (47,502)
Number of families with income $10k - 20k:
San Ygnacio:
36.0% (10)
State:
6.0% (41,763)
Number of families with income $30k - 40k:
San Ygnacio:
25.6% (7)
State:
9.7% (67,685)
Number of families with income $40k - 50k:
San Ygnacio:
22.0% (6)
Texas:
9.0% (62,441)
Median per capita income in San Ygnacio in 2022:
San Ygnacio:
$9,833
State:
$23,899
Change in median per capita income between 2000 and 2022:
San Ygnacio, Texas:
+141.8%
State:
+135.2%
Discuss San Ygnacio, Texas (TX) on our hugely popular Texas forum.