The median household income in Sayre, OK in 2022 was $44,595, which was 33.8% less than the median annual income of $59,673 across the entire state of Oklahoma. Compared to the median income of $21,713 in 2000 this represents an increase of 51.3%. The per capita income in 2022 was $9,579, which means a decrease of 8.3% compared to 2000 when it was $10,378.
Whole page based on the data from 2000 / 2022 when the population of Sayre, Oklahoma was 4,114 / 5,527
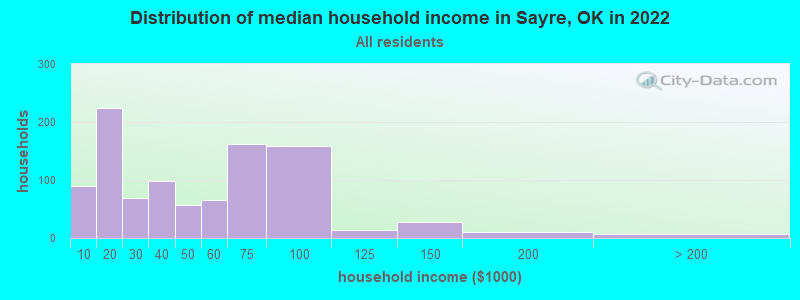
Income statistics for all residents
Median household income in Sayre, OK in 2022:
Sayre:
$44,595
State:
$59,673
Change in median household income between 2000 and 2022:
Sayre, Oklahoma:
+105.4%
State:
+78.7%
Number of households with income < $10k:
Sayre:
9.1% (90)
Oklahoma:
6.4% (100,950)
Number of households with income $10k - 20k:
Sayre:
22.8% (225)
State:
8.8% (137,709)
Number of households with income $20k - 30k:
Sayre:
7.0% (69)
Oklahoma:
9.1% (143,661)
Number of households with income $30k - 40k:
Sayre:
10.1% (99)
Oklahoma:
9.0% (141,098)
Number of households with income $40k - 50k:
Sayre:
5.8% (57)
State:
8.9% (140,217)
Number of households with income $50k - 60k:
Sayre:
6.6% (65)
State:
8.1% (126,882)
Number of households with income $60k - 75k:
Sayre:
16.4% (162)
Oklahoma:
10.0% (157,916)
Number of households with income $75k - 100k:
Sayre:
16.1% (159)
State:
12.4% (195,015)
Number of households with income $100k - 125k:
Sayre:
1.4% (14)
Oklahoma:
9.0% (141,779)
Number of households with income $125k - 150k:
Sayre:
2.8% (28)
State:
5.8% (91,594)
Number of households with income $150k - 200k:
Sayre:
1.0% (10)
Oklahoma:
6.3% (98,589)
Number of households with income > $200k:
Sayre:
0.7% (7)
State:
6.2% (97,770)
Aggregate household income in Sayre in 2022: $48,525,945
Median family income in Sayre in 2022:
Sayre:
$57,740
Oklahoma:
$75,476
Number of families with income < $10k:
Sayre:
6.9% (37)
Oklahoma:
4.2% (42,724)
Number of families with income $10k - 20k:
Sayre:
6.9% (38)
State:
4.9% (49,571)
Number of families with income $20k - 30k:
Sayre:
11.4% (62)
State:
6.3% (64,367)
Number of families with income $30k - 40k:
Sayre:
8.9% (48)
State:
7.5% (76,467)
Number of families with income $40k - 50k:
Sayre:
10.0% (55)
State:
8.3% (84,578)
Number of families with income $50k - 60k:
Sayre:
6.5% (36)
Oklahoma:
7.8% (79,642)
Number of families with income $60k - 75k:
Sayre:
13.2% (72)
State:
10.6% (108,169)
Number of families with income $75k - 100k:
Sayre:
26.5% (144)
State:
14.6% (148,857)
Number of families with income $100k - 125k:
Sayre:
2.4% (13)
Oklahoma:
11.2% (113,480)
Number of families with income $125k - 150k:
Sayre:
4.1% (22)
State:
7.6% (77,253)
Number of families with income $150k - 200k:
Sayre:
1.8% (10)
Oklahoma:
8.4% (85,947)
Number of families with income > $200k:
Sayre:
1.3% (7)
Oklahoma:
8.5% (86,531)
Median non-family income in Sayre in 2022:
Sayre:
$14,090
Oklahoma:
$35,419
Change in median non-family income between 2000 and 2022:
Sayre, Oklahoma:
+25.8%
State:
+83.2%
Median per capita income in Sayre in 2022:
Sayre:
$9,579
State:
$32,930
Change in median per capita income between 2000 and 2022:: -7.7%
Sayre, Oklahoma:
-7.7%
State:
+86.6%
Income statistics for White residents
Median household income in Sayre, OK in 2022:
Sayre:
$37,947
State:
$63,444
Change in median household income between 2000 and 2022:
Sayre, Oklahoma:
+77.8%
Oklahoma:
+79.3%
Number of households with income < $10k:
Sayre:
9.4% (80)
State:
5.5% (60,994)
Number of households with income $10k - 20k:
Sayre:
25.7% (218)
Oklahoma:
8.2% (91,263)
Number of households with income $20k - 30k:
Sayre:
7.7% (65)
Oklahoma:
8.7% (96,988)
Number of households with income $30k - 40k:
Sayre:
11.1% (94)
State:
8.4% (93,121)
Number of households with income $40k - 50k:
Sayre:
6.0% (51)
Oklahoma:
8.6% (95,446)
Number of households with income $50k - 60k:
Sayre:
7.2% (61)
Oklahoma:
7.9% (87,723)
Number of households with income $60k - 75k:
Sayre:
8.8% (75)
Oklahoma:
9.9% (109,955)
Number of households with income $75k - 100k:
Sayre:
17.6% (149)
State:
12.9% (143,880)
Number of households with income $100k - 125k:
Sayre:
1.4% (12)
State:
9.7% (107,851)
Number of households with income $125k - 150k:
Sayre:
3.2% (27)
State:
6.3% (69,802)
Number of households with income $150k - 200k:
Sayre:
1.2% (10)
Oklahoma:
6.9% (76,863)
Number of households with income > $200k:
Sayre:
0.8% (7)
State:
7.0% (78,099)
Aggregate household income in Sayre in 2022: $40,873,248
Median family income in Sayre in 2022:
Sayre:
$58,488
Oklahoma:
$82,251
Number of families with income < $10k:
Sayre:
6.9% (36)
State:
3.4% (24,057)
Number of families with income $10k - 20k:
Sayre:
6.9% (36)
State:
4.1% (29,440)
Number of families with income $20k - 30k:
Sayre:
11.4% (59)
State:
5.7% (40,670)
Number of families with income $30k - 40k:
Sayre:
8.5% (44)
State:
6.5% (46,540)
Number of families with income $40k - 50k:
Sayre:
9.9% (52)
Oklahoma:
7.7% (55,082)
Number of families with income $50k - 60k:
Sayre:
6.5% (34)
State:
7.5% (53,408)
Number of families with income $60k - 75k:
Sayre:
13.2% (69)
State:
10.4% (74,624)
Number of families with income $75k - 100k:
Sayre:
27.1% (141)
State:
15.3% (109,679)
Number of families with income $100k - 125k:
Sayre:
2.3% (12)
State:
12.0% (86,208)
Number of families with income $125k - 150k:
Sayre:
4.1% (21)
State:
8.3% (59,328)
Number of families with income $150k - 200k:
Sayre:
1.9% (10)
State:
9.4% (67,640)
Number of families with income > $200k:
Sayre:
1.3% (7)
State:
9.7% (69,551)
Median non-family income in Sayre in 2022:
Sayre:
$13,167
Oklahoma:
$36,941
Change in median non-family income between 2000 and 2022:
Sayre, Oklahoma:
+17.7%
Oklahoma:
+83.5%
Median per capita income in Sayre in 2022:
Sayre:
$12,641
State:
$37,390
Change in median per capita income between 2000 and 2022:
Sayre, Oklahoma:
+3.7%
Oklahoma:
+92.4%
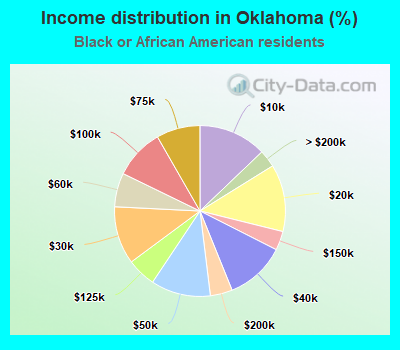
Income statistics for Black or African American residents
Number of households with income < $10k:
Sayre:
1.3% (1)
State:
12.9% (13,905)
Number of households with income $10k - 20k:
Sayre:
0.0% (0)
State:
12.7% (13,734)
Number of households with income $20k - 30k:
Sayre:
0.0% (0)
State:
11.0% (11,826)
Number of households with income $30k - 40k:
Sayre:
0.0% (0)
State:
11.4% (12,301)
Number of households with income $40k - 50k:
Sayre:
0.0% (0)
State:
11.3% (12,200)
Number of households with income $50k - 60k:
Sayre:
0.0% (0)
State:
6.4% (6,925)
Number of households with income $60k - 75k:
Sayre:
98.7% (74)
State:
8.3% (8,947)
Number of households with income $75k - 100k:
Sayre:
0.0% (0)
Oklahoma:
9.5% (10,253)
Number of households with income $100k - 125k:
Sayre:
0.0% (0)
State:
5.5% (5,928)
Number of households with income $125k - 150k:
Sayre:
0.0% (0)
Oklahoma:
3.6% (3,885)
Number of households with income $150k - 200k:
Sayre:
0.0% (0)
State:
4.2% (4,529)
Number of households with income > $200k:
Sayre:
0.0% (0)
State:
3.3% (3,551)
Aggregate household income in Sayre in 2022: $223,229
Median per capita income in Sayre in 2022:
Sayre:
$6,423
Oklahoma:
$24,741
Change in median per capita income between 2000 and 2022:
Sayre, Oklahoma:
+79.6%
State:
+98.7%
Income statistics for Hispanic or Latino residents
Median household income in Sayre, OK in 2022:
Sayre:
$61,078
Oklahoma:
$52,856
Number of households with income < $10k:
Sayre:
2.3% (3)
Oklahoma:
6.0% (7,958)
Number of households with income $10k - 20k:
Sayre:
0.0% (0)
State:
8.4% (11,153)
Number of households with income $20k - 30k:
Sayre:
0.0% (0)
State:
9.7% (13,003)
Number of households with income $30k - 40k:
Sayre:
0.0% (0)
State:
11.7% (15,624)
Number of households with income $40k - 50k:
Sayre:
0.0% (0)
State:
11.0% (14,697)
Number of households with income $50k - 60k:
Sayre:
0.0% (0)
Oklahoma:
9.6% (12,832)
Number of households with income $60k - 75k:
Sayre:
76.9% (100)
Oklahoma:
12.2% (16,321)
Number of households with income $75k - 100k:
Sayre:
20.8% (27)
State:
12.5% (16,668)
Number of households with income $100k - 125k:
Sayre:
0.0% (0)
State:
7.5% (9,988)
Number of households with income $125k - 150k:
Sayre:
0.0% (0)
State:
4.5% (6,042)
Number of households with income $150k - 200k:
Sayre:
0.0% (0)
State:
3.8% (5,080)
Number of households with income > $200k:
Sayre:
0.0% (0)
State:
3.0% (4,063)
Aggregate household income in Sayre in 2022: $9,000,637
Median family income in Sayre in 2022:
Sayre:
$83,457
State:
$55,896
Number of families with income $60k - 75k:
Sayre:
30.4% (12)
State:
12.9% (13,025)
Number of families with income $75k - 100k:
Sayre:
69.6% (27)
State:
13.1% (13,152)
Median non-family income in Sayre in 2022:
Sayre:
$54,434
State:
$33,093
Median per capita income in Sayre in 2022:
Sayre:
$10,107
State:
$19,473
Change in median per capita income between 2000 and 2022:
Sayre, Oklahoma:
+17.3%
State:
+97.3%
Income statistics for American Indian and Alaska Native residents
Aggregate household income in Sayre in 2022: $659,848
Median per capita income in Sayre in 2022:
Sayre:
$4,612
Oklahoma:
$25,549
Income statistics for Multirace residents
Number of households with income < $10k:
Sayre:
30.0% (6)
Oklahoma:
6.8% (11,975)
Number of households with income $10k - 20k:
Sayre:
30.0% (6)
Oklahoma:
8.9% (15,797)
Number of households with income $20k - 30k:
Sayre:
0.0% (0)
State:
10.2% (18,071)
Number of households with income $30k - 40k:
Sayre:
0.0% (0)
Oklahoma:
11.0% (19,477)
Number of households with income $40k - 50k:
Sayre:
25.0% (5)
State:
9.3% (16,501)
Number of households with income $50k - 60k:
Sayre:
0.0% (0)
State:
8.9% (15,635)
Number of households with income $60k - 75k:
Sayre:
0.0% (0)
State:
10.9% (19,250)
Number of households with income $75k - 100k:
Sayre:
0.0% (0)
State:
11.5% (20,279)
Number of households with income $100k - 125k:
Sayre:
15.0% (3)
Oklahoma:
8.0% (14,067)
Number of households with income $125k - 150k:
Sayre:
0.0% (0)
State:
4.9% (8,612)
Number of households with income $150k - 200k:
Sayre:
0.0% (0)
State:
5.0% (8,897)
Number of households with income > $200k:
Sayre:
0.0% (0)
State:
4.5% (7,970)
Aggregate household income in Sayre in 2022: $560,590
Median per capita income in Sayre in 2022:
Sayre:
$4,221
State:
$23,085
Change in median per capita income between 2000 and 2022:: -13.8%
Sayre, Oklahoma:
-13.8%
State:
+93.8%
Income statistics for other residents
Aggregate household income in Sayre in 2022: $3,921,803
Median per capita income in Sayre in 2022:
Sayre:
$3,385
Oklahoma:
$21,007
Change in median per capita income between 2000 and 2022:: -80.3%
Sayre, Oklahoma:
-80.3%
Oklahoma:
+119.2%
Discuss Sayre, Oklahoma (OK) on our hugely popular Oklahoma forum.