Schuyler Falls, New York (NY) income map, earnings map, and wages data
The median household income in Schuyler Falls, NY in 2022 was $74,482, which was 6.8% less than the median annual income of $79,557 across the entire state of New York. Compared to the median income of $41,691 in 2000 this represents an increase of 44.0%. The per capita income in 2022 was $35,849, which means an increase of 49.0% compared to 2000 when it was $18,294.
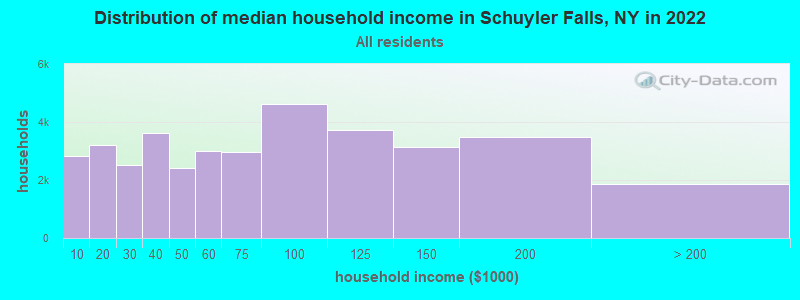
Income statistics for all residents
Median household income in Schuyler Falls, NY in 2022:| Schuyler Falls: | $74,483 |
| State: | $79,557 |
Change in median household income between 2000 and 2022:| Schuyler Falls, New York: | +78.7% |
| State: | +83.3% |
Number of households with income < $10k:| Schuyler Falls: | 7.6% (2,828) |
| New York: | 6.8% (527,598) |
Number of households with income $10k - 20k:| Schuyler Falls: | 8.5% (3,196) |
| State: | 7.4% (574,940) |
Number of households with income $20k - 30k:| Schuyler Falls: | 6.7% (2,506) |
| State: | 6.7% (517,718) |
Number of households with income $30k - 40k:| Schuyler Falls: | 9.7% (3,635) |
| New York: | 6.5% (506,674) |
Number of households with income $40k - 50k:| Schuyler Falls: | 6.4% (2,403) |
| New York: | 6.1% (470,439) |
Number of households with income $50k - 60k:| Schuyler Falls: | 8.0% (3,011) |
| New York: | 5.8% (454,042) |
Number of households with income $60k - 75k:| Schuyler Falls: | 8.0% (2,977) |
| State: | 8.5% (657,508) |
Number of households with income $75k - 100k:| Schuyler Falls: | 12.4% (4,637) |
| State: | 11.6% (899,824) |
Number of households with income $100k - 125k:| Schuyler Falls: | 10.0% (3,725) |
| State: | 9.3% (723,825) |
Number of households with income $125k - 150k:| Schuyler Falls: | 8.4% (3,137) |
| New York: | 7.1% (552,420) |
Number of households with income $150k - 200k:| Schuyler Falls: | 9.3% (3,496) |
| New York: | 9.4% (727,051) |
Number of households with income > $200k:| Schuyler Falls: | 5.0% (1,866) |
| State: | 15.0% (1,162,269) |
Aggregate household income in Schuyler Falls in 2022: $190,636,367
Median family income in Schuyler Falls in 2022:| Schuyler Falls: | $90,455 |
| State: | $99,066 |
Median non-family income in Schuyler Falls in 2022:| Schuyler Falls: | $47,681 |
| State: | $50,181 |
Change in median non-family income between 2000 and 2022:| Schuyler Falls, New York: | +78.2% |
| New York: | +85.4% |
Median per capita income in Schuyler Falls in 2022:| Schuyler Falls: | $35,850 |
| State: | $47,421 |
Change in median per capita income between 2000 and 2022:| Schuyler Falls, New York: | +96.0% |
| New York: | +102.7% |
Income statistics for White residents
Median household income in Schuyler Falls, NY in 2022:| Schuyler Falls: | $76,625 |
| State: | $89,408 |
Change in median household income between 2000 and 2022:| Schuyler Falls, New York: | +84.8% |
| New York: | +85.5% |
Number of households with income < $10k:| Schuyler Falls: | 7.1% (2,447) |
| State: | 4.8% (225,550) |
Number of households with income $10k - 20k:| Schuyler Falls: | 7.9% (2,719) |
| New York: | 6.1% (289,425) |
Number of households with income $20k - 30k:| Schuyler Falls: | 5.6% (1,929) |
| State: | 5.9% (280,254) |
Number of households with income $30k - 40k:| Schuyler Falls: | 9.8% (3,353) |
| State: | 6.1% (288,263) |
Number of households with income $40k - 50k:| Schuyler Falls: | 6.7% (2,288) |
| State: | 5.9% (278,079) |
Number of households with income $50k - 60k:| Schuyler Falls: | 8.4% (2,872) |
| New York: | 5.7% (267,554) |
Number of households with income $60k - 75k:| Schuyler Falls: | 8.0% (2,750) |
| State: | 8.4% (398,344) |
Number of households with income $75k - 100k:| Schuyler Falls: | 12.6% (4,331) |
| State: | 11.8% (554,841) |
Number of households with income $100k - 125k:| Schuyler Falls: | 10.7% (3,664) |
| New York: | 10.0% (469,794) |
Number of households with income $125k - 150k:| Schuyler Falls: | 8.8% (3,031) |
| New York: | 7.6% (360,467) |
Number of households with income $150k - 200k:| Schuyler Falls: | 9.2% (3,158) |
| State: | 10.1% (477,078) |
Number of households with income > $200k:| Schuyler Falls: | 5.3% (1,816) |
| New York: | 17.6% (829,233) |
Aggregate household income in Schuyler Falls in 2022: $180,953,685
Median family income in Schuyler Falls in 2022:| Schuyler Falls: | $91,715 |
| State: | $115,170 |
Number of families with income < $10k:| Schuyler Falls: | 3.5% (42) |
| State: | 2.5% (68,851) |
Number of families with income $10k - 20k:| Schuyler Falls: | 3.6% (43) |
| New York: | 3.0% (83,127) |
Number of families with income $20k - 30k:| Schuyler Falls: | 1.7% (20) |
| State: | 3.5% (97,578) |
Number of families with income $30k - 40k:| Schuyler Falls: | 10.7% (126) |
| New York: | 4.1% (114,108) |
Number of families with income $40k - 50k:| Schuyler Falls: | 8.8% (103) |
| State: | 4.7% (130,902) |
Number of families with income $50k - 60k:| Schuyler Falls: | 7.7% (91) |
| New York: | 4.9% (135,118) |
Number of families with income $60k - 75k:| Schuyler Falls: | 10.5% (123) |
| State: | 7.8% (216,254) |
Number of families with income $75k - 100k:| Schuyler Falls: | 16.2% (190) |
| State: | 12.4% (342,382) |
Number of families with income $100k - 125k:| Schuyler Falls: | 10.3% (122) |
| State: | 11.4% (314,917) |
Number of families with income $150k - 200k:| Schuyler Falls: | 23.1% (272) |
| New York: | 13.2% (365,586) |
Number of families with income > $200k:| Schuyler Falls: | 3.9% (46) |
| State: | 23.2% (642,319) |
Median non-family income in Schuyler Falls in 2022:| Schuyler Falls: | $50,344 |
| State: | $54,783 |
Change in median non-family income between 2000 and 2022:| Schuyler Falls, New York: | +88.1% |
| New York: | +87.9% |
Median per capita income in Schuyler Falls in 2022:| Schuyler Falls: | $37,385 |
| State: | $57,640 |
Change in median per capita income between 2000 and 2022:| Schuyler Falls, New York: | +104.3% |
| State: | +111.6% |
Income statistics for Black or African American residents
Median household income in Schuyler Falls, NY in 2022:| Schuyler Falls: | $104,265 |
| State: | $57,898 |
Change in median household income between 2000 and 2022:| Schuyler Falls, New York: | +100.2% |
| State: | +84.6% |
Number of households with income < $10k:| Schuyler Falls: | 12.0% (106,778) |
| State: | 12.0% (128,500) |
Number of households with income $10k - 20k:| Schuyler Falls: | 10.0% (89,273) |
| State: | 10.0% (107,541) |
Number of households with income $20k - 30k:| Schuyler Falls: | 8.4% (74,923) |
| State: | 8.4% (90,192) |
Number of households with income $30k - 40k:| Schuyler Falls: | 7.4% (66,034) |
| New York: | 7.4% (79,579) |
Number of households with income $40k - 50k:| Schuyler Falls: | 6.8% (60,211) |
| State: | 6.8% (72,491) |
Number of households with income $50k - 60k:| Schuyler Falls: | 6.6% (59,053) |
| State: | 6.7% (71,309) |
Number of households with income $60k - 75k:| Schuyler Falls: | 8.9% (78,948) |
| State: | 8.9% (95,050) |
Number of households with income $75k - 100k:| Schuyler Falls: | 11.5% (102,434) |
| New York: | 11.5% (123,569) |
Number of households with income $100k - 125k:| Schuyler Falls: | 8.1% (71,710) |
| State: | 8.1% (86,632) |
Number of households with income $125k - 150k:| Schuyler Falls: | 6.1% (53,800) |
| New York: | 6.0% (64,788) |
Number of households with income $150k - 200k:| Schuyler Falls: | 7.1% (63,483) |
| State: | 7.2% (76,644) |
Number of households with income > $200k:| Schuyler Falls: | 7.0% (61,994) |
| State: | 7.0% (75,062) |
Aggregate household income in Schuyler Falls in 2022: $15,032,595
Median non-family income in Schuyler Falls in 2022:| Schuyler Falls: | $186,129 |
| State: | $37,265 |
Change in median non-family income between 2000 and 2022:| Schuyler Falls, New York: | +104.6% |
| State: | +81.7% |
Median per capita income in Schuyler Falls in 2022:| Schuyler Falls: | $9,672 |
| State: | $31,947 |
Income statistics for Asian residents
Number of households with income < $10k:| Schuyler Falls: | 7.1% (1) |
| State: | 6.9% (42,537) |
Number of households with income $10k - 20k:| Schuyler Falls: | 7.1% (1) |
| State: | 7.3% (44,745) |
Number of households with income $20k - 30k:| Schuyler Falls: | 7.1% (1) |
| State: | 6.2% (38,249) |
Number of households with income $30k - 40k:| Schuyler Falls: | 0.0% (0) |
| State: | 5.5% (33,993) |
Number of households with income $40k - 50k:| Schuyler Falls: | 0.0% (0) |
| State: | 4.8% (29,795) |
Number of households with income $50k - 60k:| Schuyler Falls: | 7.1% (1) |
| State: | 5.2% (32,100) |
Number of households with income $60k - 75k:| Schuyler Falls: | 7.1% (1) |
| State: | 7.3% (44,615) |
Number of households with income $75k - 100k:| Schuyler Falls: | 14.3% (2) |
| State: | 10.8% (66,687) |
Number of households with income $100k - 125k:| Schuyler Falls: | 7.1% (1) |
| State: | 8.2% (50,233) |
Number of households with income $125k - 150k:| Schuyler Falls: | 7.1% (1) |
| State: | 7.2% (44,299) |
Number of households with income $150k - 200k:| Schuyler Falls: | 14.3% (2) |
| New York: | 10.4% (63,837) |
Number of households with income > $200k:| Schuyler Falls: | 21.4% (3) |
| State: | 20.1% (123,891) |
Aggregate household income in Schuyler Falls in 2022: $2,204,712
Median per capita income in Schuyler Falls in 2022:| Schuyler Falls: | $1,890 |
| State: | $46,726 |
Income statistics for Hispanic or Latino residents
Median household income in Schuyler Falls, NY in 2022:| Schuyler Falls: | $88,620 |
| State: | $60,468 |
Number of households with income < $10k:| Schuyler Falls: | 10.0% (213,088) |
| State: | 9.9% (127,185) |
Number of households with income $10k - 20k:| Schuyler Falls: | 10.7% (229,381) |
| New York: | 10.7% (136,699) |
Number of households with income $20k - 30k:| Schuyler Falls: | 8.1% (172,725) |
| State: | 8.1% (102,991) |
Number of households with income $30k - 40k:| Schuyler Falls: | 7.8% (167,303) |
| State: | 7.8% (100,149) |
Number of households with income $40k - 50k:| Schuyler Falls: | 6.8% (146,378) |
| State: | 6.9% (87,760) |
Number of households with income $50k - 60k:| Schuyler Falls: | 6.3% (135,548) |
| State: | 6.3% (80,968) |
Number of households with income $60k - 75k:| Schuyler Falls: | 8.6% (184,753) |
| New York: | 8.7% (110,631) |
Number of households with income $75k - 100k:| Schuyler Falls: | 11.2% (238,478) |
| State: | 11.2% (142,787) |
Number of households with income $100k - 125k:| Schuyler Falls: | 8.2% (174,752) |
| State: | 8.2% (104,850) |
Number of households with income $125k - 150k:| Schuyler Falls: | 6.3% (134,081) |
| New York: | 6.3% (80,274) |
Number of households with income $150k - 200k:| Schuyler Falls: | 7.4% (158,506) |
| State: | 7.4% (95,117) |
Number of households with income > $200k:| Schuyler Falls: | 8.6% (182,802) |
| State: | 8.6% (109,514) |
Aggregate household income in Schuyler Falls in 2022: $4,678,897
Median family income in Schuyler Falls in 2022:| Schuyler Falls: | $123,431 |
| State: | $68,770 |
Number of families with income < $10k:| Schuyler Falls: | 8.5% (20) |
| New York: | 6.9% (58,565) |
Number of families with income $10k - 20k:| Schuyler Falls: | 10.3% (25) |
| State: | 7.0% (59,058) |
Number of families with income $20k - 30k:| Schuyler Falls: | 12.2% (29) |
| New York: | 8.0% (68,048) |
Number of families with income $30k - 40k:| Schuyler Falls: | 13.9% (34) |
| State: | 8.4% (70,668) |
Number of families with income $40k - 50k:| Schuyler Falls: | 14.5% (35) |
| State: | 7.4% (62,941) |
Number of families with income $50k - 60k:| Schuyler Falls: | 8.8% (21) |
| State: | 6.6% (55,592) |
Number of families with income $60k - 75k:| Schuyler Falls: | 10.8% (26) |
| State: | 9.3% (78,564) |
Number of families with income $75k - 100k:| Schuyler Falls: | 11.5% (28) |
| State: | 12.6% (106,685) |
Number of families with income $100k - 125k:| Schuyler Falls: | 3.6% (9) |
| State: | 9.4% (79,139) |
Number of families with income $150k - 200k:| Schuyler Falls: | 4.6% (11) |
| State: | 8.3% (69,877) |
Number of families with income > $200k:| Schuyler Falls: | 1.4% (3) |
| New York: | 9.3% (78,555) |
Median per capita income in Schuyler Falls in 2022:| Schuyler Falls: | $20,913 |
| State: | $29,761 |
Change in median per capita income between 2000 and 2022:| Schuyler Falls, New York: | +20.2% |
| State: | +132.7% |
Income statistics for American Indian and Alaska Native residents
Number of households with income < $10k:| Schuyler Falls: | 6.2% (1) |
| State: | 8.6% (3,559) |
Number of households with income $10k - 20k:| Schuyler Falls: | 6.2% (1) |
| State: | 5.9% (2,455) |
Number of households with income $20k - 30k:| Schuyler Falls: | 12.5% (2) |
| State: | 8.2% (3,393) |
Number of households with income $30k - 40k:| Schuyler Falls: | 12.5% (2) |
| State: | 11.9% (4,918) |
Number of households with income $40k - 50k:| Schuyler Falls: | 6.2% (1) |
| New York: | 6.5% (2,682) |
Number of households with income $50k - 60k:| Schuyler Falls: | 6.2% (1) |
| State: | 6.1% (2,516) |
Number of households with income $60k - 75k:| Schuyler Falls: | 12.5% (2) |
| New York: | 10.0% (4,125) |
Number of households with income $75k - 100k:| Schuyler Falls: | 12.5% (2) |
| New York: | 13.3% (5,517) |
Number of households with income $100k - 125k:| Schuyler Falls: | 6.2% (1) |
| New York: | 8.4% (3,463) |
Number of households with income $125k - 150k:| Schuyler Falls: | 6.2% (1) |
| New York: | 7.0% (2,887) |
Number of households with income $150k - 200k:| Schuyler Falls: | 6.2% (1) |
| State: | 9.9% (4,106) |
Number of households with income > $200k:| Schuyler Falls: | 6.2% (1) |
| State: | 4.2% (1,744) |
Aggregate household income in Schuyler Falls in 2022: $997,250
Median per capita income in Schuyler Falls in 2022:| Schuyler Falls: | $43,717 |
| State: | $25,837 |
Change in median per capita income between 2000 and 2022:| Schuyler Falls, New York: | +75.0% |
| State: | +99.6% |
Income statistics for Multirace residents
Median household income in Schuyler Falls, NY in 2022:| Schuyler Falls: | $91,005 |
| State: | $73,557 |
Number of households with income < $10k:| Schuyler Falls: | 8.9% (89,345) |
| State: | 8.9% (57,924) |
Number of households with income $10k - 20k:| Schuyler Falls: | 8.7% (87,135) |
| New York: | 8.7% (56,590) |
Number of households with income $20k - 30k:| Schuyler Falls: | 7.1% (71,224) |
| New York: | 7.1% (46,287) |
Number of households with income $30k - 40k:| Schuyler Falls: | 6.9% (69,375) |
| New York: | 6.9% (45,132) |
Number of households with income $40k - 50k:| Schuyler Falls: | 5.8% (58,217) |
| New York: | 5.8% (37,946) |
Number of households with income $50k - 60k:| Schuyler Falls: | 5.6% (55,934) |
| State: | 5.6% (36,410) |
Number of households with income $60k - 75k:| Schuyler Falls: | 7.8% (78,022) |
| State: | 7.8% (50,819) |
Number of households with income $75k - 100k:| Schuyler Falls: | 11.7% (116,916) |
| State: | 11.7% (76,024) |
Number of households with income $100k - 125k:| Schuyler Falls: | 9.3% (93,037) |
| State: | 9.3% (60,635) |
Number of households with income $125k - 150k:| Schuyler Falls: | 6.2% (62,340) |
| State: | 6.2% (40,533) |
Number of households with income $150k - 200k:| Schuyler Falls: | 8.6% (86,718) |
| New York: | 8.6% (56,409) |
Number of households with income > $200k:| Schuyler Falls: | 13.4% (134,628) |
| State: | 13.4% (87,442) |
Aggregate household income in Schuyler Falls in 2022: $7,180,485
Median family income in Schuyler Falls in 2022:| Schuyler Falls: | $95,859 |
| State: | $85,788 |
Number of families with income $100k - 125k:| Schuyler Falls: | 100.0% (160) |
| New York: | 10.7% (43,036) |
Median non-family income in Schuyler Falls in 2022:| Schuyler Falls: | $20,899 |
| New York: | $46,403 |
Change in median non-family income between 2000 and 2022:| Schuyler Falls, New York: | +52.0% |
| State: | +113.6% |
Median per capita income in Schuyler Falls in 2022:| Schuyler Falls: | $41,376 |
| New York: | $36,931 |
Change in median per capita income between 2000 and 2022:| Schuyler Falls, New York: | +107.2% |
| State: | +158.8% |
Income statistics for other residents
Number of households with income < $10k:| Schuyler Falls: | 10.3% (84,651) |
| New York: | 10.3% (69,252) |
Number of households with income $10k - 20k:| Schuyler Falls: | 11.0% (90,417) |
| New York: | 11.0% (73,890) |
Number of households with income $20k - 30k:| Schuyler Falls: | 8.8% (72,374) |
| New York: | 8.8% (59,096) |
Number of households with income $30k - 40k:| Schuyler Falls: | 8.1% (66,625) |
| State: | 8.1% (54,418) |
Number of households with income $40k - 50k:| Schuyler Falls: | 7.3% (59,947) |
| State: | 7.3% (49,042) |
Number of households with income $50k - 60k:| Schuyler Falls: | 6.5% (53,835) |
| New York: | 6.5% (43,945) |
Number of households with income $60k - 75k:| Schuyler Falls: | 9.5% (78,399) |
| State: | 9.5% (64,087) |
Number of households with income $75k - 100k:| Schuyler Falls: | 10.9% (89,319) |
| State: | 10.9% (73,094) |
Number of households with income $100k - 125k:| Schuyler Falls: | 7.9% (64,752) |
| State: | 7.9% (53,055) |
Number of households with income $125k - 150k:| Schuyler Falls: | 5.9% (48,289) |
| State: | 5.9% (39,446) |
Number of households with income $150k - 200k:| Schuyler Falls: | 7.2% (59,283) |
| New York: | 7.2% (48,653) |
Number of households with income > $200k:| Schuyler Falls: | 6.6% (54,584) |
| State: | 6.6% (44,703) |
Median per capita income in Schuyler Falls in 2022:| Schuyler Falls: | $43,716 |
| State: | $26,975 |
Change in median per capita income between 2000 and 2022:| Schuyler Falls, New York: | +61.9% |
| New York: | +144.6% |