The median household income in Shady Hollow, TX in 2022 was $164,263, which was 56.0% greater than the median annual income of $72,284 across the entire state of Texas. Compared to the median income of $94,470 in 2000 this represents an increase of 42.5%. The per capita income in 2022 was $76,498, which means an increase of 56.2% compared to 2000 when it was $33,532.
Whole page based on the data from 2000 / 2022 when the population of Shady Hollow, Texas was 5,140 / 5,454
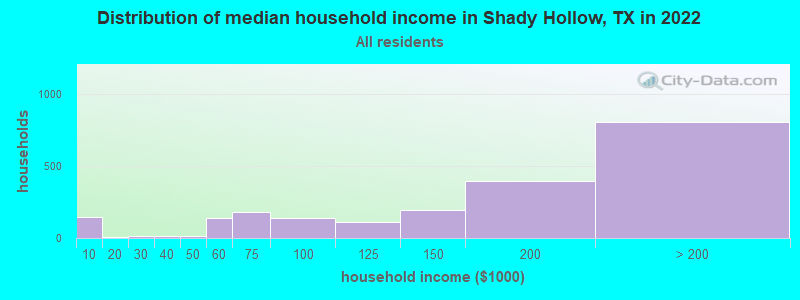
Income statistics for all residents
Median household income in Shady Hollow, TX in 2022:
Shady Hollow:
$164,263
Texas:
$72,284
Change in median household income between 2000 and 2022:
Shady Hollow, Texas:
+73.9%
State:
+81.0%
Number of households with income < $10k:
Shady Hollow:
6.7% (143)
Texas:
5.5% (611,011)
Number of households with income $10k - 20k:
Shady Hollow:
0.2% (5)
Texas:
6.7% (743,157)
Number of households with income $20k - 30k:
Shady Hollow:
0.7% (14)
State:
7.2% (803,381)
Number of households with income $30k - 40k:
Shady Hollow:
0.8% (17)
Texas:
7.8% (866,080)
Number of households with income $40k - 50k:
Shady Hollow:
0.6% (13)
State:
7.3% (810,440)
Number of households with income $50k - 60k:
Shady Hollow:
6.5% (139)
State:
7.2% (799,783)
Number of households with income $60k - 75k:
Shady Hollow:
8.3% (178)
Texas:
9.9% (1,095,384)
Number of households with income $75k - 100k:
Shady Hollow:
6.5% (139)
Texas:
12.8% (1,419,057)
Number of households with income $100k - 125k:
Shady Hollow:
5.2% (111)
Texas:
9.5% (1,054,577)
Number of households with income $125k - 150k:
Shady Hollow:
8.9% (191)
State:
6.7% (741,518)
Number of households with income $150k - 200k:
Shady Hollow:
18.4% (395)
State:
8.7% (961,776)
Number of households with income > $200k:
Shady Hollow:
37.4% (805)
State:
10.7% (1,181,544)
Aggregate household income in Shady Hollow in 2022: $425,742,098
Median family income in Shady Hollow in 2022:
Shady Hollow:
$179,117
Texas:
$86,267
Number of families with income < $10k:
Shady Hollow:
5.1% (86)
Texas:
4.0% (297,884)
Number of families with income $10k - 20k:
Shady Hollow:
0.2% (3)
State:
4.3% (324,514)
Number of families with income $30k - 40k:
Shady Hollow:
0.3% (5)
Texas:
6.6% (493,535)
Number of families with income $50k - 60k:
Shady Hollow:
4.2% (71)
Texas:
6.6% (492,203)
Number of families with income $60k - 75k:
Shady Hollow:
9.1% (152)
State:
9.5% (710,229)
Number of families with income $75k - 100k:
Shady Hollow:
6.6% (111)
State:
13.6% (1,015,480)
Number of families with income $100k - 125k:
Shady Hollow:
3.0% (50)
Texas:
10.7% (797,961)
Number of families with income $125k - 150k:
Shady Hollow:
10.7% (179)
State:
8.1% (602,985)
Number of families with income $150k - 200k:
Shady Hollow:
19.0% (319)
Texas:
10.7% (804,459)
Number of families with income > $200k:
Shady Hollow:
41.8% (702)
State:
13.5% (1,013,514)
Median non-family income in Shady Hollow in 2022:
Shady Hollow:
$54,218
State:
$45,999
Change in median non-family income between 2000 and 2022:: -31.5%
Shady Hollow, Texas:
-31.5%
Texas:
+79.5%
Median per capita income in Shady Hollow in 2022:
Shady Hollow:
$76,499
State:
$38,123
Change in median per capita income between 2000 and 2022:
Shady Hollow, Texas:
+128.1%
Texas:
+94.3%
Income statistics for White residents
Median household income in Shady Hollow, TX in 2022:
Shady Hollow:
$176,234
State:
$82,032
Change in median household income between 2000 and 2022:
Shady Hollow, Texas:
+84.8%
State:
+91.0%
Number of households with income < $10k:
Shady Hollow:
4.6% (69)
State:
4.7% (273,716)
Number of households with income $10k - 20k:
Shady Hollow:
0.0% (0)
Texas:
5.5% (322,702)
Number of households with income $20k - 30k:
Shady Hollow:
0.8% (12)
State:
6.2% (363,947)
Number of households with income $30k - 40k:
Shady Hollow:
0.4% (6)
State:
6.8% (399,275)
Number of households with income $40k - 50k:
Shady Hollow:
0.7% (10)
Texas:
6.5% (383,417)
Number of households with income $50k - 60k:
Shady Hollow:
5.1% (76)
State:
6.6% (388,535)
Number of households with income $60k - 75k:
Shady Hollow:
6.7% (100)
State:
9.7% (566,295)
Number of households with income $75k - 100k:
Shady Hollow:
2.7% (40)
State:
13.0% (760,276)
Number of households with income $100k - 125k:
Shady Hollow:
6.3% (94)
State:
10.2% (597,596)
Number of households with income $125k - 150k:
Shady Hollow:
10.6% (158)
State:
7.4% (436,830)
Number of households with income $150k - 200k:
Shady Hollow:
20.7% (307)
State:
9.9% (583,067)
Number of households with income > $200k:
Shady Hollow:
41.3% (614)
State:
13.5% (792,647)
Aggregate household income in Shady Hollow in 2022: $324,279,126
Median family income in Shady Hollow in 2022:
Shady Hollow:
$184,633
State:
$101,788
Number of families with income < $10k:
Shady Hollow:
4.9% (58)
Texas:
2.8% (108,142)
Number of families with income $30k - 40k:
Shady Hollow:
0.5% (6)
Texas:
5.2% (198,847)
Number of families with income $50k - 60k:
Shady Hollow:
5.2% (61)
Texas:
5.7% (220,689)
Number of families with income $60k - 75k:
Shady Hollow:
6.8% (80)
Texas:
9.0% (346,106)
Number of families with income $75k - 100k:
Shady Hollow:
2.7% (32)
Texas:
13.7% (527,363)
Number of families with income $100k - 125k:
Shady Hollow:
3.8% (45)
State:
11.6% (448,411)
Number of families with income $125k - 150k:
Shady Hollow:
12.5% (147)
State:
9.2% (355,798)
Number of families with income $150k - 200k:
Shady Hollow:
19.4% (227)
State:
12.5% (480,185)
Number of families with income > $200k:
Shady Hollow:
44.2% (519)
State:
17.6% (677,490)
Median non-family income in Shady Hollow in 2022:
Shady Hollow:
$124,707
Texas:
$50,587
Change in median non-family income between 2000 and 2022:
Shady Hollow, Texas:
+62.8%
State:
+87.7%
Median per capita income in Shady Hollow in 2022:
Shady Hollow:
$94,679
Texas:
$47,740
Income statistics for Black or African American residents
Number of households with income < $10k:
Shady Hollow:
14.9% (25)
Texas:
8.9% (126,378)
Number of households with income $10k - 20k:
Shady Hollow:
0.0% (0)
Texas:
9.9% (140,369)
Number of households with income $20k - 30k:
Shady Hollow:
0.0% (0)
State:
8.5% (120,639)
Number of households with income $30k - 40k:
Shady Hollow:
0.0% (0)
State:
9.7% (137,517)
Number of households with income $40k - 50k:
Shady Hollow:
0.0% (0)
State:
8.0% (112,973)
Number of households with income $50k - 60k:
Shady Hollow:
33.9% (57)
State:
8.3% (117,156)
Number of households with income $60k - 75k:
Shady Hollow:
0.0% (0)
State:
10.4% (147,462)
Number of households with income $75k - 100k:
Shady Hollow:
0.0% (0)
State:
11.5% (162,718)
Number of households with income $100k - 125k:
Shady Hollow:
0.0% (0)
Texas:
8.2% (115,829)
Number of households with income $125k - 150k:
Shady Hollow:
7.1% (12)
Texas:
4.9% (69,556)
Number of households with income $150k - 200k:
Shady Hollow:
0.0% (0)
State:
6.4% (90,701)
Number of households with income > $200k:
Shady Hollow:
44.0% (74)
Texas:
5.5% (77,988)
Aggregate household income in Shady Hollow in 2022: $31,067,746
Median family income in Shady Hollow in 2022:
Shady Hollow:
$308,407
State:
$69,134
Number of families with income < $10k:
Shady Hollow:
26.9% (36)
State:
6.8% (55,625)
Number of families with income $125k - 150k:
Shady Hollow:
10.6% (14)
State:
6.8% (55,615)
Number of families with income > $200k:
Shady Hollow:
62.5% (83)
State:
7.9% (64,439)
Median per capita income in Shady Hollow in 2022:
Shady Hollow:
$61,997
State:
$30,490
Change in median per capita income between 2000 and 2022:
Shady Hollow, Texas:
+89.7%
State:
+113.9%
Income statistics for Asian residents
Median household income in Shady Hollow, TX in 2022:
Shady Hollow:
$70,196
State:
$107,673
Change in median household income between 2000 and 2022:
Shady Hollow, Texas:
+101.5%
State:
+115.1%
Number of households with income < $10k:
Shady Hollow:
0.0% (0)
State:
5.2% (29,885)
Number of households with income $10k - 20k:
Shady Hollow:
0.0% (0)
State:
4.7% (27,044)
Number of households with income $20k - 30k:
Shady Hollow:
0.0% (0)
Texas:
4.1% (23,363)
Number of households with income $30k - 40k:
Shady Hollow:
0.0% (0)
State:
4.1% (23,309)
Number of households with income $40k - 50k:
Shady Hollow:
0.0% (0)
State:
5.2% (29,826)
Number of households with income $50k - 60k:
Shady Hollow:
0.0% (0)
State:
4.7% (26,512)
Number of households with income $60k - 75k:
Shady Hollow:
66.7% (68)
Texas:
6.5% (36,905)
Number of households with income $75k - 100k:
Shady Hollow:
22.5% (23)
State:
11.3% (64,350)
Number of households with income $100k - 125k:
Shady Hollow:
2.9% (3)
State:
11.4% (64,714)
Number of households with income $125k - 150k:
Shady Hollow:
0.0% (0)
Texas:
9.3% (52,719)
Number of households with income $150k - 200k:
Shady Hollow:
7.8% (8)
Texas:
12.5% (70,953)
Number of households with income > $200k:
Shady Hollow:
0.0% (0)
Texas:
21.1% (120,260)
Aggregate household income in Shady Hollow in 2022: $8,885,616
Median family income in Shady Hollow in 2022:
Shady Hollow:
$66,772
State:
$123,328
Number of families with income $60k - 75k:
Shady Hollow:
69.9% (79)
Texas:
6.1% (26,637)
Number of families with income $75k - 100k:
Shady Hollow:
22.6% (26)
Texas:
10.7% (46,626)
Number of families with income $150k - 200k:
Shady Hollow:
7.5% (9)
State:
14.7% (64,203)
Median per capita income in Shady Hollow in 2022:
Shady Hollow:
$38,022
State:
$48,626
Change in median per capita income between 2000 and 2022:
Shady Hollow, Texas:
+0.2%
Texas:
+132.0%
Income statistics for Hispanic or Latino residents
Median household income in Shady Hollow, TX in 2022:
Shady Hollow:
$183,339
Texas:
$60,504
Change in median household income between 2000 and 2022:
Shady Hollow, Texas:
+123.3%
State:
+102.5%
Number of households with income < $10k:
Shady Hollow:
0.0% (0)
State:
5.8% (213,953)
Number of households with income $10k - 20k:
Shady Hollow:
1.1% (4)
Texas:
8.0% (297,456)
Number of households with income $20k - 30k:
Shady Hollow:
0.0% (0)
State:
9.2% (340,166)
Number of households with income $30k - 40k:
Shady Hollow:
2.2% (8)
State:
9.5% (354,336)
Number of households with income $40k - 50k:
Shady Hollow:
0.0% (0)
Texas:
8.8% (327,013)
Number of households with income $50k - 60k:
Shady Hollow:
0.0% (0)
State:
8.3% (308,818)
Number of households with income $60k - 75k:
Shady Hollow:
2.5% (9)
State:
10.9% (405,109)
Number of households with income $75k - 100k:
Shady Hollow:
19.5% (71)
State:
13.8% (511,639)
Number of households with income $100k - 125k:
Shady Hollow:
4.9% (18)
Texas:
8.6% (319,728)
Number of households with income $125k - 150k:
Shady Hollow:
0.0% (0)
State:
5.7% (210,932)
Number of households with income $150k - 200k:
Shady Hollow:
18.4% (67)
State:
6.4% (236,055)
Number of households with income > $200k:
Shady Hollow:
51.5% (188)
State:
5.1% (189,259)
Aggregate household income in Shady Hollow in 2022: $74,709,441
Median family income in Shady Hollow in 2022:
Shady Hollow:
$189,650
State:
$65,080
Number of families with income $10k - 20k:
Shady Hollow:
2.2% (7)
State:
6.3% (174,531)
Number of families with income $60k - 75k:
Shady Hollow:
2.6% (9)
State:
10.9% (302,688)
Number of families with income $75k - 100k:
Shady Hollow:
16.6% (55)
State:
14.3% (398,554)
Number of families with income $100k - 125k:
Shady Hollow:
3.7% (12)
Texas:
9.5% (264,007)
Number of families with income $150k - 200k:
Shady Hollow:
19.3% (64)
State:
7.3% (202,259)
Number of families with income > $200k:
Shady Hollow:
55.7% (184)
State:
5.9% (165,129)
Median non-family income in Shady Hollow in 2022:
Shady Hollow:
$74,263
Texas:
$39,934
Change in median non-family income between 2000 and 2022:
Shady Hollow, Texas:
+137.6%
Texas:
+109.1%
Median per capita income in Shady Hollow in 2022:
Shady Hollow:
$57,939
State:
$24,862
Income statistics for American Indian and Alaska Native residents
Aggregate household income in Shady Hollow in 2022: $1,960,076
Median per capita income in Shady Hollow in 2022:
Shady Hollow:
$28,068
State:
$28,166
Change in median per capita income between 2000 and 2022:
Shady Hollow, Texas:
+30.9%
State:
+77.2%
Income statistics for Multirace residents
Number of households with income < $10k:
Shady Hollow:
14.0% (52)
State:
5.5% (122,324)
Number of households with income $10k - 20k:
Shady Hollow:
2.4% (9)
State:
8.2% (182,232)
Number of households with income $20k - 30k:
Shady Hollow:
0.0% (0)
State:
8.5% (189,456)
Number of households with income $30k - 40k:
Shady Hollow:
0.0% (0)
State:
8.9% (197,499)
Number of households with income $40k - 50k:
Shady Hollow:
0.0% (0)
State:
8.7% (191,735)
Number of households with income $50k - 60k:
Shady Hollow:
0.0% (0)
Texas:
8.0% (177,535)
Number of households with income $60k - 75k:
Shady Hollow:
0.0% (0)
Texas:
10.5% (232,479)
Number of households with income $75k - 100k:
Shady Hollow:
30.6% (114)
State:
13.1% (290,448)
Number of households with income $100k - 125k:
Shady Hollow:
0.0% (0)
Texas:
8.6% (191,595)
Number of households with income $125k - 150k:
Shady Hollow:
0.0% (0)
Texas:
6.0% (133,361)
Number of households with income $150k - 200k:
Shady Hollow:
21.2% (79)
Texas:
7.2% (159,195)
Number of households with income > $200k:
Shady Hollow:
31.7% (118)
Texas:
6.7% (148,064)
Aggregate household income in Shady Hollow in 2022: $54,379,813
Median family income in Shady Hollow in 2022:
Shady Hollow:
$160,777
State:
$69,780
Number of families with income $10k - 20k:
Shady Hollow:
3.7% (11)
Texas:
5.9% (95,279)
Number of families with income $75k - 100k:
Shady Hollow:
33.6% (104)
State:
14.0% (226,284)
Number of families with income $150k - 200k:
Shady Hollow:
26.0% (80)
Texas:
8.5% (137,607)
Number of families with income > $200k:
Shady Hollow:
36.7% (113)
Texas:
7.9% (127,299)
Median per capita income in Shady Hollow in 2022:
Shady Hollow:
$45,187
State:
$26,785
Income statistics for other residents
Median per capita income in Shady Hollow in 2022:
Shady Hollow:
$62,284
State:
$23,899
Discuss Shady Hollow, Texas (TX) on our hugely popular Texas forum.