The median household income in Shady Shores, TX in 2022 was $146,821, which was 50.8% greater than the median annual income of $72,284 across the entire state of Texas. Compared to the median income of $61,667 in 2000 this represents an increase of 58.0%. The per capita income in 2022 was $56,042, which means an increase of 53.7% compared to 2000 when it was $25,951.
Whole page based on the data from 2000 / 2022 when the population of Shady Shores, Texas was 1,461 / 3,003
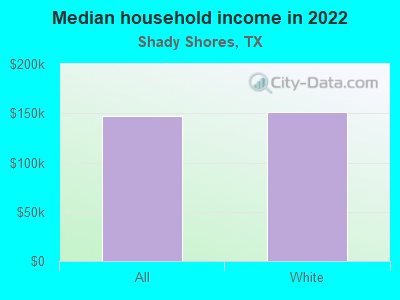
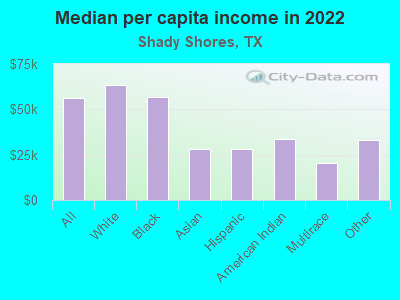
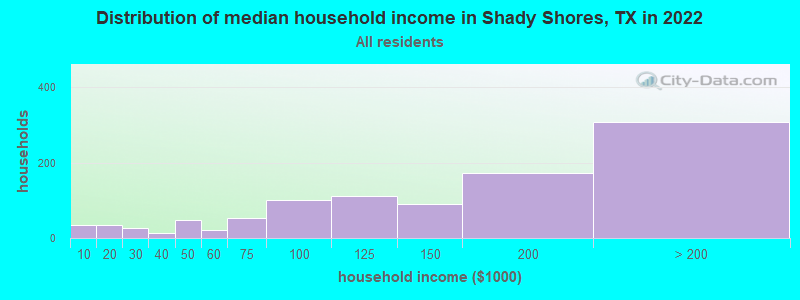
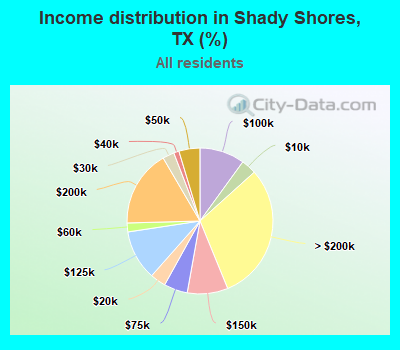
Income statistics for all residents
Median household income in Shady Shores, TX in 2022:
Shady Shores:
$146,822
State:
$72,284
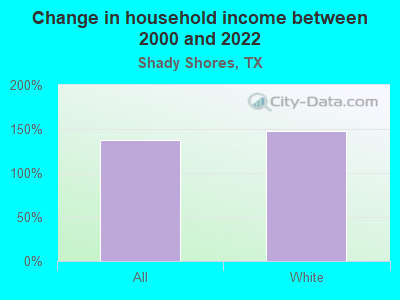
Change in median household income between 2000 and 2022:
Shady Shores, Texas:
+138.1%
State:
+81.0%
Number of households with income < $10k:
Shady Shores:
3.4% (34)
Texas:
5.5% (611,011)
Number of households with income $10k - 20k:
Shady Shores:
3.5% (35)
Texas:
6.7% (743,157)
Number of households with income $20k - 30k:
Shady Shores:
2.6% (26)
State:
7.2% (803,381)
Number of households with income $30k - 40k:
Shady Shores:
1.2% (12)
Texas:
7.8% (866,080)
Number of households with income $40k - 50k:
Shady Shores:
4.6% (47)
State:
7.3% (810,440)
Number of households with income $50k - 60k:
Shady Shores:
2.0% (20)
Texas:
7.2% (799,783)
Number of households with income $60k - 75k:
Shady Shores:
5.2% (53)
Texas:
9.9% (1,095,384)
Number of households with income $75k - 100k:
Shady Shores:
10.0% (101)
State:
12.8% (1,419,057)
Number of households with income $100k - 125k:
Shady Shores:
11.1% (112)
Texas:
9.5% (1,054,577)
Number of households with income $125k - 150k:
Shady Shores:
9.0% (91)
State:
6.7% (741,518)
Number of households with income $150k - 200k:
Shady Shores:
17.0% (172)
Texas:
8.7% (961,776)
Number of households with income > $200k:
Shady Shores:
30.5% (308)
Texas:
10.7% (1,181,544)
Aggregate household income in Shady Shores in 2022: $163,426,891
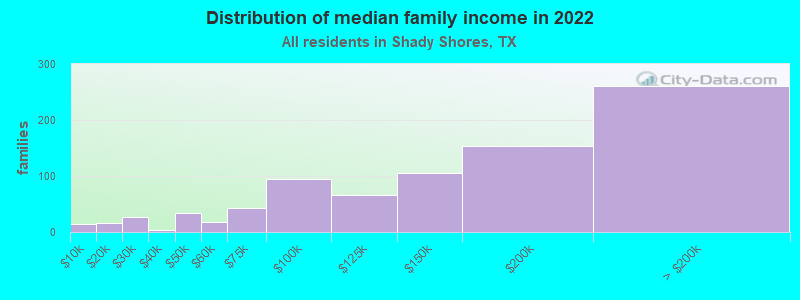
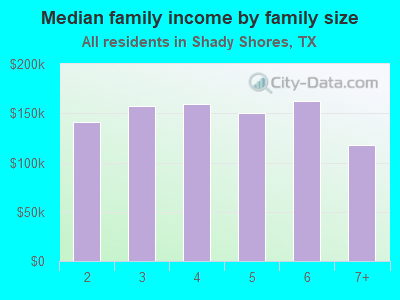
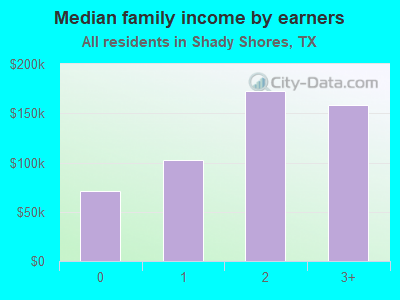
Median family income in Shady Shores in 2022:
Shady Shores:
$150,909
State:
$86,267
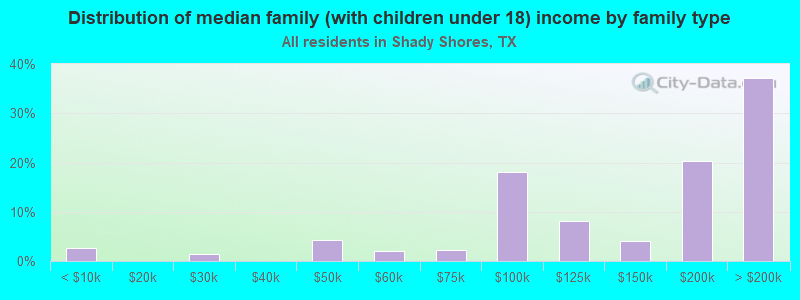
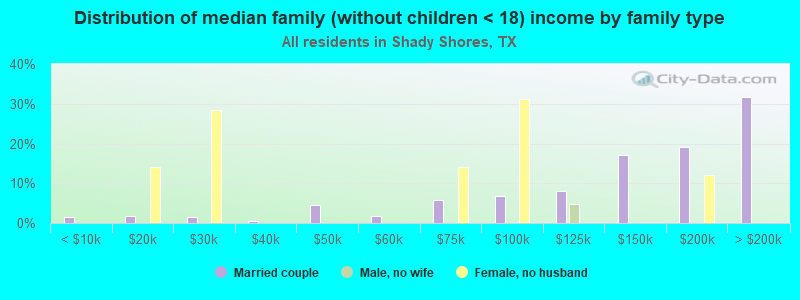
Number of families with income < $10k:
Shady Shores:
1.7% (14)
State:
4.0% (297,884)
Number of families with income $10k - 20k:
Shady Shores:
1.9% (16)
State:
4.3% (324,514)
Number of families with income $20k - 30k:
Shady Shores:
3.1% (26)
State:
5.8% (430,949)
Number of families with income $30k - 40k:
Shady Shores:
0.4% (3)
State:
6.6% (493,535)
Number of families with income $40k - 50k:
Shady Shores:
4.1% (34)
State:
6.7% (499,663)
Number of families with income $50k - 60k:
Shady Shores:
2.2% (18)
State:
6.6% (492,203)
Number of families with income $60k - 75k:
Shady Shores:
5.2% (43)
State:
9.5% (710,229)
Number of families with income $75k - 100k:
Shady Shores:
11.4% (95)
State:
13.6% (1,015,480)
Number of families with income $100k - 125k:
Shady Shores:
7.9% (66)
State:
10.7% (797,961)
Number of families with income $125k - 150k:
Shady Shores:
12.6% (105)
State:
8.1% (602,985)
Number of families with income $150k - 200k:
Shady Shores:
18.4% (153)
State:
10.7% (804,459)
Number of families with income > $200k:
Shady Shores:
31.2% (260)
Texas:
13.5% (1,013,514)
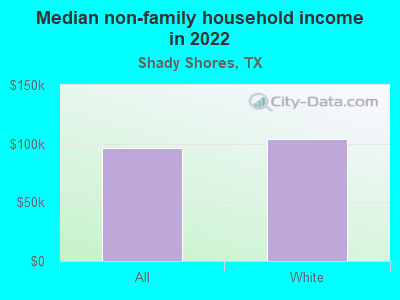
Median non-family income in Shady Shores in 2022:
Shady Shores:
$96,250
State:
$45,999
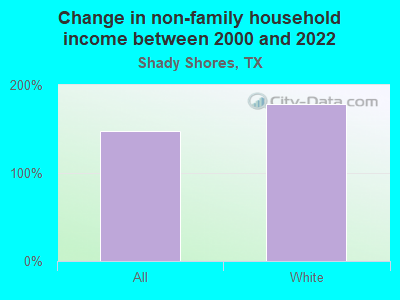
Change in median non-family income between 2000 and 2022:
Shady Shores, Texas:
+148.4%
Texas:
+79.5%
Median per capita income in Shady Shores in 2022:
Shady Shores:
$56,043
Texas:
$38,123
Change in median per capita income between 2000 and 2022:
Shady Shores, Texas:
+116.0%
State:
+94.3%
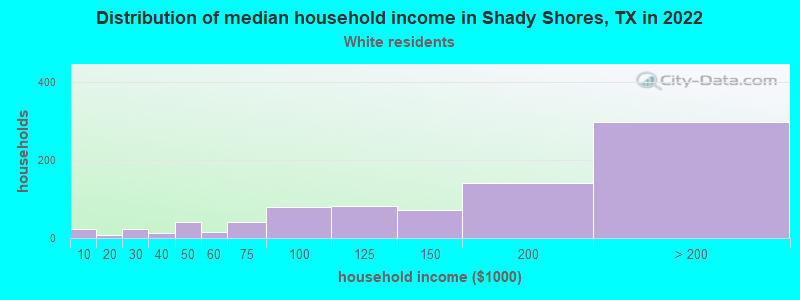
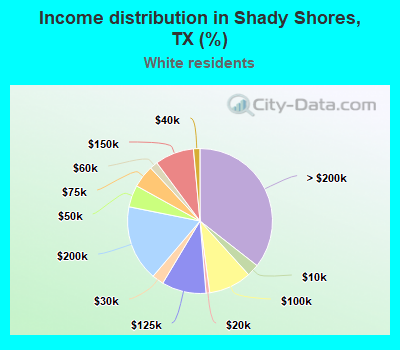
Income statistics for White residents
Median household income in Shady Shores, TX in 2022:
Shady Shores:
$151,708
Texas:
$82,032
Change in median household income between 2000 and 2022:
Shady Shores, Texas:
+148.0%
Texas:
+91.0%
Number of households with income < $10k:
Shady Shores:
2.7% (23)
Texas:
4.7% (273,716)
Number of households with income $10k - 20k:
Shady Shores:
0.8% (7)
State:
5.5% (322,702)
Number of households with income $20k - 30k:
Shady Shores:
2.6% (22)
State:
6.2% (363,947)
Number of households with income $30k - 40k:
Shady Shores:
1.4% (12)
Texas:
6.8% (399,275)
Number of households with income $40k - 50k:
Shady Shores:
4.9% (41)
State:
6.5% (383,417)
Number of households with income $50k - 60k:
Shady Shores:
1.8% (15)
Texas:
6.6% (388,535)
Number of households with income $60k - 75k:
Shady Shores:
5.0% (42)
State:
9.7% (566,295)
Number of households with income $75k - 100k:
Shady Shores:
9.5% (80)
State:
13.0% (760,276)
Number of households with income $100k - 125k:
Shady Shores:
9.9% (83)
Texas:
10.2% (597,596)
Number of households with income $125k - 150k:
Shady Shores:
8.7% (73)
Texas:
7.4% (436,830)
Number of households with income $150k - 200k:
Shady Shores:
16.9% (142)
State:
9.9% (583,067)
Number of households with income > $200k:
Shady Shores:
35.6% (298)
State:
13.5% (792,647)
Aggregate household income in Shady Shores in 2022: $143,121,992
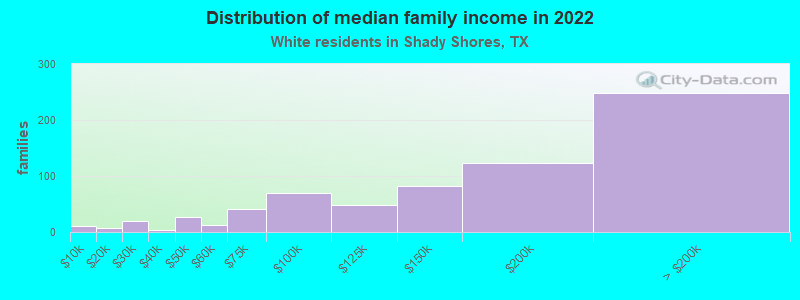
Median family income in Shady Shores in 2022:
Shady Shores:
$159,988
State:
$101,788
Number of families with income < $10k:
Shady Shores:
1.6% (11)
State:
2.8% (108,142)
Number of families with income $10k - 20k:
Shady Shores:
1.2% (8)
State:
2.9% (113,421)
Number of families with income $20k - 30k:
Shady Shores:
2.8% (19)
State:
4.1% (157,688)
Number of families with income $30k - 40k:
Shady Shores:
0.4% (3)
Texas:
5.2% (198,847)
Number of families with income $40k - 50k:
Shady Shores:
3.7% (26)
State:
5.6% (216,490)
Number of families with income $50k - 60k:
Shady Shores:
1.7% (12)
State:
5.7% (220,689)
Number of families with income $60k - 75k:
Shady Shores:
5.9% (41)
Texas:
9.0% (346,106)
Number of families with income $75k - 100k:
Shady Shores:
10.1% (70)
State:
13.7% (527,363)
Number of families with income $100k - 125k:
Shady Shores:
6.9% (48)
Texas:
11.6% (448,411)
Number of families with income $125k - 150k:
Shady Shores:
12.0% (83)
State:
9.2% (355,798)
Number of families with income $150k - 200k:
Shady Shores:
17.7% (123)
State:
12.5% (480,185)
Number of families with income > $200k:
Shady Shores:
35.9% (249)
State:
17.6% (677,490)
Median non-family income in Shady Shores in 2022:
Shady Shores:
$104,370
Texas:
$50,587
Median per capita income in Shady Shores in 2022:
Shady Shores:
$63,627
Texas:
$47,740
Change in median per capita income between 2000 and 2022:
Shady Shores, Texas:
+148.6%
State:
+114.3%
Income statistics for Black or African American residents
Aggregate household income in Shady Shores in 2022: $8,607,898
Median per capita income in Shady Shores in 2022:
Shady Shores:
$56,952
Texas:
$30,490
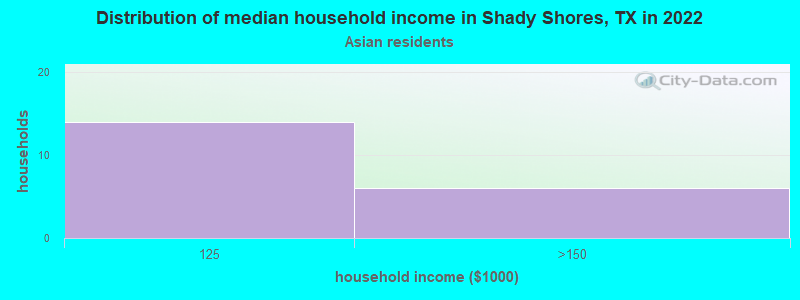
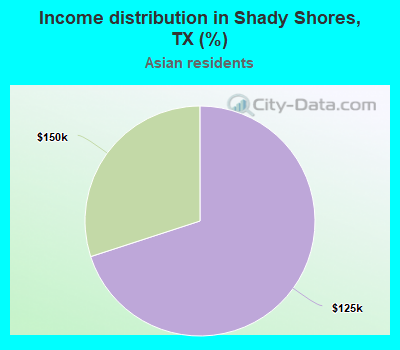
Income statistics for Asian residents
Number of households with income < $10k:
Shady Shores:
0.0% (0)
State:
5.2% (29,885)
Number of households with income $10k - 20k:
Shady Shores:
0.0% (0)
Texas:
4.7% (27,044)
Number of households with income $20k - 30k:
Shady Shores:
0.0% (0)
Texas:
4.1% (23,363)
Number of households with income $30k - 40k:
Shady Shores:
0.0% (0)
Texas:
4.1% (23,309)
Number of households with income $40k - 50k:
Shady Shores:
0.0% (0)
State:
5.2% (29,826)
Number of households with income $50k - 60k:
Shady Shores:
0.0% (0)
Texas:
4.7% (26,512)
Number of households with income $60k - 75k:
Shady Shores:
0.0% (0)
Texas:
6.5% (36,905)
Number of households with income $75k - 100k:
Shady Shores:
0.0% (0)
State:
11.3% (64,350)
Number of households with income $100k - 125k:
Shady Shores:
70.0% (14)
Texas:
11.4% (64,714)
Number of households with income $125k - 150k:
Shady Shores:
30.0% (6)
State:
9.3% (52,719)
Number of households with income $150k - 200k:
Shady Shores:
0.0% (0)
State:
12.5% (70,953)
Number of households with income > $200k:
Shady Shores:
0.0% (0)
Texas:
21.1% (120,260)
Aggregate household income in Shady Shores in 2022: $12,119,083
Median per capita income in Shady Shores in 2022:
Shady Shores:
$28,338
Texas:
$48,626
Change in median per capita income between 2000 and 2022:: -75.8%
Shady Shores, Texas:
-75.8%
Texas:
+132.0%
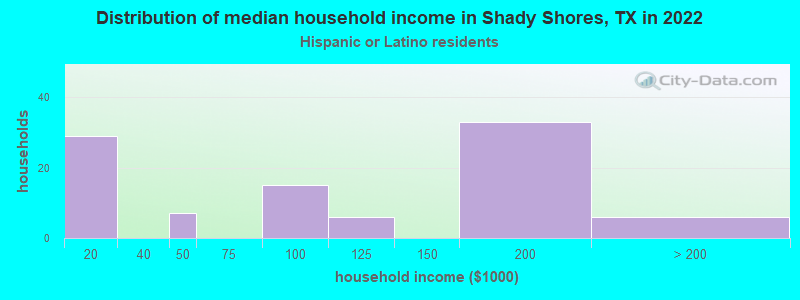
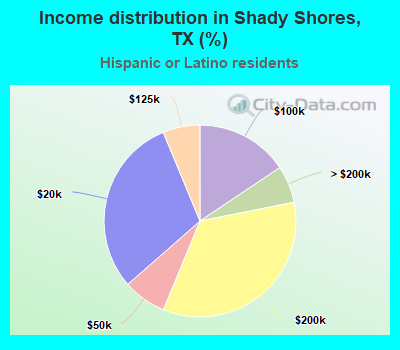
Income statistics for Hispanic or Latino residents
Number of households with income < $10k:
Shady Shores:
0.0% (0)
State:
5.8% (213,953)
Number of households with income $10k - 20k:
Shady Shores:
30.2% (29)
State:
8.0% (297,456)
Number of households with income $20k - 30k:
Shady Shores:
0.0% (0)
State:
9.2% (340,166)
Number of households with income $30k - 40k:
Shady Shores:
0.0% (0)
Texas:
9.5% (354,336)
Number of households with income $40k - 50k:
Shady Shores:
7.3% (7)
Texas:
8.8% (327,013)
Number of households with income $50k - 60k:
Shady Shores:
0.0% (0)
State:
8.3% (308,818)
Number of households with income $60k - 75k:
Shady Shores:
0.0% (0)
Texas:
10.9% (405,109)
Number of households with income $75k - 100k:
Shady Shores:
15.6% (15)
Texas:
13.8% (511,639)
Number of households with income $100k - 125k:
Shady Shores:
6.2% (6)
State:
8.6% (319,728)
Number of households with income $125k - 150k:
Shady Shores:
0.0% (0)
State:
5.7% (210,932)
Number of households with income $150k - 200k:
Shady Shores:
34.4% (33)
Texas:
6.4% (236,055)
Number of households with income > $200k:
Shady Shores:
6.2% (6)
State:
5.1% (189,259)
Aggregate household income in Shady Shores in 2022: $9,482,487
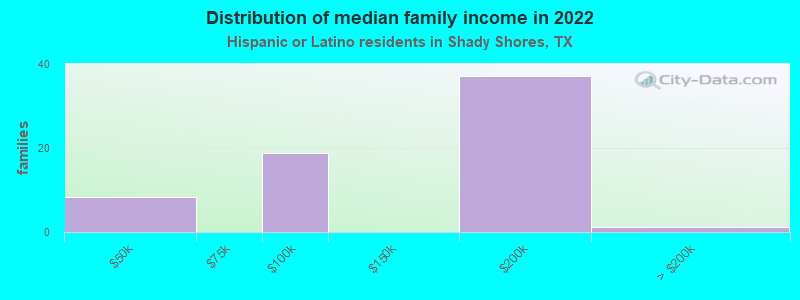
Median family income in Shady Shores in 2022:
Shady Shores:
$158,020
Texas:
$65,080
Number of families with income $40k - 50k:
Shady Shores:
12.7% (8)
State:
8.6% (240,188)
Number of families with income $75k - 100k:
Shady Shores:
28.6% (19)
State:
14.3% (398,554)
Number of families with income $150k - 200k:
Shady Shores:
56.9% (37)
Texas:
7.3% (202,259)
Number of families with income > $200k:
Shady Shores:
1.8% (1)
State:
5.9% (165,129)
Median per capita income in Shady Shores in 2022:
Shady Shores:
$27,965
Texas:
$24,862
Change in median per capita income between 2000 and 2022:
Shady Shores, Texas:
+114.7%
State:
+130.8%
Income statistics for American Indian and Alaska Native residents
Aggregate household income in Shady Shores in 2022: $1,072,928
Median per capita income in Shady Shores in 2022:
Shady Shores:
$33,665
Texas:
$28,166
Change in median per capita income between 2000 and 2022:: -33.6%
Shady Shores, Texas:
-33.6%
Texas:
+77.2%
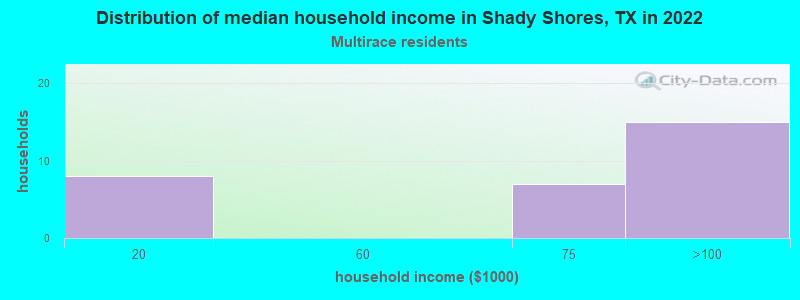
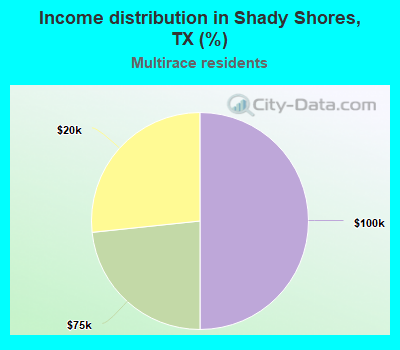
Income statistics for Multirace residents
Number of households with income < $10k:
Shady Shores:
0.0% (0)
State:
5.5% (122,324)
Number of households with income $10k - 20k:
Shady Shores:
26.7% (8)
Texas:
8.2% (182,232)
Number of households with income $20k - 30k:
Shady Shores:
0.0% (0)
State:
8.5% (189,456)
Number of households with income $30k - 40k:
Shady Shores:
0.0% (0)
Texas:
8.9% (197,499)
Number of households with income $40k - 50k:
Shady Shores:
0.0% (0)
State:
8.7% (191,735)
Number of households with income $50k - 60k:
Shady Shores:
0.0% (0)
State:
8.0% (177,535)
Number of households with income $60k - 75k:
Shady Shores:
23.3% (7)
State:
10.5% (232,479)
Number of households with income $75k - 100k:
Shady Shores:
50.0% (15)
Texas:
13.1% (290,448)
Number of households with income $100k - 125k:
Shady Shores:
0.0% (0)
State:
8.6% (191,595)
Number of households with income $125k - 150k:
Shady Shores:
0.0% (0)
State:
6.0% (133,361)
Number of households with income $150k - 200k:
Shady Shores:
0.0% (0)
Texas:
7.2% (159,195)
Number of households with income > $200k:
Shady Shores:
0.0% (0)
State:
6.7% (148,064)
Aggregate household income in Shady Shores in 2022: $2,492,198
Median per capita income in Shady Shores in 2022:
Shady Shores:
$20,679
State:
$26,785
Change in median per capita income between 2000 and 2022:: -44.3%
Shady Shores, Texas:
-44.3%
State:
+110.9%
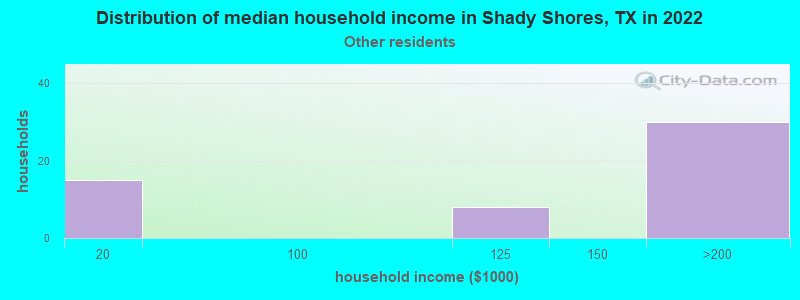
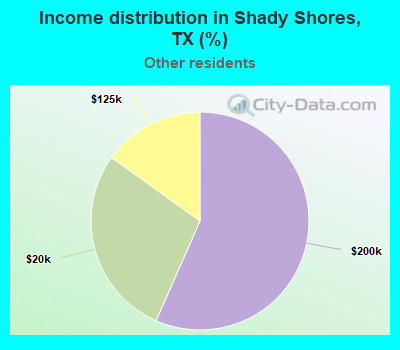
Income statistics for other residents
Number of households with income < $10k:
Shady Shores:
0.0% (0)
State:
5.9% (54,162)
Number of households with income $10k - 20k:
Shady Shores:
28.3% (15)
State:
6.8% (62,891)
Number of households with income $20k - 30k:
Shady Shores:
0.0% (0)
State:
10.6% (97,294)
Number of households with income $30k - 40k:
Shady Shores:
0.0% (0)
State:
10.8% (99,670)
Number of households with income $40k - 50k:
Shady Shores:
0.0% (0)
State:
9.3% (85,548)
Number of households with income $50k - 60k:
Shady Shores:
0.0% (0)
Texas:
9.0% (82,757)
Number of households with income $60k - 75k:
Shady Shores:
0.0% (0)
Texas:
10.9% (100,326)
Number of households with income $75k - 100k:
Shady Shores:
0.0% (0)
Texas:
14.0% (128,767)
Number of households with income $100k - 125k:
Shady Shores:
15.1% (8)
Texas:
8.2% (75,218)
Number of households with income $125k - 150k:
Shady Shores:
0.0% (0)
Texas:
4.8% (44,223)
Number of households with income $150k - 200k:
Shady Shores:
56.6% (30)
State:
5.6% (51,376)
Number of households with income > $200k:
Shady Shores:
0.0% (0)
State:
4.0% (36,393)
Aggregate household income in Shady Shores in 2022: $6,197,027
Median per capita income in Shady Shores in 2022:
Shady Shores:
$33,155
State:
$23,899
Change in median per capita income between 2000 and 2022:
Shady Shores, Texas:
+61.7%
State:
+135.2%
Discuss Shady Shores, Texas (TX) on our hugely popular Texas forum.