Shandaken, New York (NY) income map, earnings map, and wages data
The median household income in Shandaken, NY in 2022 was $59,623, which was 33.4% less than the median annual income of $79,557 across the entire state of New York. Compared to the median income of $31,566 in 2000 this represents an increase of 47.1%. The per capita income in 2022 was $46,532, which means an increase of 54.6% compared to 2000 when it was $21,121.
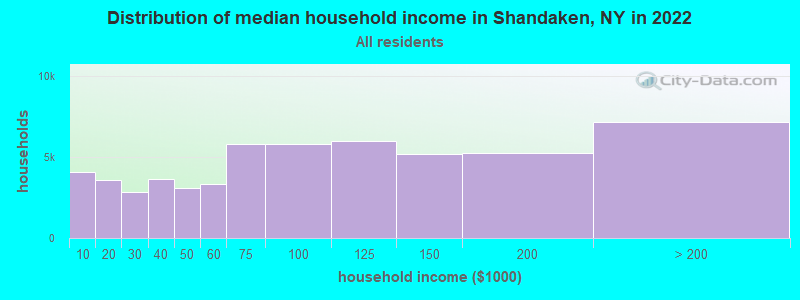
Income statistics for all residents
Median household income in Shandaken, NY in 2022:| Shandaken: | $59,623 |
| New York: | $79,557 |
Change in median household income between 2000 and 2022:| Shandaken, New York: | +88.9% |
| State: | +83.3% |
Number of households with income < $10k:| Shandaken: | 7.3% (4,059) |
| State: | 6.8% (527,598) |
Number of households with income $10k - 20k:| Shandaken: | 6.4% (3,578) |
| New York: | 7.4% (574,940) |
Number of households with income $20k - 30k:| Shandaken: | 5.1% (2,826) |
| State: | 6.7% (517,718) |
Number of households with income $30k - 40k:| Shandaken: | 6.5% (3,628) |
| New York: | 6.5% (506,674) |
Number of households with income $40k - 50k:| Shandaken: | 5.6% (3,116) |
| New York: | 6.1% (470,439) |
Number of households with income $50k - 60k:| Shandaken: | 6.0% (3,355) |
| State: | 5.8% (454,042) |
Number of households with income $60k - 75k:| Shandaken: | 10.5% (5,839) |
| New York: | 8.5% (657,508) |
Number of households with income $75k - 100k:| Shandaken: | 10.4% (5,792) |
| State: | 11.6% (899,824) |
Number of households with income $100k - 125k:| Shandaken: | 10.7% (5,969) |
| State: | 9.3% (723,825) |
Number of households with income $125k - 150k:| Shandaken: | 9.3% (5,204) |
| State: | 7.1% (552,420) |
Number of households with income $150k - 200k:| Shandaken: | 9.4% (5,241) |
| State: | 9.4% (727,051) |
Number of households with income > $200k:| Shandaken: | 12.9% (7,169) |
| State: | 15.0% (1,162,269) |
Aggregate household income in Shandaken in 2022: $273,466,995
Median family income in Shandaken in 2022:| Shandaken: | $87,384 |
| State: | $99,066 |
Median non-family income in Shandaken in 2022:| Shandaken: | $42,089 |
| State: | $50,181 |
Change in median non-family income between 2000 and 2022:| Shandaken, New York: | +101.7% |
| State: | +85.4% |
Median per capita income in Shandaken in 2022:| Shandaken: | $46,533 |
| New York: | $47,421 |
Change in median per capita income between 2000 and 2022:| Shandaken, New York: | +120.3% |
| New York: | +102.7% |
Income statistics for White residents
Median household income in Shandaken, NY in 2022:| Shandaken: | $62,417 |
| State: | $89,408 |
Change in median household income between 2000 and 2022:| Shandaken, New York: | +97.0% |
| State: | +85.5% |
Number of households with income < $10k:| Shandaken: | 6.2% (2,826) |
| State: | 4.8% (225,550) |
Number of households with income $10k - 20k:| Shandaken: | 5.9% (2,665) |
| State: | 6.1% (289,425) |
Number of households with income $20k - 30k:| Shandaken: | 4.6% (2,083) |
| New York: | 5.9% (280,254) |
Number of households with income $30k - 40k:| Shandaken: | 5.5% (2,509) |
| State: | 6.1% (288,263) |
Number of households with income $40k - 50k:| Shandaken: | 5.5% (2,511) |
| State: | 5.9% (278,079) |
Number of households with income $50k - 60k:| Shandaken: | 5.3% (2,383) |
| New York: | 5.7% (267,554) |
Number of households with income $60k - 75k:| Shandaken: | 11.0% (4,998) |
| State: | 8.4% (398,344) |
Number of households with income $75k - 100k:| Shandaken: | 11.5% (5,217) |
| New York: | 11.8% (554,841) |
Number of households with income $100k - 125k:| Shandaken: | 10.9% (4,956) |
| State: | 10.0% (469,794) |
Number of households with income $125k - 150k:| Shandaken: | 10.6% (4,783) |
| New York: | 7.6% (360,467) |
Number of households with income $150k - 200k:| Shandaken: | 8.8% (3,978) |
| State: | 10.1% (477,078) |
Number of households with income > $200k:| Shandaken: | 14.1% (6,386) |
| New York: | 17.6% (829,233) |
Aggregate household income in Shandaken in 2022: $229,042,402
Median family income in Shandaken in 2022:| Shandaken: | $88,505 |
| State: | $115,170 |
Number of families with income < $10k:| Shandaken: | 4.3% (33) |
| State: | 2.5% (68,851) |
Number of families with income $10k - 20k:| Shandaken: | 3.0% (23) |
| New York: | 3.0% (83,127) |
Number of families with income $20k - 30k:| Shandaken: | 3.7% (29) |
| State: | 3.5% (97,578) |
Number of families with income $30k - 40k:| Shandaken: | 3.7% (29) |
| New York: | 4.1% (114,108) |
Number of families with income $40k - 50k:| Shandaken: | 3.6% (28) |
| State: | 4.7% (130,902) |
Number of families with income $50k - 60k:| Shandaken: | 0.9% (7) |
| State: | 4.9% (135,118) |
Number of families with income $60k - 75k:| Shandaken: | 9.6% (75) |
| New York: | 7.8% (216,254) |
Number of families with income $75k - 100k:| Shandaken: | 4.3% (34) |
| State: | 12.4% (342,382) |
Number of families with income $100k - 125k:| Shandaken: | 12.5% (97) |
| State: | 11.4% (314,917) |
Number of families with income $125k - 150k:| Shandaken: | 13.6% (106) |
| State: | 9.4% (260,489) |
Number of families with income $150k - 200k:| Shandaken: | 11.0% (85) |
| State: | 13.2% (365,586) |
Number of families with income > $200k:| Shandaken: | 29.7% (231) |
| State: | 23.2% (642,319) |
Median non-family income in Shandaken in 2022:| Shandaken: | $46,945 |
| State: | $54,783 |
Change in median non-family income between 2000 and 2022:| Shandaken, New York: | +118.3% |
| State: | +87.9% |
Median per capita income in Shandaken in 2022:| Shandaken: | $51,247 |
| New York: | $57,640 |
Change in median per capita income between 2000 and 2022:| Shandaken, New York: | +135.2% |
| New York: | +111.6% |
Income statistics for Asian residents
Median household income in Shandaken, NY in 2022:| Shandaken: | $166,561 |
| State: | $89,947 |
Number of households with income < $10k:| Shandaken: | 6.9% (20,167) |
| New York: | 6.9% (42,537) |
Number of households with income $10k - 20k:| Shandaken: | 7.3% (21,219) |
| State: | 7.3% (44,745) |
Number of households with income $20k - 30k:| Shandaken: | 6.2% (18,170) |
| New York: | 6.2% (38,249) |
Number of households with income $30k - 40k:| Shandaken: | 5.5% (16,117) |
| State: | 5.5% (33,993) |
Number of households with income $40k - 50k:| Shandaken: | 4.9% (14,147) |
| State: | 4.8% (29,795) |
Number of households with income $50k - 60k:| Shandaken: | 5.2% (15,131) |
| State: | 5.2% (32,100) |
Number of households with income $60k - 75k:| Shandaken: | 7.3% (21,141) |
| State: | 7.3% (44,615) |
Number of households with income $75k - 100k:| Shandaken: | 10.9% (31,612) |
| New York: | 10.8% (66,687) |
Number of households with income $100k - 125k:| Shandaken: | 8.2% (23,751) |
| State: | 8.2% (50,233) |
Number of households with income $125k - 150k:| Shandaken: | 7.2% (20,986) |
| New York: | 7.2% (44,299) |
Number of households with income $150k - 200k:| Shandaken: | 10.4% (30,194) |
| State: | 10.4% (63,837) |
Number of households with income > $200k:| Shandaken: | 20.1% (58,596) |
| New York: | 20.1% (123,891) |
Aggregate household income in Shandaken in 2022: $9,003,568
Median family income in Shandaken in 2022:| Shandaken: | $116,214 |
| State: | $98,136 |
Number of families with income $10k - 20k:| Shandaken: | 29.9% (10) |
| New York: | 5.2% (22,725) |
Number of families with income $40k - 50k:| Shandaken: | 18.8% (6) |
| State: | 5.2% (22,750) |
Number of families with income $100k - 125k:| Shandaken: | 51.3% (17) |
| New York: | 8.6% (37,796) |
Median per capita income in Shandaken in 2022:| Shandaken: | $44,920 |
| State: | $46,726 |
Income statistics for Hispanic or Latino residents
Median household income in Shandaken, NY in 2022:| Shandaken: | $49,508 |
| New York: | $60,468 |
Change in median household income between 2000 and 2022:| Shandaken, New York: | +14.1% |
| State: | +98.3% |
Number of households with income < $10k:| Shandaken: | 18.4% (1,527) |
| State: | 9.9% (127,185) |
Number of households with income $10k - 20k:| Shandaken: | 11.3% (936) |
| State: | 10.7% (136,699) |
Number of households with income $20k - 30k:| Shandaken: | 3.5% (288) |
| State: | 8.1% (102,991) |
Number of households with income $30k - 40k:| Shandaken: | 14.1% (1,167) |
| State: | 7.8% (100,149) |
Number of households with income $40k - 50k:| Shandaken: | 11.8% (976) |
| State: | 6.9% (87,760) |
Number of households with income $50k - 60k:| Shandaken: | 4.6% (384) |
| State: | 6.3% (80,968) |
Number of households with income $60k - 75k:| Shandaken: | 3.3% (277) |
| State: | 8.7% (110,631) |
Number of households with income $75k - 100k:| Shandaken: | 4.9% (405) |
| State: | 11.2% (142,787) |
Number of households with income $100k - 125k:| Shandaken: | 10.8% (892) |
| New York: | 8.2% (104,850) |
Number of households with income $125k - 150k:| Shandaken: | 6.1% (504) |
| State: | 6.3% (80,274) |
Number of households with income $150k - 200k:| Shandaken: | 7.3% (608) |
| State: | 7.4% (95,117) |
Number of households with income > $200k:| Shandaken: | 3.9% (326) |
| State: | 8.6% (109,514) |
Aggregate household income in Shandaken in 2022: $16,002,306
Median family income in Shandaken in 2022:| Shandaken: | $49,045 |
| New York: | $68,770 |
Number of families with income < $10k:| Shandaken: | 7.6% (11) |
| State: | 6.9% (58,565) |
Number of families with income $10k - 20k:| Shandaken: | 14.3% (20) |
| State: | 7.0% (59,058) |
Number of families with income $20k - 30k:| Shandaken: | 15.3% (22) |
| New York: | 8.0% (68,048) |
Number of families with income $30k - 40k:| Shandaken: | 14.8% (21) |
| State: | 8.4% (70,668) |
Number of families with income $40k - 50k:| Shandaken: | 7.9% (11) |
| State: | 7.4% (62,941) |
Number of families with income $50k - 60k:| Shandaken: | 2.0% (3) |
| New York: | 6.6% (55,592) |
Number of families with income $60k - 75k:| Shandaken: | 11.1% (16) |
| State: | 9.3% (78,564) |
Number of families with income $75k - 100k:| Shandaken: | 5.0% (7) |
| State: | 12.6% (106,685) |
Number of families with income $100k - 125k:| Shandaken: | 8.9% (13) |
| State: | 9.4% (79,139) |
Number of families with income $125k - 150k:| Shandaken: | 5.2% (7) |
| State: | 6.9% (58,255) |
Number of families with income $150k - 200k:| Shandaken: | 2.2% (3) |
| State: | 8.3% (69,877) |
Number of families with income > $200k:| Shandaken: | 5.6% (8) |
| New York: | 9.3% (78,555) |
Median non-family income in Shandaken in 2022:| Shandaken: | $45,671 |
| New York: | $34,000 |
Change in median non-family income between 2000 and 2022:| Shandaken, New York: | +35.3% |
| State: | +93.9% |
Median per capita income in Shandaken in 2022:| Shandaken: | $55,524 |
| State: | $29,761 |
Change in median per capita income between 2000 and 2022:| Shandaken, New York: | +109.7% |
| State: | +132.7% |
Income statistics for Multirace residents
Median household income in Shandaken, NY in 2022:| Shandaken: | $31,414 |
| State: | $73,557 |
Change in median household income between 2000 and 2022:| Shandaken, New York: | +58.5% |
| State: | +123.9% |
Number of households with income < $10k:| Shandaken: | 8.9% (17,496) |
| State: | 8.9% (57,924) |
Number of households with income $10k - 20k:| Shandaken: | 8.7% (17,063) |
| New York: | 8.7% (56,590) |
Number of households with income $20k - 30k:| Shandaken: | 7.1% (13,947) |
| State: | 7.1% (46,287) |
Number of households with income $30k - 40k:| Shandaken: | 6.9% (13,585) |
| State: | 6.9% (45,132) |
Number of households with income $40k - 50k:| Shandaken: | 5.8% (11,400) |
| State: | 5.8% (37,946) |
Number of households with income $50k - 60k:| Shandaken: | 5.6% (10,953) |
| State: | 5.6% (36,410) |
Number of households with income $60k - 75k:| Shandaken: | 7.8% (15,279) |
| New York: | 7.8% (50,819) |
Number of households with income $75k - 100k:| Shandaken: | 11.7% (22,895) |
| State: | 11.7% (76,024) |
Number of households with income $100k - 125k:| Shandaken: | 9.3% (18,219) |
| State: | 9.3% (60,635) |
Number of households with income $125k - 150k:| Shandaken: | 6.2% (12,208) |
| New York: | 6.2% (40,533) |
Number of households with income $150k - 200k:| Shandaken: | 8.6% (16,981) |
| State: | 8.6% (56,409) |
Number of households with income > $200k:| Shandaken: | 13.4% (26,363) |
| State: | 13.4% (87,442) |
Aggregate household income in Shandaken in 2022: $12,450,799
Median family income in Shandaken in 2022:| Shandaken: | $145,340 |
| New York: | $85,788 |
Number of families with income $10k - 20k:| Shandaken: | 17.9% (14) |
| New York: | 5.6% (22,512) |
Number of families with income $50k - 60k:| Shandaken: | 55.7% (42) |
| New York: | 5.5% (22,002) |
Number of families with income $60k - 75k:| Shandaken: | 26.4% (20) |
| State: | 7.6% (30,653) |
Median non-family income in Shandaken in 2022:| Shandaken: | $14,094 |
| New York: | $46,403 |
Change in median non-family income between 2000 and 2022:| Shandaken, New York: | +125.5% |
| New York: | +113.6% |
Median per capita income in Shandaken in 2022:| Shandaken: | $39,157 |
| State: | $36,931 |
Change in median per capita income between 2000 and 2022:| Shandaken, New York: | +139.0% |
| New York: | +158.8% |
Income statistics for other residents
Number of households with income < $10k:| Shandaken: | 9.5% (2) |
| New York: | 10.3% (69,252) |
Number of households with income $10k - 20k:| Shandaken: | 9.5% (2) |
| State: | 11.0% (73,890) |
Number of households with income $20k - 30k:| Shandaken: | 9.5% (2) |
| State: | 8.8% (59,096) |
Number of households with income $30k - 40k:| Shandaken: | 9.5% (2) |
| State: | 8.1% (54,418) |
Number of households with income $40k - 50k:| Shandaken: | 9.5% (2) |
| State: | 7.3% (49,042) |
Number of households with income $50k - 60k:| Shandaken: | 4.8% (1) |
| New York: | 6.5% (43,945) |
Number of households with income $60k - 75k:| Shandaken: | 9.5% (2) |
| State: | 9.5% (64,087) |
Number of households with income $75k - 100k:| Shandaken: | 9.5% (2) |
| State: | 10.9% (73,094) |
Number of households with income $100k - 125k:| Shandaken: | 9.5% (2) |
| State: | 7.9% (53,055) |
Number of households with income $125k - 150k:| Shandaken: | 4.8% (1) |
| State: | 5.9% (39,446) |
Number of households with income $150k - 200k:| Shandaken: | 9.5% (2) |
| New York: | 7.2% (48,653) |
Number of households with income > $200k:| Shandaken: | 4.8% (1) |
| State: | 6.6% (44,703) |
Aggregate household income in Shandaken in 2022: $681,335
Median family income in Shandaken in 2022:| Shandaken: | $23,869 |
| State: | $63,465 |
Median non-family income in Shandaken in 2022:| Shandaken: | $11,080 |
| New York: | $26,983 |
Change in median non-family income between 2000 and 2022:| Shandaken, New York: | +77.3% |
| State: | +66.4% |
Median per capita income in Shandaken in 2022:| Shandaken: | $4,668 |
| New York: | $26,975 |
Change in median per capita income between 2000 and 2022:| Shandaken, New York: | +77.4% |
| State: | +144.6% |