Sidney, Kentucky (KY) income map, earnings map, and wages data
The median household income in Sidney, KY in 2022 was $37,858, which was 56.7% less than the median annual income of $59,341 across the entire state of Kentucky. Compared to the median income of $21,455 in 2000 this represents an increase of 43.3%. The per capita income in 2022 was $20,049, which means an increase of 47.0% compared to 2000 when it was $10,631.
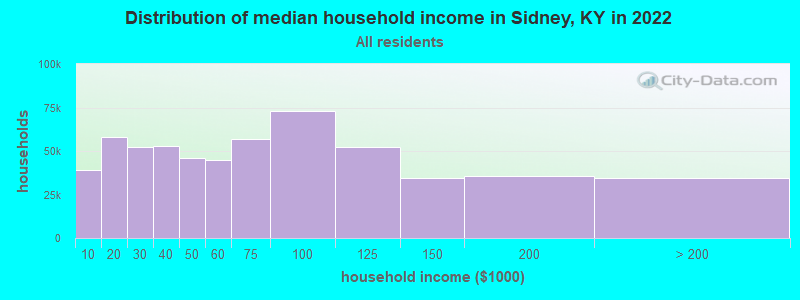
Income statistics for all residents
Median household income in Sidney, KY in 2022:| Sidney: | $37,859 |
| Kentucky: | $59,341 |
Change in median household income between 2000 and 2022:| Sidney, Kentucky: | +76.5% |
| State: | +76.2% |
Number of households with income < $10k:| Sidney: | 6.8% (39,231) |
| State: | 6.8% (123,697) |
Number of households with income $10k - 20k:| Sidney: | 10.0% (58,273) |
| State: | 10.0% (182,645) |
Number of households with income $20k - 30k:| Sidney: | 9.0% (52,138) |
| State: | 9.0% (164,092) |
Number of households with income $30k - 40k:| Sidney: | 9.1% (52,783) |
| State: | 9.1% (165,607) |
Number of households with income $40k - 50k:| Sidney: | 8.0% (46,223) |
| Kentucky: | 8.0% (146,315) |
Number of households with income $50k - 60k:| Sidney: | 7.7% (44,802) |
| State: | 7.7% (140,671) |
Number of households with income $60k - 75k:| Sidney: | 9.8% (56,945) |
| State: | 9.8% (180,002) |
Number of households with income $75k - 100k:| Sidney: | 12.6% (73,192) |
| Kentucky: | 12.6% (230,239) |
Number of households with income $100k - 125k:| Sidney: | 9.0% (52,264) |
| State: | 9.0% (164,398) |
Number of households with income $125k - 150k:| Sidney: | 5.9% (34,372) |
| Kentucky: | 5.9% (108,602) |
Number of households with income $150k - 200k:| Sidney: | 6.1% (35,608) |
| Kentucky: | 6.2% (112,813) |
Number of households with income > $200k:| Sidney: | 5.9% (34,370) |
| Kentucky: | 6.0% (109,599) |
Aggregate household income in Sidney in 2022: $1,081,368,884
Median family income in Sidney in 2022:| Sidney: | $45,849 |
| State: | $76,119 |
Median non-family income in Sidney in 2022:| Sidney: | $30,524 |
| State: | $33,993 |
Change in median non-family income between 2000 and 2022:| Sidney, Kentucky: | +80.5% |
| Kentucky: | +79.2% |
Median per capita income in Sidney in 2022:| Sidney: | $20,049 |
| State: | $33,980 |
Change in median per capita income between 2000 and 2022:| Sidney, Kentucky: | +88.6% |
| State: | +87.8% |
Income statistics for White residents
Median household income in Sidney, KY in 2022:| Sidney: | $37,899 |
| Kentucky: | $60,987 |
Change in median household income between 2000 and 2022:| Sidney, Kentucky: | +76.6% |
| State: | +76.2% |
Number of households with income < $10k:| Sidney: | 6.2% (30,268) |
| State: | 6.2% (96,690) |
Number of households with income $10k - 20k:| Sidney: | 9.8% (47,535) |
| State: | 9.7% (151,125) |
Number of households with income $20k - 30k:| Sidney: | 9.0% (43,628) |
| State: | 8.9% (139,532) |
Number of households with income $30k - 40k:| Sidney: | 9.1% (44,543) |
| State: | 9.1% (142,284) |
Number of households with income $40k - 50k:| Sidney: | 7.7% (37,535) |
| State: | 7.7% (121,151) |
Number of households with income $50k - 60k:| Sidney: | 7.7% (37,543) |
| State: | 7.7% (119,790) |
Number of households with income $60k - 75k:| Sidney: | 9.8% (47,801) |
| State: | 9.9% (154,174) |
Number of households with income $75k - 100k:| Sidney: | 12.8% (62,284) |
| Kentucky: | 12.8% (199,740) |
Number of households with income $100k - 125k:| Sidney: | 9.4% (45,538) |
| Kentucky: | 9.4% (146,284) |
Number of households with income $125k - 150k:| Sidney: | 6.0% (29,180) |
| State: | 6.0% (94,180) |
Number of households with income $150k - 200k:| Sidney: | 6.4% (31,064) |
| State: | 6.4% (100,702) |
Number of households with income > $200k:| Sidney: | 6.2% (30,064) |
| State: | 6.3% (98,502) |
Aggregate household income in Sidney in 2022: $941,811,858
Median family income in Sidney in 2022:| Sidney: | $46,494 |
| State: | $78,353 |
Number of families with income < $10k:| Sidney: | 17.7% (99) |
| State: | 3.7% (37,075) |
Number of families with income $10k - 20k:| Sidney: | 11.3% (63) |
| State: | 4.9% (49,864) |
Number of families with income $20k - 30k:| Sidney: | 10.3% (58) |
| State: | 6.4% (64,043) |
Number of families with income $30k - 40k:| Sidney: | 13.6% (76) |
| State: | 8.0% (81,080) |
Number of families with income $40k - 50k:| Sidney: | 9.9% (55) |
| State: | 6.9% (69,099) |
Number of families with income $50k - 60k:| Sidney: | 8.9% (50) |
| State: | 7.2% (72,955) |
Number of families with income $60k - 75k:| Sidney: | 5.9% (33) |
| State: | 10.4% (104,587) |
Number of families with income $75k - 100k:| Sidney: | 10.0% (56) |
| State: | 15.0% (151,545) |
Number of families with income $100k - 125k:| Sidney: | 8.1% (45) |
| State: | 11.9% (120,340) |
Number of families with income $125k - 150k:| Sidney: | 4.3% (24) |
| State: | 8.1% (81,620) |
Median non-family income in Sidney in 2022:| Sidney: | $30,382 |
| Kentucky: | $34,415 |
Change in median non-family income between 2000 and 2022:| Sidney, Kentucky: | +79.7% |
| State: | +78.3% |
Median per capita income in Sidney in 2022:| Sidney: | $20,295 |
| State: | $35,352 |
Change in median per capita income between 2000 and 2022:| Sidney, Kentucky: | +90.9% |
| State: | +90.2% |
Income statistics for Asian residents
Number of households with income < $10k:| Sidney: | 5.6% (506) |
| Kentucky: | 5.6% (1,233) |
Number of households with income $10k - 20k:| Sidney: | 9.0% (810) |
| Kentucky: | 9.0% (1,974) |
Number of households with income $20k - 30k:| Sidney: | 3.2% (287) |
| State: | 3.2% (700) |
Number of households with income $30k - 40k:| Sidney: | 5.4% (485) |
| Kentucky: | 5.4% (1,181) |
Number of households with income $40k - 50k:| Sidney: | 6.9% (623) |
| State: | 6.9% (1,517) |
Number of households with income $50k - 60k:| Sidney: | 9.9% (898) |
| State: | 9.9% (2,187) |
Number of households with income $60k - 75k:| Sidney: | 5.3% (482) |
| Kentucky: | 5.3% (1,173) |
Number of households with income $75k - 100k:| Sidney: | 15.3% (1,387) |
| Kentucky: | 15.3% (3,377) |
Number of households with income $100k - 125k:| Sidney: | 10.1% (917) |
| State: | 10.1% (2,234) |
Number of households with income $125k - 150k:| Sidney: | 8.8% (800) |
| Kentucky: | 8.9% (1,949) |
Number of households with income $150k - 200k:| Sidney: | 6.6% (601) |
| Kentucky: | 6.6% (1,463) |
Number of households with income > $200k:| Sidney: | 13.8% (1,244) |
| State: | 13.8% (3,028) |
Median per capita income in Sidney in 2022:| Sidney: | $16,790 |
| Kentucky: | $42,939 |
Change in median per capita income between 2000 and 2022:| Sidney, Kentucky: | +67.9% |
| State: | +76.3% |
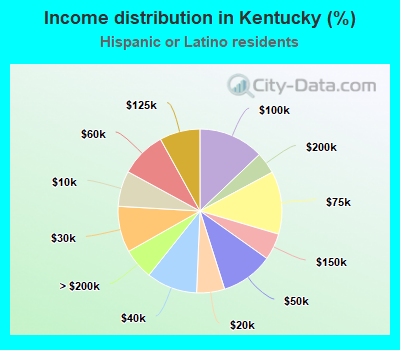
Income statistics for Hispanic or Latino residents
Median household income in Sidney, KY in 2022:| Sidney: | $78,965 |
| Kentucky: | $57,971 |
Change in median household income between 2000 and 2022:| Sidney, Kentucky: | +117.8% |
| Kentucky: | +96.2% |
Number of households with income < $10k:| Sidney: | 7.0% (2,191) |
| Kentucky: | 7.0% (3,568) |
Number of households with income $10k - 20k:| Sidney: | 5.5% (1,714) |
| State: | 5.5% (2,811) |
Number of households with income $20k - 30k:| Sidney: | 9.1% (2,829) |
| State: | 9.1% (4,637) |
Number of households with income $30k - 40k:| Sidney: | 10.1% (3,137) |
| Kentucky: | 10.0% (5,109) |
Number of households with income $40k - 50k:| Sidney: | 10.3% (3,197) |
| Kentucky: | 10.3% (5,241) |
Number of households with income $50k - 60k:| Sidney: | 9.0% (2,807) |
| Kentucky: | 9.1% (4,609) |
Number of households with income $60k - 75k:| Sidney: | 12.4% (3,850) |
| State: | 12.4% (6,299) |
Number of households with income $75k - 100k:| Sidney: | 13.0% (4,050) |
| Kentucky: | 12.9% (6,562) |
Number of households with income $100k - 125k:| Sidney: | 8.0% (2,495) |
| State: | 8.0% (4,066) |
Number of households with income $125k - 150k:| Sidney: | 5.3% (1,652) |
| Kentucky: | 5.3% (2,685) |
Number of households with income $150k - 200k:| Sidney: | 4.3% (1,331) |
| State: | 4.3% (2,173) |
Number of households with income > $200k:| Sidney: | 6.1% (1,890) |
| State: | 6.1% (3,099) |
Aggregate household income in Sidney in 2022: $1,412,019
Median family income in Sidney in 2022:| Sidney: | $73,743 |
| State: | $58,603 |
Number of families with income < $10k:| Sidney: | 22.7% (6) |
| State: | 5.3% (1,907) |
Number of families with income $10k - 20k:| Sidney: | 15.4% (4) |
| State: | 6.4% (2,298) |
Number of families with income $20k - 30k:| Sidney: | 12.6% (3) |
| Kentucky: | 9.4% (3,414) |
Number of families with income $30k - 40k:| Sidney: | 14.1% (4) |
| State: | 11.1% (4,022) |
Number of families with income $40k - 50k:| Sidney: | 12.6% (3) |
| State: | 11.2% (4,054) |
Number of families with income $50k - 60k:| Sidney: | 6.5% (2) |
| Kentucky: | 7.2% (2,594) |
Number of families with income $60k - 75k:| Sidney: | 4.1% (1) |
| Kentucky: | 10.1% (3,652) |
Number of families with income $75k - 100k:| Sidney: | 6.2% (2) |
| State: | 13.4% (4,856) |
Number of families with income $100k - 125k:| Sidney: | 3.6% (1) |
| Kentucky: | 8.0% (2,906) |
Number of families with income $125k - 150k:| Sidney: | 2.2% (1) |
| State: | 6.1% (2,200) |
Median per capita income in Sidney in 2022:| Sidney: | $26,846 |
| Kentucky: | $24,650 |
Change in median per capita income between 2000 and 2022:| Sidney, Kentucky: | +106.9% |
| State: | +106.1% |