Silex, Missouri (MO) income map, earnings map, and wages data

Data:
The per capita income in 2022 was $17,105, which means an increase of 26.8% compared to 2000 when it was $12,529.
Whole page based on the data from 2000 / 2022 when the population of Silex, Missouri was 206 / 315
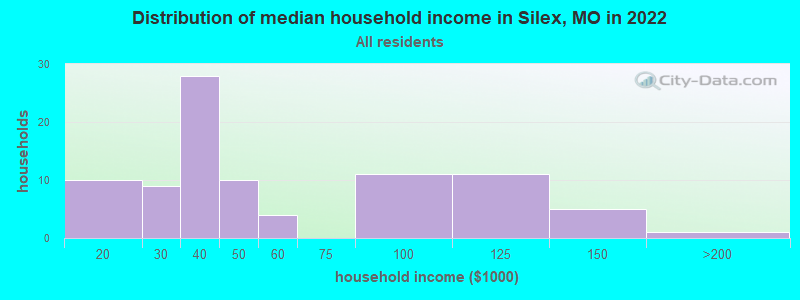
Income statistics for all residents
Number of households with income < $10k:| Silex: | 0.0% (0) |
| Missouri: | 5.7% (144,208) |
Number of households with income $10k - 20k:| Silex: | 11.2% (10) |
| State: | 8.2% (205,541) |
Number of households with income $20k - 30k:| Silex: | 10.1% (9) |
| State: | 7.8% (197,162) |
Number of households with income $30k - 40k:| Silex: | 31.5% (28) |
| State: | 8.7% (220,088) |
Number of households with income $40k - 50k:| Silex: | 11.2% (10) |
| State: | 8.2% (206,651) |
Number of households with income $50k - 60k:| Silex: | 4.5% (4) |
| Missouri: | 7.8% (196,521) |
Number of households with income $60k - 75k:| Silex: | 0.0% (0) |
| Missouri: | 10.1% (255,043) |
Number of households with income $75k - 100k:| Silex: | 12.4% (11) |
| Missouri: | 13.4% (337,210) |
Number of households with income $100k - 125k:| Silex: | 12.4% (11) |
| Missouri: | 9.8% (247,187) |
Number of households with income $125k - 150k:| Silex: | 5.6% (5) |
| Missouri: | 6.4% (160,260) |
Number of households with income $150k - 200k:| Silex: | 1.1% (1) |
| Missouri: | 6.9% (174,947) |
Number of households with income > $200k:| Silex: | 0.0% (0) |
| State: | 7.0% (177,014) |
Aggregate household income in Silex in 2022: $4,856,086
Median non-family income in Silex in 2022:| Silex: | $33,684 |
| State: | $38,435 |
Change in median non-family income between 2000 and 2022:| Silex, Missouri: | +102.8% |
| State: | +72.4% |
Median per capita income in Silex in 2022:| Silex: | $17,106 |
| State: | $36,640 |
Change in median per capita income between 2000 and 2022:| Silex, Missouri: | +36.5% |
| State: | +83.8% |
Income statistics for White residents
Number of households with income < $10k:| Silex: | 0.0% (0) |
| Missouri: | 4.9% (98,067) |
Number of households with income $10k - 20k:| Silex: | 12.7% (10) |
| State: | 7.3% (146,436) |
Number of households with income $20k - 30k:| Silex: | 11.4% (9) |
| State: | 7.6% (153,201) |
Number of households with income $30k - 40k:| Silex: | 35.4% (28) |
| State: | 8.4% (169,042) |
Number of households with income $40k - 50k:| Silex: | 0.0% (0) |
| State: | 8.0% (160,724) |
Number of households with income $50k - 60k:| Silex: | 5.1% (4) |
| State: | 7.7% (155,924) |
Number of households with income $60k - 75k:| Silex: | 0.0% (0) |
| State: | 10.2% (205,080) |
Number of households with income $75k - 100k:| Silex: | 13.9% (11) |
| State: | 14.1% (283,507) |
Number of households with income $100k - 125k:| Silex: | 13.9% (11) |
| State: | 10.2% (205,898) |
Number of households with income $125k - 150k:| Silex: | 6.3% (5) |
| Missouri: | 6.7% (135,287) |
Number of households with income $150k - 200k:| Silex: | 1.3% (1) |
| State: | 7.4% (148,450) |
Number of households with income > $200k:| Silex: | 0.0% (0) |
| State: | 7.6% (153,213) |
Aggregate household income in Silex in 2022: $4,391,599
Median family income in Silex in 2022:| Silex: | $77,290 |
| Missouri: | $87,438 |
Number of families with income $10k - 20k:| Silex: | 17.7% (9) |
| State: | 3.3% (41,944) |
Number of families with income $20k - 30k:| Silex: | 17.7% (9) |
| State: | 5.0% (63,337) |
Number of families with income $30k - 40k:| Silex: | 1.9% (1) |
| State: | 6.2% (78,970) |
Number of families with income $50k - 60k:| Silex: | 7.7% (4) |
| Missouri: | 7.3% (92,637) |
Number of families with income $75k - 100k:| Silex: | 21.8% (11) |
| State: | 16.2% (206,529) |
Number of families with income $100k - 125k:| Silex: | 21.8% (11) |
| State: | 12.9% (164,015) |
Number of families with income $125k - 150k:| Silex: | 9.4% (5) |
| State: | 8.9% (113,643) |
Number of families with income $150k - 200k:| Silex: | 1.9% (1) |
| Missouri: | 10.1% (129,106) |
Median non-family income in Silex in 2022:| Silex: | $33,662 |
| State: | $40,207 |
Change in median non-family income between 2000 and 2022:| Silex, Missouri: | +102.7% |
| Missouri: | +75.5% |
Median per capita income in Silex in 2022:| Silex: | $17,331 |
| State: | $39,160 |
Change in median per capita income between 2000 and 2022:| Silex, Missouri: | +32.5% |
| Missouri: | +86.9% |
Income statistics for Multirace residents
Number of households with income < $10k:| Silex: | 0.0% (0) |
| Missouri: | 7.6% (10,901) |
Number of households with income $10k - 20k:| Silex: | 0.0% (0) |
| State: | 8.7% (12,480) |
Number of households with income $20k - 30k:| Silex: | 0.0% (0) |
| State: | 8.5% (12,233) |
Number of households with income $30k - 40k:| Silex: | 0.0% (0) |
| State: | 9.1% (13,060) |
Number of households with income $40k - 50k:| Silex: | 100.0% (16) |
| State: | 9.4% (13,506) |
Number of households with income $50k - 60k:| Silex: | 0.0% (0) |
| State: | 7.6% (11,002) |
Number of households with income $60k - 75k:| Silex: | 0.0% (0) |
| State: | 9.7% (13,948) |
Number of households with income $75k - 100k:| Silex: | 0.0% (0) |
| State: | 12.3% (17,702) |
Number of households with income $100k - 125k:| Silex: | 0.0% (0) |
| Missouri: | 10.1% (14,590) |
Number of households with income $125k - 150k:| Silex: | 0.0% (0) |
| State: | 6.1% (8,758) |
Number of households with income $150k - 200k:| Silex: | 0.0% (0) |
| Missouri: | 5.9% (8,516) |
Number of households with income > $200k:| Silex: | 0.0% (0) |
| Missouri: | 5.2% (7,429) |
Aggregate household income in Silex in 2022: $203,685
Median per capita income in Silex in 2022:| Silex: | $11,737 |
| State: | $25,564 |
Change in median per capita income between 2000 and 2022:| Silex, Missouri: | +107.7% |
| State: | +108.9% |