The median household income in Silverton, OR in 2022 was $75,268, which was about the same as the median annual income of $75,657 across the entire state of Oregon. Compared to the median income of $38,429 in 2000 this represents an increase of 48.9%. The per capita income in 2022 was $34,620, which means an increase of 47.8% compared to 2000 when it was $18,062.
Whole page based on the data from 2000 / 2022 when the population of Silverton, Oregon was 7,414 / 10,466
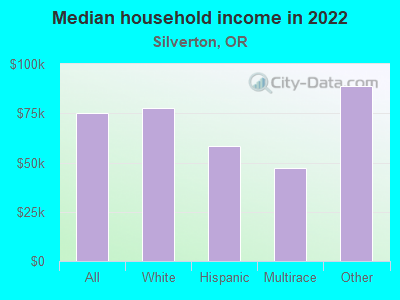
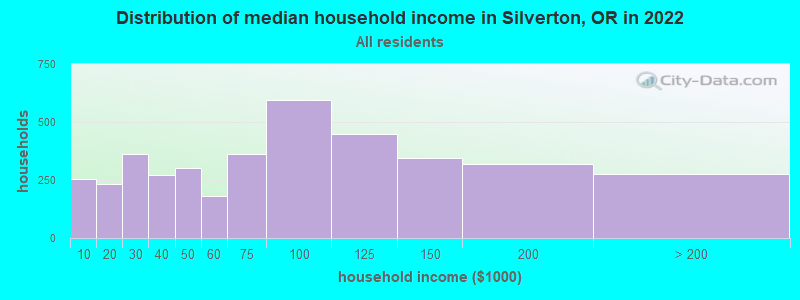
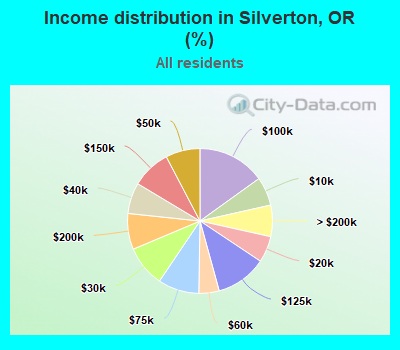
Income statistics for all residents
Median household income in Silverton, OR in 2022:
Silverton:
$75,269
State:
$75,657
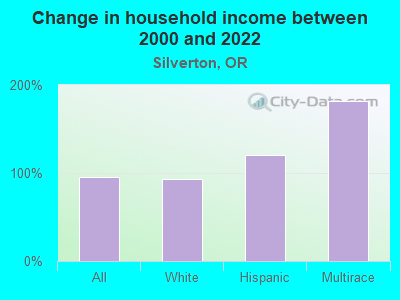
Change in median household income between 2000 and 2022:
Silverton, Oregon:
+95.9%
Oregon:
+84.9%
Number of households with income < $10k:
Silverton:
6.4% (253)
Oregon:
5.1% (87,297)
Number of households with income $10k - 20k:
Silverton:
5.9% (232)
State:
6.7% (115,299)
Number of households with income $20k - 30k:
Silverton:
9.2% (363)
State:
6.9% (119,114)
Number of households with income $30k - 40k:
Silverton:
6.9% (273)
Oregon:
7.1% (122,333)
Number of households with income $40k - 50k:
Silverton:
7.7% (303)
State:
7.2% (124,562)
Number of households with income $50k - 60k:
Silverton:
4.5% (179)
Oregon:
6.9% (118,435)
Number of households with income $60k - 75k:
Silverton:
9.2% (362)
State:
9.8% (168,926)
Number of households with income $75k - 100k:
Silverton:
15.1% (595)
State:
13.3% (229,104)
Number of households with income $100k - 125k:
Silverton:
11.4% (449)
State:
10.5% (181,787)
Number of households with income $125k - 150k:
Silverton:
8.7% (344)
State:
7.4% (127,392)
Number of households with income $150k - 200k:
Silverton:
8.0% (317)
Oregon:
8.6% (148,614)
Number of households with income > $200k:
Silverton:
7.0% (276)
Oregon:
10.6% (183,477)
Aggregate household income in Silverton in 2022: $353,202,830
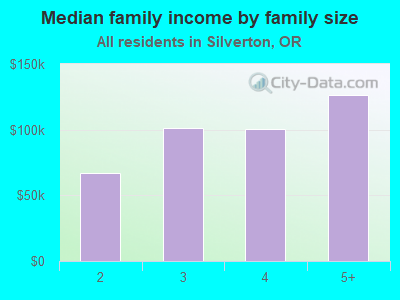
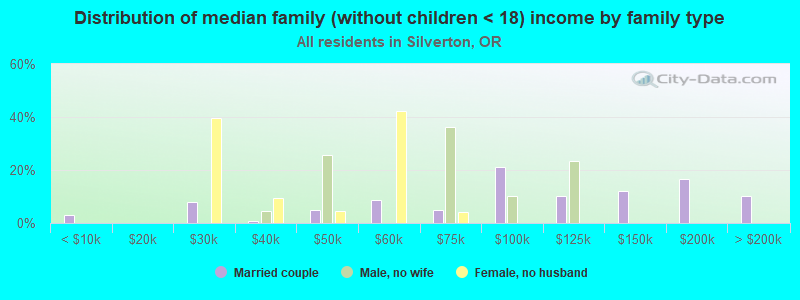
Median family income in Silverton in 2022:
Silverton:
$91,701
State:
$93,384
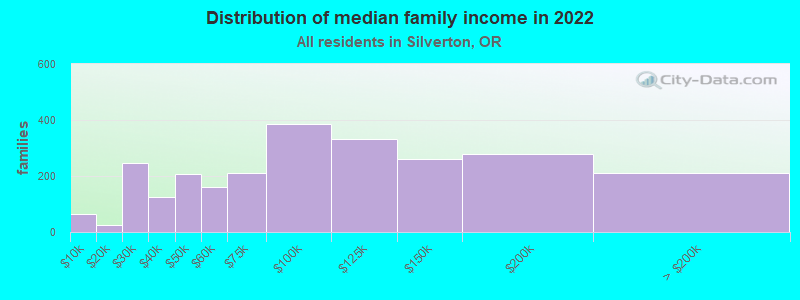
Number of families with income < $10k:
Silverton:
2.6% (66)
Oregon:
3.1% (32,019)
Number of families with income $10k - 20k:
Silverton:
1.0% (24)
State:
3.0% (31,605)
Number of families with income $20k - 30k:
Silverton:
9.9% (248)
State:
4.5% (47,306)
Number of families with income $30k - 40k:
Silverton:
5.0% (126)
State:
5.8% (60,772)
Number of families with income $40k - 50k:
Silverton:
8.2% (206)
Oregon:
6.4% (66,435)
Number of families with income $50k - 60k:
Silverton:
6.5% (162)
State:
6.1% (63,915)
Number of families with income $60k - 75k:
Silverton:
8.3% (209)
Oregon:
9.9% (102,697)
Number of families with income $75k - 100k:
Silverton:
15.4% (387)
State:
14.3% (148,745)
Number of families with income $100k - 125k:
Silverton:
13.3% (332)
Oregon:
12.4% (129,023)
Number of families with income $125k - 150k:
Silverton:
10.4% (260)
Oregon:
8.8% (91,808)
Number of families with income $150k - 200k:
Silverton:
11.1% (278)
State:
11.3% (117,224)
Number of families with income > $200k:
Silverton:
8.3% (209)
State:
14.4% (149,534)
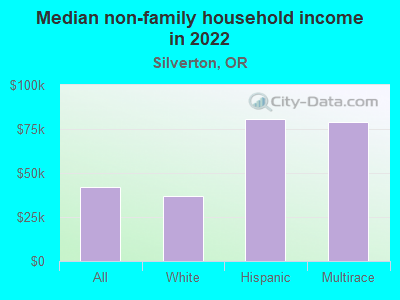
Median non-family income in Silverton in 2022:
Silverton:
$42,015
State:
$48,114
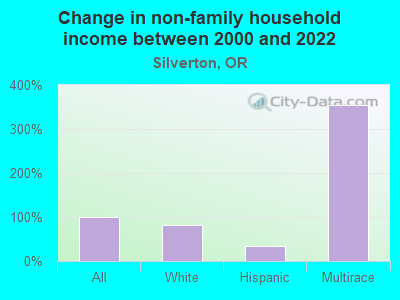
Change in median non-family income between 2000 and 2022:
Silverton, Oregon:
+99.3%
Oregon:
+86.8%
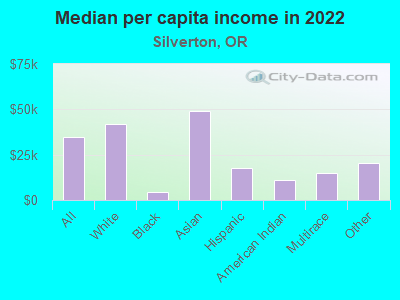
Median per capita income in Silverton in 2022:
Silverton:
$34,620
State:
$42,474
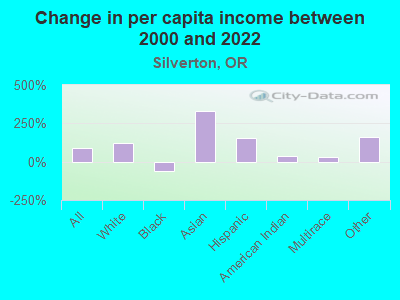
Change in median per capita income between 2000 and 2022:
Silverton, Oregon:
+91.7%
Oregon:
+102.8%
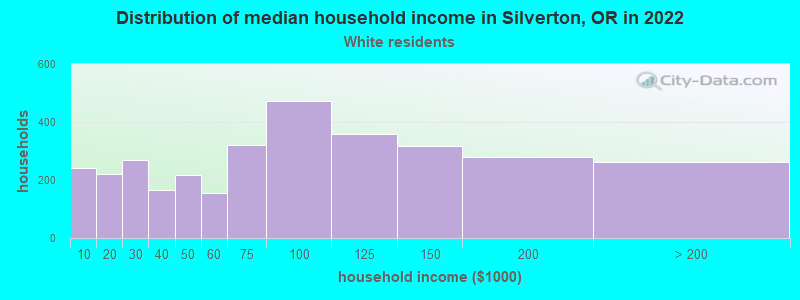
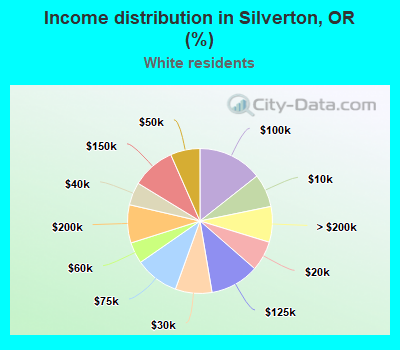
Income statistics for White residents
Median household income in Silverton, OR in 2022:
Silverton:
$77,516
State:
$76,846
Change in median household income between 2000 and 2022:
Silverton, Oregon:
+93.4%
Oregon:
+84.8%
Number of households with income < $10k:
Silverton:
7.4% (243)
State:
4.9% (67,757)
Number of households with income $10k - 20k:
Silverton:
6.7% (219)
Oregon:
6.6% (91,229)
Number of households with income $20k - 30k:
Silverton:
8.2% (268)
Oregon:
6.8% (93,981)
Number of households with income $30k - 40k:
Silverton:
5.1% (167)
State:
6.9% (95,328)
Number of households with income $40k - 50k:
Silverton:
6.6% (216)
State:
7.2% (100,221)
Number of households with income $50k - 60k:
Silverton:
4.8% (156)
State:
6.9% (95,294)
Number of households with income $60k - 75k:
Silverton:
9.8% (322)
State:
9.5% (132,178)
Number of households with income $75k - 100k:
Silverton:
14.4% (471)
Oregon:
13.5% (187,105)
Number of households with income $100k - 125k:
Silverton:
10.9% (358)
State:
10.5% (145,264)
Number of households with income $125k - 150k:
Silverton:
9.7% (318)
State:
7.3% (101,755)
Number of households with income $150k - 200k:
Silverton:
8.5% (279)
Oregon:
8.7% (121,099)
Number of households with income > $200k:
Silverton:
8.0% (261)
State:
11.1% (153,992)
Aggregate household income in Silverton in 2022: $309,220,685
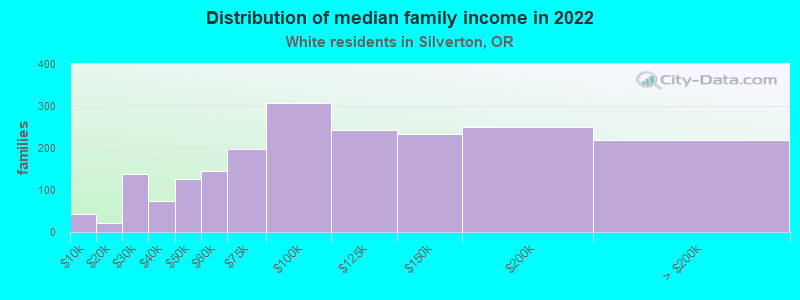
Median family income in Silverton in 2022:
Silverton:
$95,008
Oregon:
$95,912
Number of families with income < $10k:
Silverton:
2.2% (43)
Oregon:
2.8% (23,325)
Number of families with income $10k - 20k:
Silverton:
1.1% (21)
State:
2.8% (23,464)
Number of families with income $20k - 30k:
Silverton:
6.9% (139)
State:
4.1% (33,830)
Number of families with income $30k - 40k:
Silverton:
3.7% (75)
State:
5.6% (46,508)
Number of families with income $40k - 50k:
Silverton:
6.4% (127)
State:
6.4% (53,001)
Number of families with income $50k - 60k:
Silverton:
7.3% (145)
State:
6.0% (49,589)
Number of families with income $60k - 75k:
Silverton:
9.9% (198)
State:
9.4% (77,838)
Number of families with income $75k - 100k:
Silverton:
15.3% (307)
State:
14.7% (121,106)
Number of families with income $100k - 125k:
Silverton:
12.1% (242)
Oregon:
12.3% (101,829)
Number of families with income $125k - 150k:
Silverton:
11.7% (234)
Oregon:
8.9% (73,376)
Number of families with income $150k - 200k:
Silverton:
12.5% (249)
State:
11.7% (96,629)
Number of families with income > $200k:
Silverton:
11.0% (220)
State:
15.2% (125,084)
Median non-family income in Silverton in 2022:
Silverton:
$36,990
State:
$48,924
Change in median non-family income between 2000 and 2022:
Silverton, Oregon:
+81.4%
State:
+88.0%
Median per capita income in Silverton in 2022:
Silverton:
$41,878
Oregon:
$45,669
Change in median per capita income between 2000 and 2022:
Silverton, Oregon:
+121.0%
State:
+106.5%
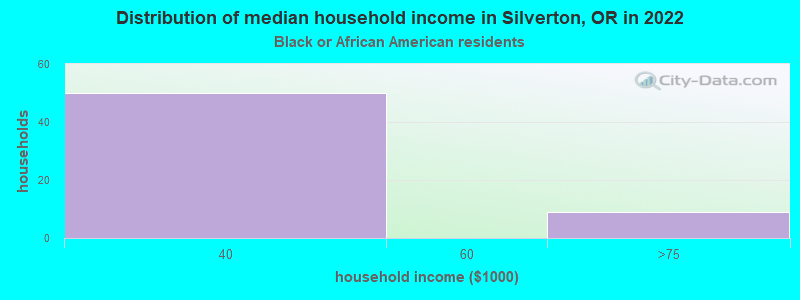
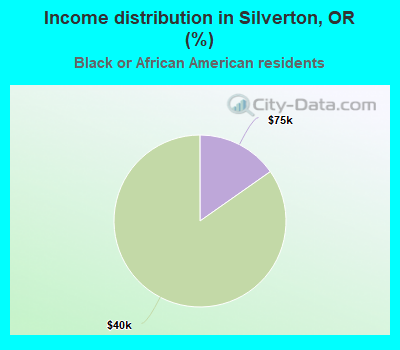
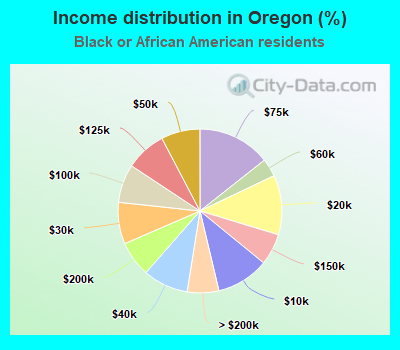
Income statistics for Black or African American residents
Number of households with income < $10k:
Silverton:
0.0% (0)
Oregon:
10.4% (3,127)
Number of households with income $10k - 20k:
Silverton:
0.0% (0)
Oregon:
11.8% (3,543)
Number of households with income $20k - 30k:
Silverton:
0.0% (0)
State:
8.2% (2,475)
Number of households with income $30k - 40k:
Silverton:
84.7% (50)
Oregon:
8.9% (2,690)
Number of households with income $40k - 50k:
Silverton:
0.0% (0)
Oregon:
7.7% (2,311)
Number of households with income $50k - 60k:
Silverton:
0.0% (0)
Oregon:
3.6% (1,070)
Number of households with income $60k - 75k:
Silverton:
15.3% (9)
State:
14.4% (4,327)
Number of households with income $75k - 100k:
Silverton:
0.0% (0)
State:
7.6% (2,284)
Number of households with income $100k - 125k:
Silverton:
0.0% (0)
State:
8.0% (2,415)
Number of households with income $125k - 150k:
Silverton:
0.0% (0)
Oregon:
6.2% (1,868)
Number of households with income $150k - 200k:
Silverton:
0.0% (0)
State:
7.0% (2,114)
Number of households with income > $200k:
Silverton:
0.0% (0)
Oregon:
6.2% (1,878)
Median per capita income in Silverton in 2022:
Silverton:
$4,481
State:
$34,050
Change in median per capita income between 2000 and 2022:: -59.3%
Silverton, Oregon:
-59.3%
State:
+128.9%
Income statistics for Asian residents
Median per capita income in Silverton in 2022:
Silverton:
$49,015
State:
$52,607
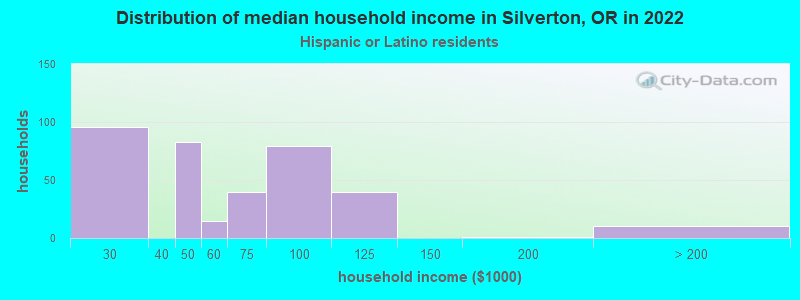
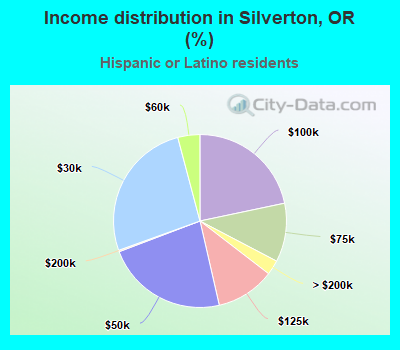
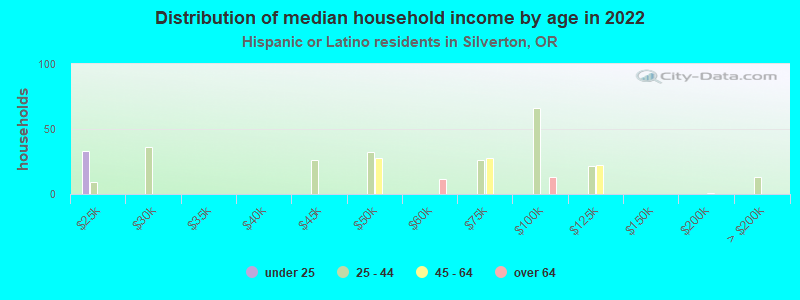
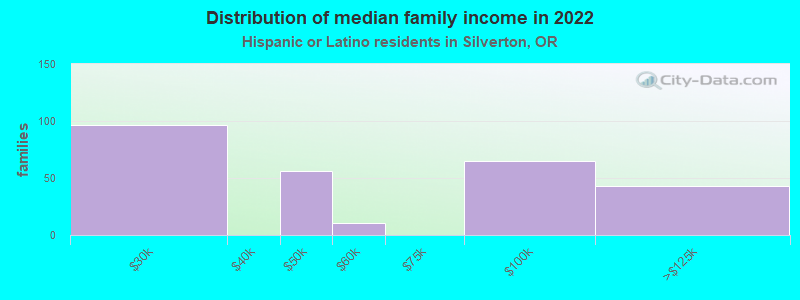
Income statistics for Hispanic or Latino residents
Median household income in Silverton, OR in 2022:
Silverton:
$58,298
State:
$65,081
Change in median household income between 2000 and 2022:
Silverton, Oregon:
+120.6%
Oregon:
+103.9%
Number of households with income < $10k:
Silverton:
0.0% (0)
State:
5.0% (8,626)
Number of households with income $10k - 20k:
Silverton:
0.0% (0)
State:
5.4% (9,284)
Number of households with income $20k - 30k:
Silverton:
26.4% (96)
State:
8.2% (14,265)
Number of households with income $30k - 40k:
Silverton:
0.0% (0)
State:
9.9% (17,228)
Number of households with income $40k - 50k:
Silverton:
22.8% (83)
State:
9.2% (16,040)
Number of households with income $50k - 60k:
Silverton:
4.1% (15)
State:
7.8% (13,499)
Number of households with income $60k - 75k:
Silverton:
11.0% (40)
State:
12.6% (21,845)
Number of households with income $75k - 100k:
Silverton:
21.7% (79)
Oregon:
13.6% (23,566)
Number of households with income $100k - 125k:
Silverton:
11.0% (40)
Oregon:
10.2% (17,704)
Number of households with income $125k - 150k:
Silverton:
0.0% (0)
State:
5.9% (10,188)
Number of households with income $150k - 200k:
Silverton:
0.3% (1)
Oregon:
7.1% (12,405)
Number of households with income > $200k:
Silverton:
2.7% (10)
State:
5.1% (8,851)
Aggregate household income in Silverton in 2022: $20,684,255
Median family income in Silverton in 2022:
Silverton:
$50,366
State:
$70,541
Number of families with income $20k - 30k:
Silverton:
35.6% (96)
State:
7.8% (9,379)
Number of families with income $40k - 50k:
Silverton:
20.7% (56)
State:
8.9% (10,692)
Number of families with income $50k - 60k:
Silverton:
4.0% (11)
State:
7.0% (8,368)
Number of families with income $75k - 100k:
Silverton:
24.0% (65)
State:
14.6% (17,572)
Number of families with income $100k - 125k:
Silverton:
15.4% (42)
State:
12.0% (14,418)
Number of families with income $150k - 200k:
Silverton:
0.3% (1)
Oregon:
8.1% (9,776)
Median non-family income in Silverton in 2022:
Silverton:
$80,644
State:
$44,007
Change in median non-family income between 2000 and 2022:
Silverton, Oregon:
+33.6%
Oregon:
+83.5%
Median per capita income in Silverton in 2022:
Silverton:
$17,582
State:
$25,274
Income statistics for American Indian and Alaska Native residents
Number of households with income < $10k:
Silverton:
0.0% (0)
State:
11.0% (1,885)
Number of households with income $10k - 20k:
Silverton:
0.0% (0)
Oregon:
6.6% (1,129)
Number of households with income $20k - 30k:
Silverton:
0.0% (0)
State:
7.9% (1,360)
Number of households with income $30k - 40k:
Silverton:
0.0% (0)
Oregon:
8.6% (1,471)
Number of households with income $40k - 50k:
Silverton:
0.0% (0)
Oregon:
12.1% (2,084)
Number of households with income $50k - 60k:
Silverton:
0.0% (0)
State:
5.0% (853)
Number of households with income $60k - 75k:
Silverton:
0.0% (0)
State:
10.1% (1,730)
Number of households with income $75k - 100k:
Silverton:
0.0% (0)
State:
9.8% (1,679)
Number of households with income $100k - 125k:
Silverton:
100.0% (48)
State:
17.6% (3,026)
Number of households with income $125k - 150k:
Silverton:
0.0% (0)
Oregon:
5.8% (1,002)
Number of households with income $150k - 200k:
Silverton:
0.0% (0)
Oregon:
1.5% (264)
Number of households with income > $200k:
Silverton:
0.0% (0)
State:
4.0% (681)
Aggregate household income in Silverton in 2022: $1,304,548
Median per capita income in Silverton in 2022:
Silverton:
$10,959
State:
$28,382
Change in median per capita income between 2000 and 2022:
Silverton, Oregon:
+35.3%
State:
+111.1%
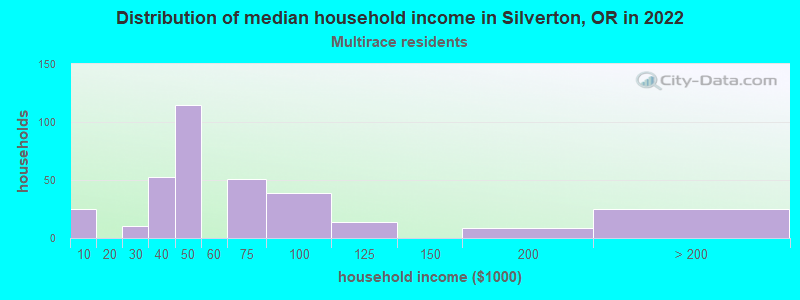
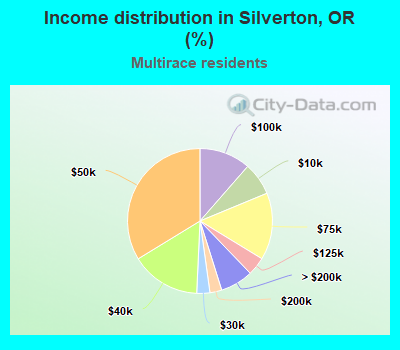
Income statistics for Multirace residents
Median household income in Silverton, OR in 2022:
Silverton:
$47,329
State:
$68,947
Number of households with income < $10k:
Silverton:
7.3% (25)
State:
4.7% (7,092)
Number of households with income $10k - 20k:
Silverton:
0.0% (0)
State:
7.7% (11,619)
Number of households with income $20k - 30k:
Silverton:
2.9% (10)
State:
7.4% (11,055)
Number of households with income $30k - 40k:
Silverton:
15.5% (53)
State:
8.2% (12,256)
Number of households with income $40k - 50k:
Silverton:
33.7% (115)
State:
7.6% (11,440)
Number of households with income $50k - 60k:
Silverton:
0.0% (0)
State:
7.9% (11,878)
Number of households with income $60k - 75k:
Silverton:
15.0% (51)
State:
10.8% (16,149)
Number of households with income $75k - 100k:
Silverton:
11.4% (39)
Oregon:
13.7% (20,620)
Number of households with income $100k - 125k:
Silverton:
4.1% (14)
Oregon:
9.7% (14,562)
Number of households with income $125k - 150k:
Silverton:
0.0% (0)
Oregon:
6.6% (9,976)
Number of households with income $150k - 200k:
Silverton:
2.6% (9)
State:
8.8% (13,229)
Number of households with income > $200k:
Silverton:
7.3% (25)
Oregon:
6.8% (10,234)
Aggregate household income in Silverton in 2022: $22,280,748
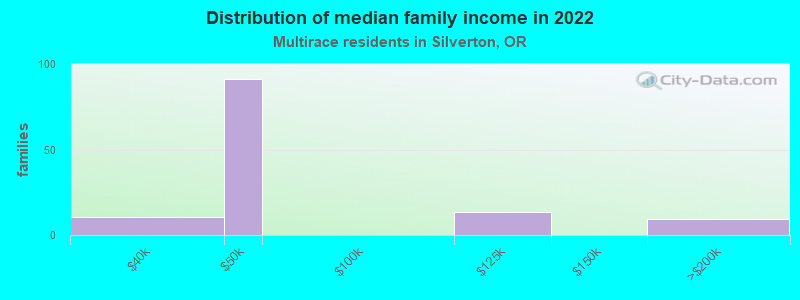
Median family income in Silverton in 2022:
Silverton:
$48,377
State:
$81,783
Number of families with income $30k - 40k:
Silverton:
8.4% (10)
State:
6.4% (5,825)
Number of families with income $40k - 50k:
Silverton:
73.2% (91)
State:
7.4% (6,757)
Number of families with income $100k - 125k:
Silverton:
10.9% (14)
State:
12.1% (11,019)
Number of families with income $150k - 200k:
Silverton:
7.5% (9)
Oregon:
11.0% (10,010)
Median non-family income in Silverton in 2022:
Silverton:
$78,866
State:
$45,215
Median per capita income in Silverton in 2022:
Silverton:
$15,020
State:
$29,750
Change in median per capita income between 2000 and 2022:
Silverton, Oregon:
+31.0%
State:
+148.0%
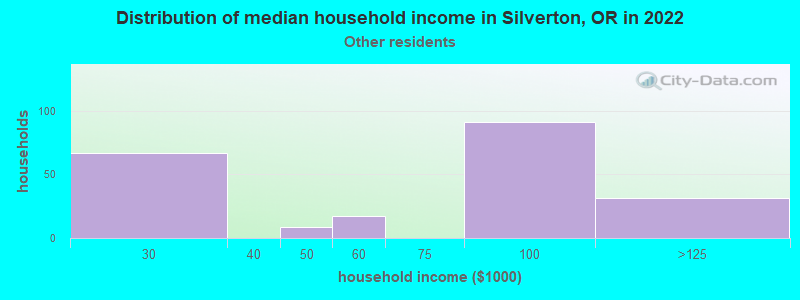
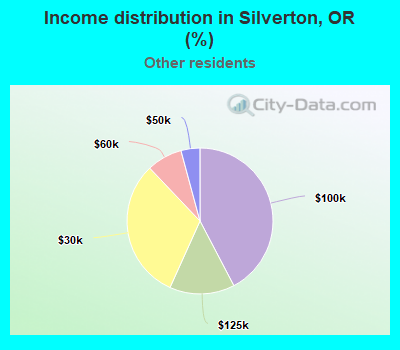
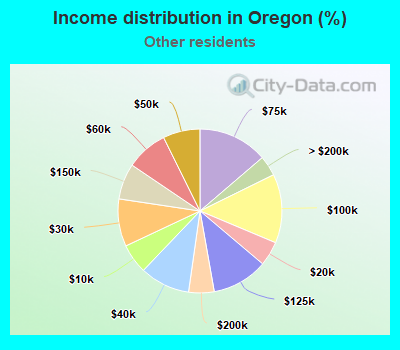
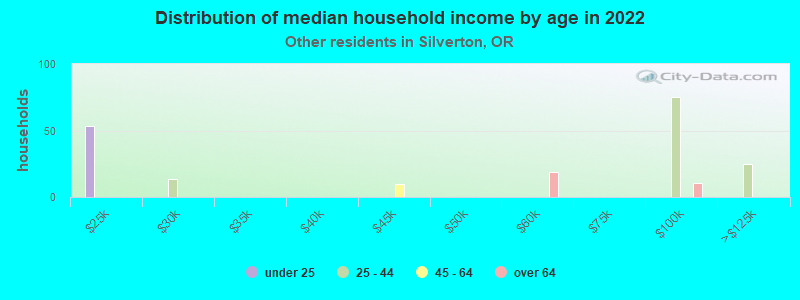
Income statistics for other residents
Median household income in Silverton, OR in 2022:
Silverton:
$88,711
State:
$65,148
Number of households with income < $10k:
Silverton:
0.0% (0)
State:
5.9% (3,904)
Number of households with income $10k - 20k:
Silverton:
0.0% (0)
Oregon:
4.8% (3,221)
Number of households with income $20k - 30k:
Silverton:
31.2% (67)
Oregon:
9.4% (6,245)
Number of households with income $30k - 40k:
Silverton:
0.0% (0)
State:
9.9% (6,579)
Number of households with income $40k - 50k:
Silverton:
4.2% (9)
Oregon:
7.3% (4,871)
Number of households with income $50k - 60k:
Silverton:
7.9% (17)
State:
8.2% (5,473)
Number of households with income $60k - 75k:
Silverton:
0.0% (0)
State:
13.7% (9,138)
Number of households with income $75k - 100k:
Silverton:
42.3% (91)
Oregon:
13.6% (9,057)
Number of households with income $100k - 125k:
Silverton:
14.4% (31)
State:
11.0% (7,344)
Number of households with income $125k - 150k:
Silverton:
0.0% (0)
State:
7.1% (4,713)
Number of households with income $150k - 200k:
Silverton:
0.0% (0)
State:
5.0% (3,350)
Number of households with income > $200k:
Silverton:
0.0% (0)
State:
4.0% (2,665)
Aggregate household income in Silverton in 2022: $9,675,499
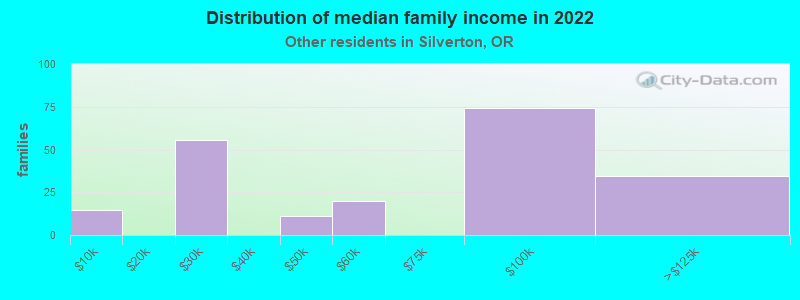
Median family income in Silverton in 2022:
Silverton:
$82,481
State:
$67,149
Number of families with income < $10k:
Silverton:
6.8% (14)
State:
5.9% (2,875)
Number of families with income $20k - 30k:
Silverton:
26.6% (56)
State:
10.1% (4,922)
Number of families with income $40k - 50k:
Silverton:
5.2% (11)
State:
7.4% (3,579)
Number of families with income $50k - 60k:
Silverton:
9.5% (20)
State:
7.1% (3,464)
Number of families with income $75k - 100k:
Silverton:
35.3% (74)
State:
13.3% (6,454)
Number of families with income $100k - 125k:
Silverton:
16.6% (35)
State:
12.7% (6,166)
Median per capita income in Silverton in 2022:
Silverton:
$20,136
Oregon:
$25,226
Discuss Silverton, Oregon (OR) on our hugely popular Oregon forum.