The median household income in Skyland, NV in 2022 was $83,565, which was 13.4% greater than the median annual income of $72,333 across the entire state of Nevada. Compared to the median income of $51,849 in 2000 this represents an increase of 38.0%. The per capita income in 2022 was $67,503, which means an increase of 59.6% compared to 2000 when it was $27,288.
Whole page based on the data from 2000 / 2022 when the population of Skyland, Nevada was 376 / 405
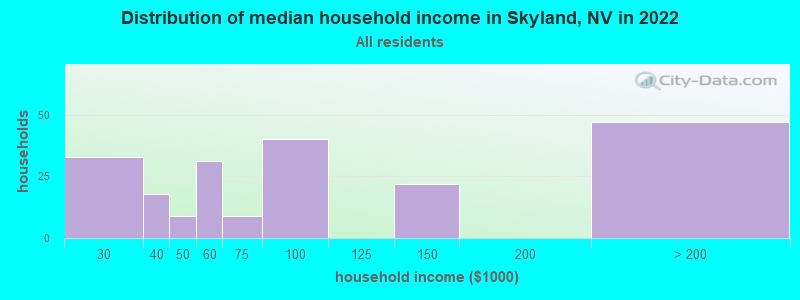
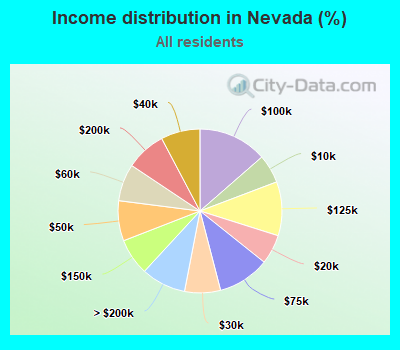
Income statistics for all residents
Median household income in Skyland, NV in 2022:
Skyland:
$83,566
State:
$72,333
Change in median household income between 2000 and 2022:
Skyland, Nevada:
+61.2%
State:
+62.3%
Number of households with income < $10k:
Skyland:
0.0% (0)
State:
5.6% (67,608)
Number of households with income $10k - 20k:
Skyland:
0.0% (0)
State:
5.8% (69,869)
Number of households with income $20k - 30k:
Skyland:
15.8% (33)
State:
7.1% (84,856)
Number of households with income $30k - 40k:
Skyland:
8.6% (18)
State:
7.7% (92,600)
Number of households with income $40k - 50k:
Skyland:
4.3% (9)
State:
7.9% (94,898)
Number of households with income $50k - 60k:
Skyland:
14.8% (31)
Nevada:
7.3% (88,037)
Number of households with income $60k - 75k:
Skyland:
4.3% (9)
State:
10.2% (122,705)
Number of households with income $75k - 100k:
Skyland:
19.1% (40)
State:
13.6% (162,870)
Number of households with income $100k - 125k:
Skyland:
0.0% (0)
State:
10.7% (127,735)
Number of households with income $125k - 150k:
Skyland:
10.5% (22)
State:
7.3% (86,891)
Number of households with income $150k - 200k:
Skyland:
0.0% (0)
State:
7.9% (94,679)
Number of households with income > $200k:
Skyland:
22.5% (47)
State:
8.8% (105,608)
Aggregate household income in Skyland in 2022: $25,662,537
Median family income in Skyland in 2022:
Skyland:
$84,139
State:
$85,593
Number of families with income $20k - 30k:
Skyland:
13.8% (22)
State:
4.9% (38,200)
Number of families with income $30k - 40k:
Skyland:
4.7% (8)
State:
6.2% (48,328)
Number of families with income $50k - 60k:
Skyland:
13.6% (22)
State:
6.7% (52,099)
Number of families with income $60k - 75k:
Skyland:
5.9% (9)
State:
10.3% (79,628)
Number of families with income $75k - 100k:
Skyland:
25.3% (41)
State:
15.3% (118,105)
Number of families with income $125k - 150k:
Skyland:
7.1% (11)
State:
8.7% (67,275)
Number of families with income > $200k:
Skyland:
29.5% (47)
State:
11.0% (84,905)
Median income for 2 person families:
Skyland:
$84,259
Nevada:
$77,817
Median non-family income in Skyland in 2022:
Skyland:
$48,820
State:
$46,176
Change in median non-family income between 2000 and 2022:
Skyland, Nevada:
+51.1%
State:
+53.5%
Median per capita income in Skyland in 2022:
Skyland:
$67,504
State:
$38,183
Change in median per capita income between 2000 and 2022:
Skyland, Nevada:
+147.4%
State:
+73.6%
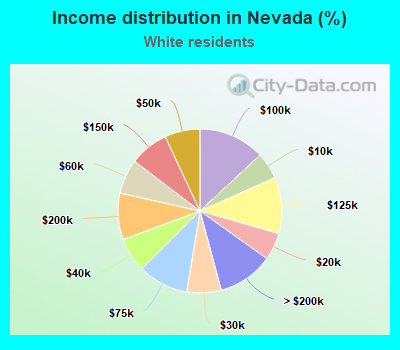
Income statistics for White residents
Median household income in Skyland, NV in 2022:
Skyland:
$84,634
State:
$78,201
Change in median household income between 2000 and 2022:
Skyland, Nevada:
+61.3%
Nevada:
+68.9%
Number of households with income < $10k:
Skyland:
0.0% (0)
State:
5.3% (36,449)
Number of households with income $10k - 20k:
Skyland:
0.0% (0)
State:
5.4% (37,351)
Number of households with income $20k - 30k:
Skyland:
5.3% (9)
State:
6.8% (46,880)
Number of households with income $30k - 40k:
Skyland:
9.4% (16)
Nevada:
6.8% (46,939)
Number of households with income $40k - 50k:
Skyland:
4.7% (8)
State:
7.0% (48,126)
Number of households with income $50k - 60k:
Skyland:
15.9% (27)
State:
6.9% (47,402)
Number of households with income $60k - 75k:
Skyland:
5.3% (9)
State:
10.0% (68,993)
Number of households with income $75k - 100k:
Skyland:
21.2% (36)
Nevada:
13.1% (90,439)
Number of households with income $100k - 125k:
Skyland:
0.0% (0)
State:
11.1% (77,026)
Number of households with income $125k - 150k:
Skyland:
11.8% (20)
Nevada:
7.7% (53,064)
Number of households with income $150k - 200k:
Skyland:
0.0% (0)
State:
9.2% (63,350)
Number of households with income > $200k:
Skyland:
26.5% (45)
State:
11.0% (75,795)
Aggregate household income in Skyland in 2022: $23,053,129
Median family income in Skyland in 2022:
Skyland:
$99,541
State:
$96,356
Number of families with income $30k - 40k:
Skyland:
5.2% (6)
State:
4.9% (21,005)
Number of families with income $50k - 60k:
Skyland:
15.2% (19)
Nevada:
6.1% (26,174)
Number of families with income $60k - 75k:
Skyland:
6.8% (9)
State:
9.7% (41,339)
Number of families with income $75k - 100k:
Skyland:
28.9% (36)
State:
14.9% (63,685)
Number of families with income $125k - 150k:
Skyland:
8.1% (10)
Nevada:
9.3% (39,853)
Number of families with income > $200k:
Skyland:
35.8% (45)
Nevada:
14.1% (60,154)
Median non-family income in Skyland in 2022:
Skyland:
$50,451
Nevada:
$49,909
Change in median non-family income between 2000 and 2022:
Skyland, Nevada:
+54.6%
State:
+62.2%
Median per capita income in Skyland in 2022:
Skyland:
$79,782
State:
$47,995
Income statistics for Asian residents
Number of households with income < $10k:
Skyland:
0.0% (0)
Nevada:
7.0% (7,099)
Number of households with income $10k - 20k:
Skyland:
0.0% (0)
State:
5.6% (5,682)
Number of households with income $20k - 30k:
Skyland:
100.0% (21)
Nevada:
6.7% (6,820)
Number of households with income $30k - 40k:
Skyland:
0.0% (0)
State:
6.5% (6,583)
Number of households with income $40k - 50k:
Skyland:
0.0% (0)
Nevada:
6.9% (6,984)
Number of households with income $50k - 60k:
Skyland:
0.0% (0)
State:
6.0% (6,068)
Number of households with income $60k - 75k:
Skyland:
0.0% (0)
State:
9.9% (10,078)
Number of households with income $75k - 100k:
Skyland:
0.0% (0)
State:
13.8% (14,050)
Number of households with income $100k - 125k:
Skyland:
0.0% (0)
State:
10.8% (10,934)
Number of households with income $125k - 150k:
Skyland:
0.0% (0)
State:
6.4% (6,456)
Number of households with income $150k - 200k:
Skyland:
0.0% (0)
State:
9.2% (9,397)
Number of households with income > $200k:
Skyland:
0.0% (0)
State:
11.3% (11,447)
Aggregate household income in Skyland in 2022: $44,311,117
Median per capita income in Skyland in 2022:
Skyland:
$36,656
Nevada:
$41,086
Change in median per capita income between 2000 and 2022:
Skyland, Nevada:
+76.1%
State:
+105.2%
Income statistics for Hispanic or Latino residents
Median per capita income in Skyland in 2022:
Skyland:
$38,479
State:
$24,350
Change in median per capita income between 2000 and 2022:
Skyland, Nevada:
+126.9%
State:
+96.3%
Income statistics for other residents
Median per capita income in Skyland in 2022:
Skyland:
$26,753
State:
$22,891
Change in median per capita income between 2000 and 2022:
Skyland, Nevada:
+117.7%
State:
+93.2%
Discuss Skyland, Nevada (NV) on our hugely popular Nevada forum.